When you build software, its terminology, concepts and relationship between them is quite obvious to you, when you’re starting to use software built by someone else – might not be so much so. In this blog post I tried to cover most important Coroot concepts and terminology – reading it will hopefully help you to understand Coroot much better if you’re just starting up with it.
Projects
Projects allow you to work with completely independent environments/projects in Coroot. You can use different configurations for different Projects. All Coroot objects such as Nodes, Deployments, Applications, Incidents belong to specific project. Coroot comes with a pre-configured “default” project, yet you can create additional projects as you require.
Application
Application is the main concept in Coroot Observability – multiple instances of the program performing the same function are seen as the same application. Coroot uses Application terminology both for end user applications, as well as for downstream services such as databases.
Coroot performs such grouping based on Kubernetes Metadata in Kubernetes environment and based on container or Systemd unit name in non-Kubernetes environments. This means all MySQL servers running on all hosts will be grouped in the single application called mysql. You can adjust that through custom application definition as desired in application settings, go to the Project Settings, and click on Applications.

Application Instance
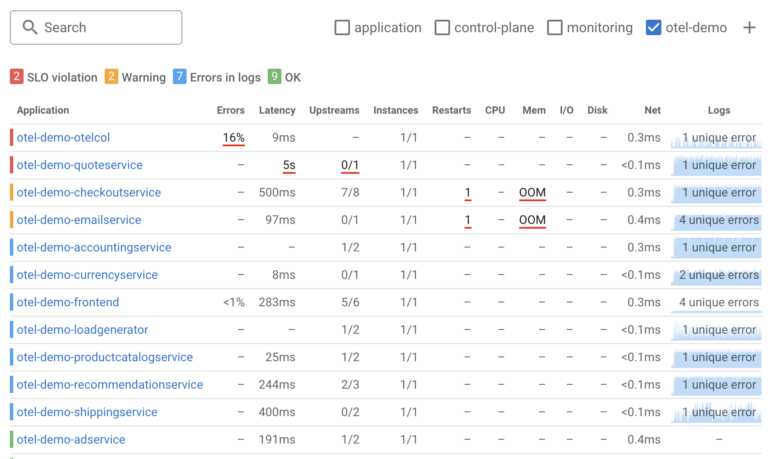
You may deploy more than one application instance for scale or redundancy – meaning running several containers or running service on several nodes. In some cases, i.e. in the Kubernetes environment the desired number of instances is known, hence 2/3 notation for Instances means 2 out of 3 instances are running.
In addition to Instance health Coroot is tracking instance restarts as these can often be early sights of the problem
Application Category
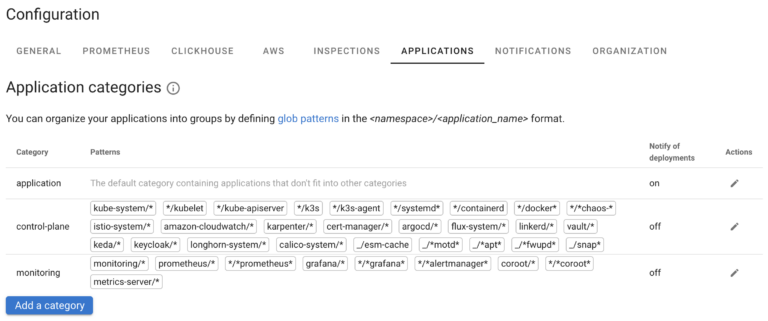
Coroot groups Applications into Categories, which corresponds to the purpose of the applications. Coroot comes with default Categories of “application”, “control-plane” and “monitoring” and places common applications to appropriate categories based on their name. You can adjust categories as well as what applications are placed to what Category in Application category settings
Application Type
Application Type allows you to quickly identify what type of application you’re dealing with – is it a service implemented in a particular programming language or particular database ? Coroot performs best effort to identify technology but it is not 100% correct. In particular if you’re using fat containers or otherwise mix many different components together, Coroot will only display the type of one of the components.
Upstream Application
Upstream Application is an application on which current application depends. On the Health page Upstreams are printed as 2/3 where the first number identifies the number of healthy upstreams (performing within SLOs) and the second number, a total number of upstream applications communicated with, within selected time window.
Downstream Application
Application Downstream to current Application, is application which depends on current application

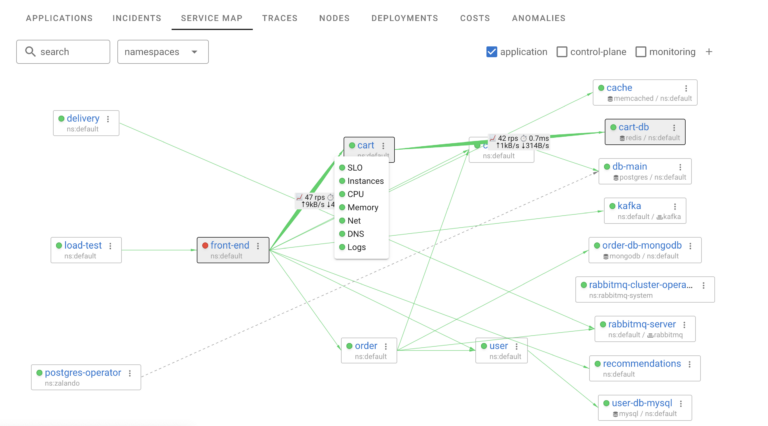
In this example, for application “cart”, “cart-db” is upstream application as “cart” depends on it and “front-end” is downstream application, which depends on application “cart”
Node
Nodes is where your workload runs, they corresponds to physical machines, virtual machines or cloud instances.
Namespace
Coroot namespaces correspond to Kubernetes cluster namespaces
Health
Health Pages shows the list of Applications observed by Coroot. shown on top. Applications may have red flag, meaning one of SLO (Service Level Objectives) is violated, Blue Flag indicating there are errors in the log, Yello flag if if there is a warning and violet flag if integration is required to instrument this application.
Applications are sorted so the “most unhealthy” of them are on top of this list, sorting is done by number of SLO violations, number of warnings, number of errors in the logs at the last available data point.
At this point you can’t sort this table any other way.
As you look at health of specific application you can see its health status
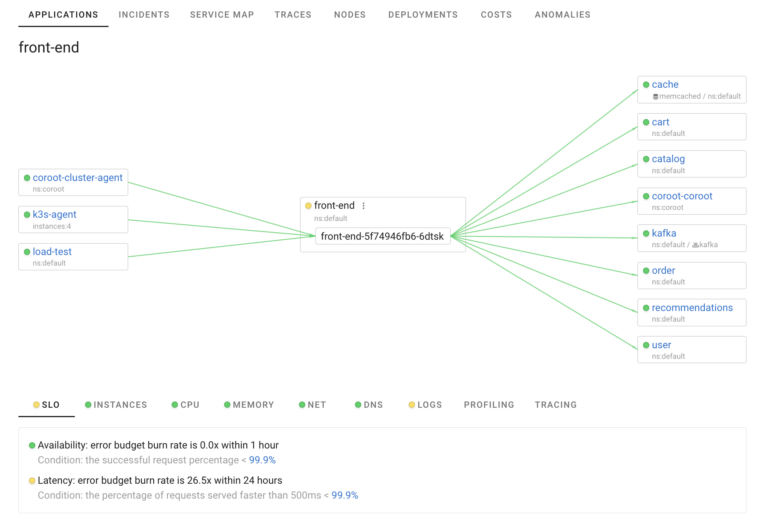
As well as specific areas which may need attention – in this example we see there is SLO violation as well as some errors in Error logs
SLO (Service Level Objective)
Service Level Objective is the a definition for Service (Application) to performing within requirements (objectives) – Coroot is focuses on two most valuable SLO parameters – Availability, defined as what portion of requests completes successfully (without errors or timeouts) and Latency, which is defined as portion of requests completing within defined time.
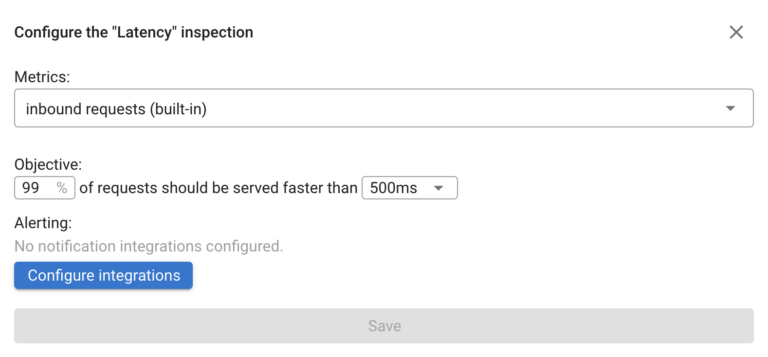
By default Coroot uses 99% availability SLO and 99% requests faster than 500ms as Latency (Performance) SLO. The compliance with SLO is checked once per minute
You can override those settings both on per project and per application level.
Incidents
When it comes to Incidents Coroot follows a “less is more” philosophy, reporting real issues impacting your applications and needing attention while reducing noise. This is done by creating incidents based on SLOs – when application is actually malfunctioning or not performing properly. See Service Level Objective (SLO) monitoring for details.
Coroot Automatically tracks which Incidents are ongoing and which are no more. Such incidents will be automatically market resolved, eliminating need for manual incident management.
By default you will see only ongoing incidents, yet you can always access resolved incidents by selecting “Show Resolved” filter.

To learn more about this topic, check Coroot Incidents page in the documentation
Error Budget
One of SLOs (Service Level Objectives) is Availability, which is defined as percent of requests which are successful, the rest can be completed with errors without compromising SLO. If your Availability SLO is 99.9%, this means your error budget is 0.1%. When requests are completed with errors, the Error Budget is consumed (or Burned). For example if SLO is 99.9% and 1% of requests are completing with errors, This means Error Budget is exceeded 10x or Burned at rate of 1000%. Error Budget Consumption or Burn Rate shows you how much you’re exceeding your SLOs.
Notifications
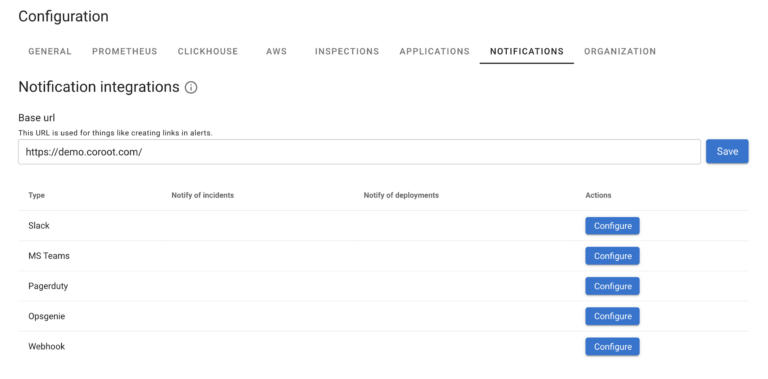
Coroot includes basic Notification support – you can configure Coroot to be notified of Incidents or new deployments using a variety of channels through flexible integration. For advanced notification features such as acknowledgement, routing, snoozing etc you should use third party software specialising in notification management.
Anomalies
With Incidents in Coroot being very strictly based on SLO violations, you may wonder if there is a way to see latency or error spikes which are not yet causing SLO violations which can be very helpful to spot potential problems or assist with incident resolution.
Coroot allows you to see such issues which could be cause of concern, but may not yet caused SLO violation in Anomalies tab:
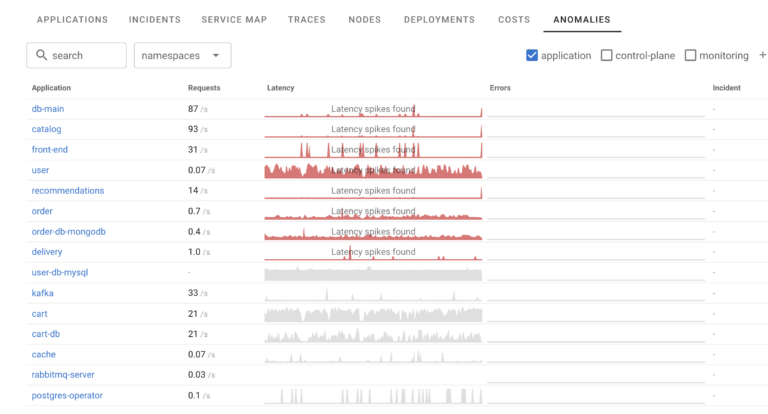
You can see all all the applications here with Grey meaning no issues and Red, cases when Latency (or Error) spikes are found. One application also has SLO violation so ongoing incident is created for it.
Inspections
Coroot constantly evaluates all instrumented applications, whenever they are healthy. The checks Coroot performs are called inspections. Inspections have different scopes, rather than being applied only to specific inspection instance – for example Coroot checks for number of application instances running vs desired number or whenever deployment takes too long. There are also special inspections for specific database technologies or JVM
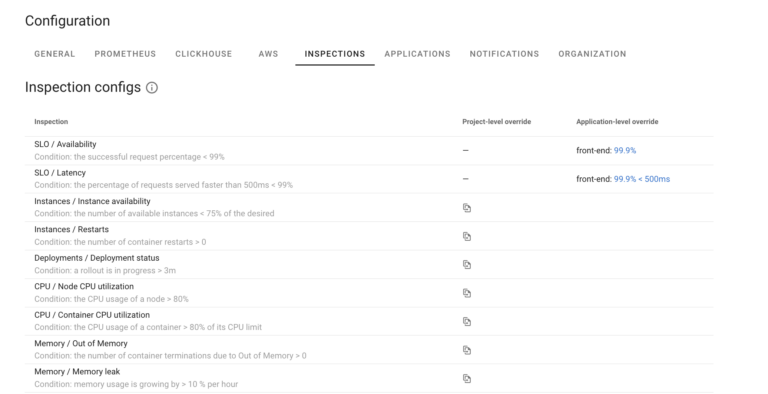
SLOs are considered special types of Inspections. They are special for two reasons.
First application violating SLO will be considered critical as it means Application is not operating according to requirement and something certainly needing attention, where violating other inspections is considered Warning, as if there is no corresponding SLO violation it has not critically impacted application performance yet.
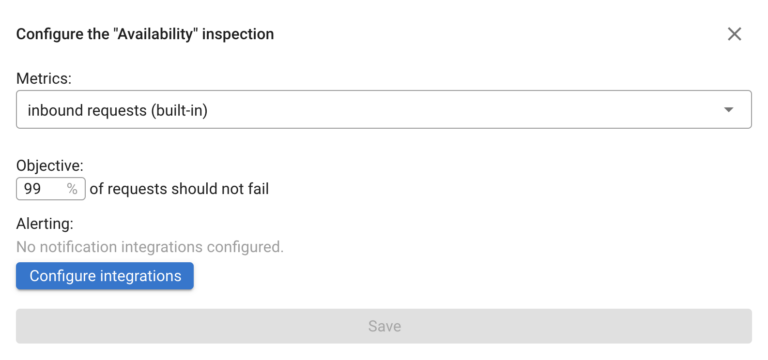
Second SLOs offer additional customization, where you can identify custom way to compute availability and latency SLOs.
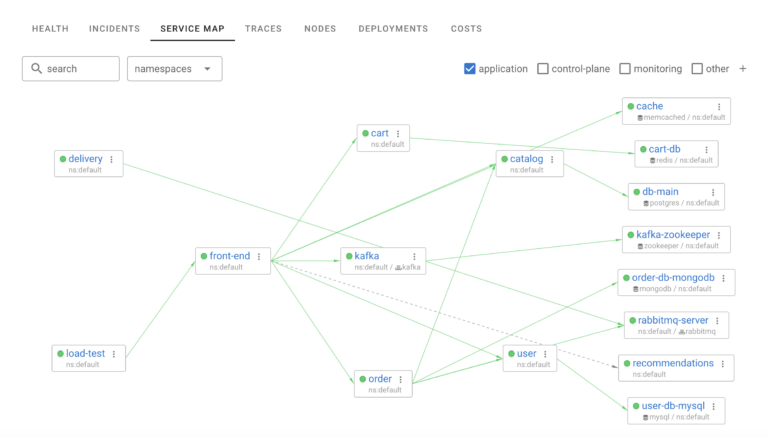
Service Map
Service Map is one of the core views in Coroot – it allows you to quickly see how Applications are interacting between each. Service Map is built analyzing actual network communication between applications. It allows to see both healthy communication as well as failed connections or increased latency at glance view
If you Mouse Over any particular application you can easily see its Upstream and Downstream communications, showing you consumed bandwidth, number of requests and their latency as well as overall health of that application
Logs
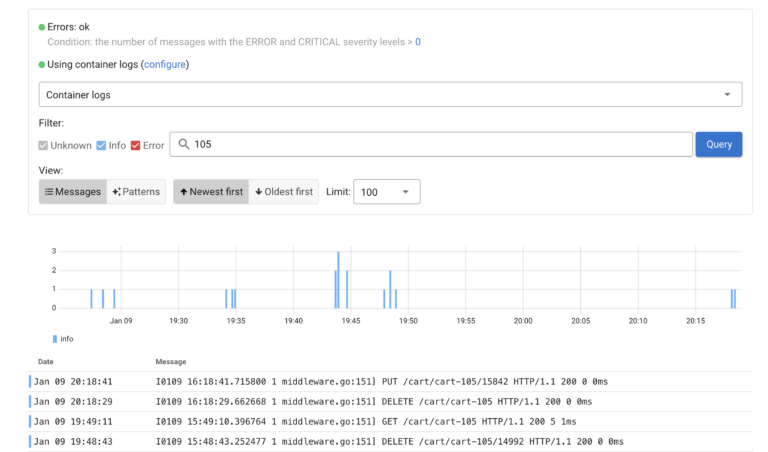
Coroot automatically detects application/container logs and discovers patterns in error messages in them.
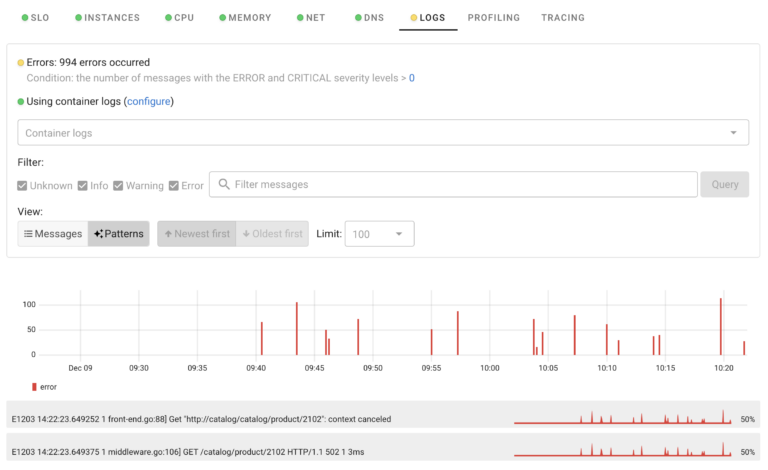
This can be very helpful to understand what specific log messages correspond to application problems.
If you want to take a look into the Raw Logs Coroot allows it too click on “Messages” and you will be able to filter by Message severity as well as perform the search on the message contents
Traces
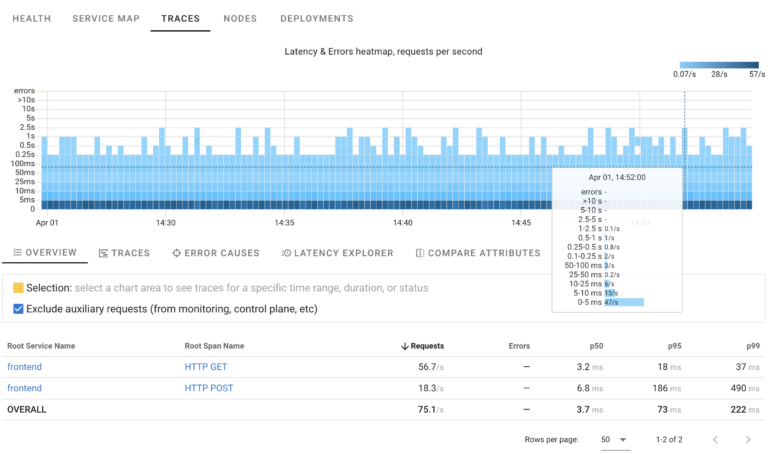
Distributed Traces, which we abbreviate to just Traces allow to trace requests as they are processed by different components in your system. It is a great technology to understand the cause of failures or Performance problems. For distributed tracing functionality Coroot integrates with OpenTelemetry (Otel) and can use eBPF based simulated traces, which are available with zero instrumentation effort.
Deployments
Coroot Integrates with Kubernetes Deployments. If you use Deployments to rollout applications in Kubernetes environment, Coroot will be able to track the the differences in resource usage between them and identify if particular deployment may be responsible for problems with your application performance
Costs
Coroot helps you to understand costs of running your applications and nodes as well as costs of overprovisioning. Is able to automatically identify instance types and their list prices for major clouds as well as Cross-AZ and egress traffic costs.
These costs are commonly responsible for a large portion of cloud costs and especially can be responsible for unexpected expenses.
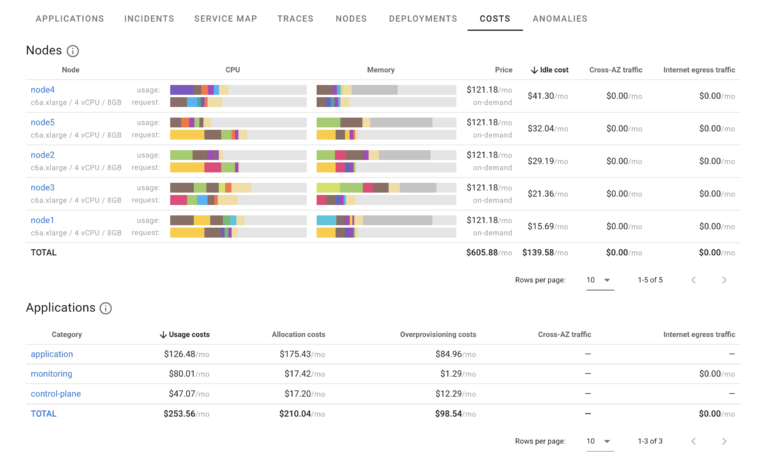
At this point Coroot does not track costs related to block storage, object storage or other cloud services. More details are available in Coroot Documentation on Costs
Profiling
Profiling in Coroot is powerful feature to understand resource consumption in the application, mapping it to specific areas in the code, which make it very actionable by development team
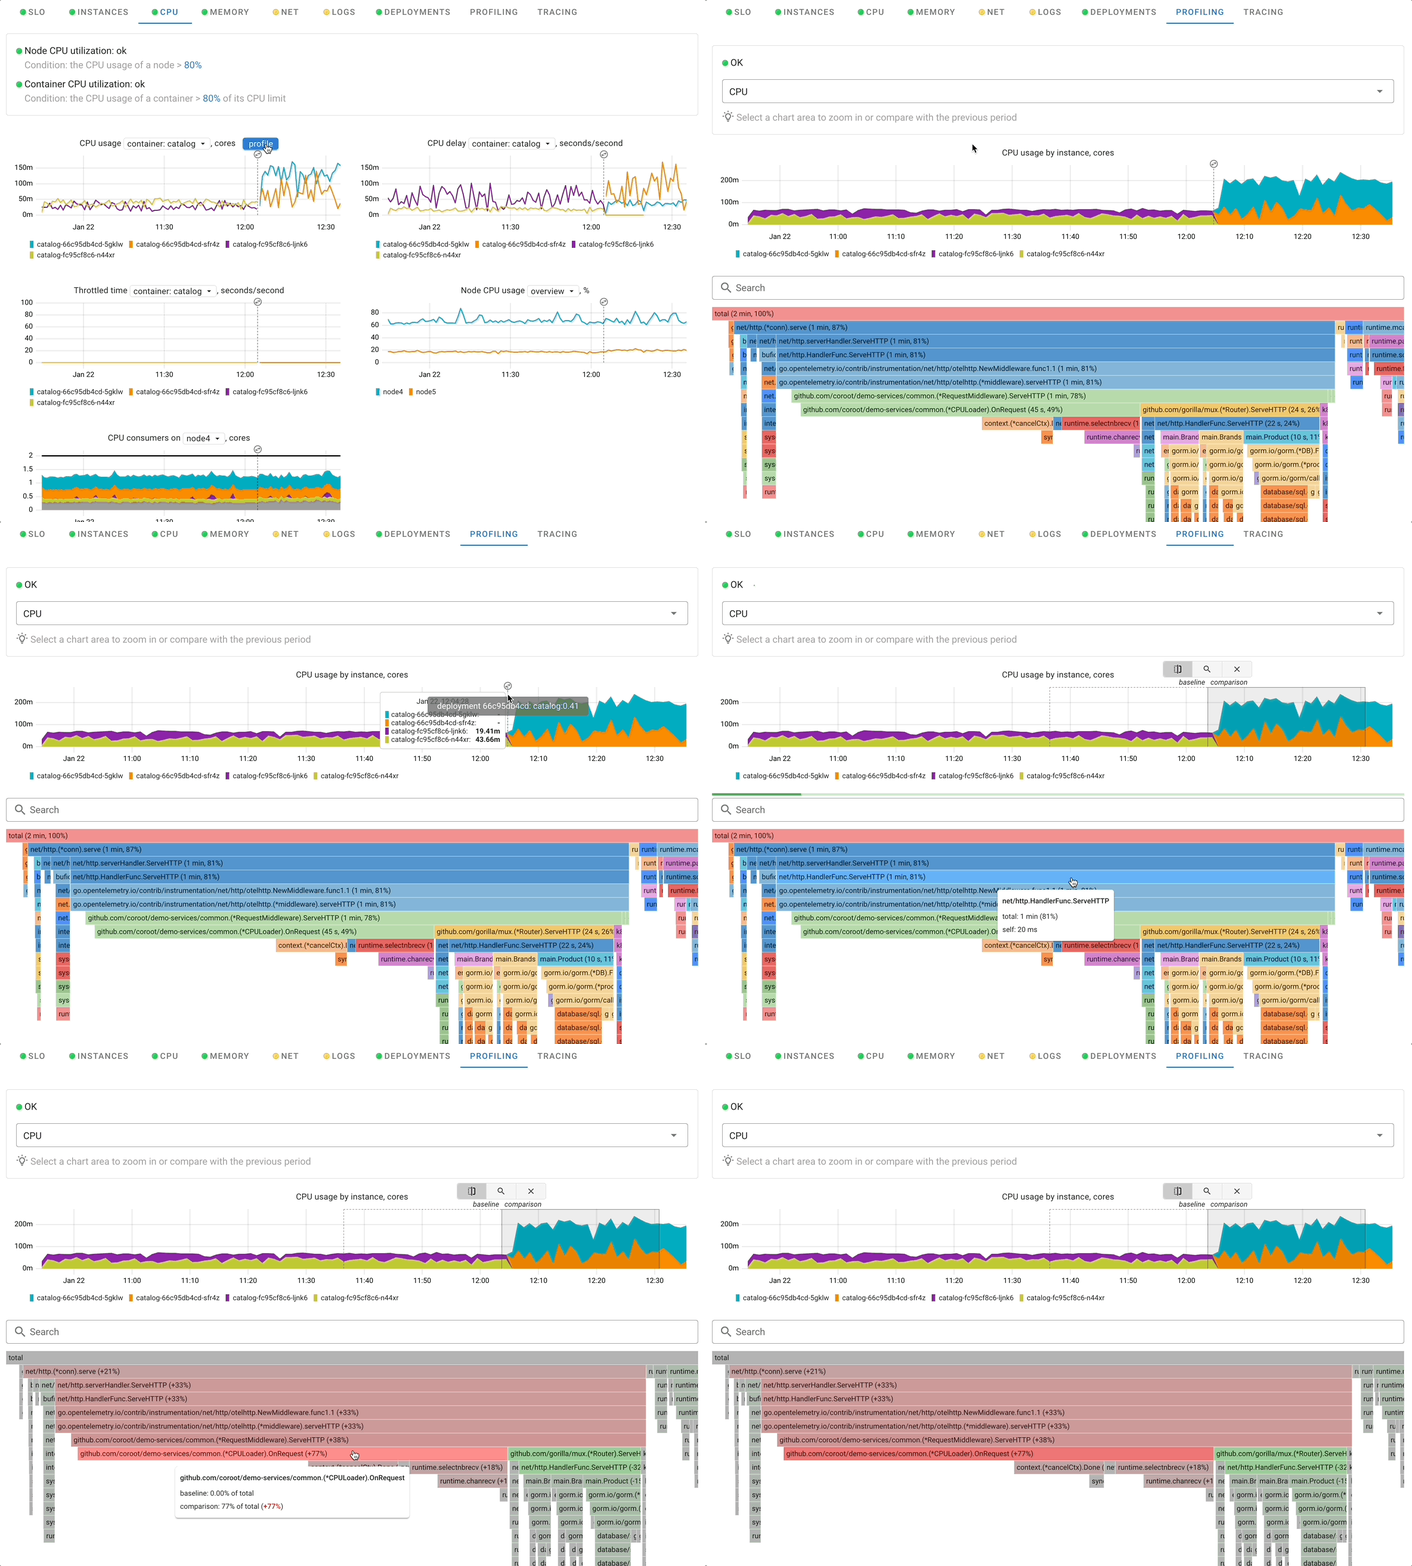
Coroot can profile CPU with zero instrumentation and lowerlowe overhead with use of eBPF technology. For GoLang application Coroot supports integration with built-in profiling allowing to profile not just CPU but also memory consumption.
When using Profiling Coroot allows you to examine any period of time as well as contrast two different periods of time to easily identify the causes of excessive resource consumption. Read more in Coroot Profiling Overview
DNS
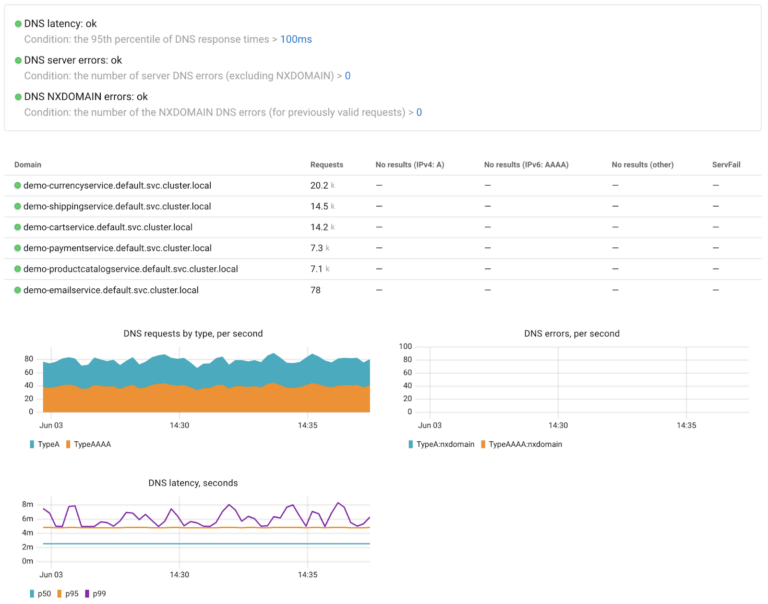
DNS (Domain Name System) is a service which underpins most of interaction between applications, as before connection to a desired endpoint can be established its IP address is resolved through DNS. As such failures in DNS system can have massive impact throughout the system.
Coroot provides DNS observability on per application basics, allowing you to easily understand if particular applications are impacted by DNS problems or which domains are failing to be resolved
Learn more about why you should cared about DNS observability
External Endpoints
As Coroot tracks actual network communication between applications it will also discover connections to endpoints which are not instrumented by Coroot. These are called External Endpoints. Some External endpoints correspond to parts of your environment not yet instrumented with Coroot and provide opportunity for bettering your observability, others are third party external endpoints which can’t be additionally instrumented by you.
Even if you do not additionally instrument External Endpoint Coroot will provide you with insights about endpoint Performance and Availability.
Time Window
You will in Coroot there is always some Time Window specified for all visualizations, including those which may not look like historical visualizations, for example map of current services.
The reason for this approach is – Coroot is designed for highly dynamic environments like Kubernetes, which means there can be many components which existed at some point, but not any more and showing all of them will be noisy. Instead specifying Time Window ensures you only see the components and activities (ie communication between application) which existed during this time window
Summary
This was not so brief overview of main concepts and terminology at Coroot. If you got up to this point you should be well underway getting most out of Coroot deployed in your environment. Still have questions ?
Check out Coroot Documentation or ask us on Coroot Community Slack.


