App-centric inspections: turning the conventional metric analysis inside out
 Nikolay Sivko
We’ve just released Coroot Community Edition v0.5. This release introduces application-centric inspections that make troubleshooting distributed systems even easier and more efficient.
Let’s dive into the details of how this differs from conventional dashboards and alerts.
When you look at any dashboard, you are mentally evaluating whether the metrics are within their acceptable range of values or not. In order to automate this process, you can configure alerting rules to notify you when a metric exceeds a threshold. However, alerts usually have no context, so you have to manually extract issues relevant to a particular app from the alert stream.

For example, a contextless alerting rule:
- alert: HostHighCpuLoad
  expr: 100 - (avg by(instance) (rate(node_cpu_seconds_total{mode="idle"}[2m])) * 100) > 80
  for: 0m
  labels:
    severity: warning
  annotations:
    summary: Host high CPU load (instance {{$labels.instance}})
    description: "CPU load is > 80%"
This rule has no way to determine which applications are running on a particular node and annotate alerts with them. Therefore, if an application violates its SLOs (Service Level Objectives) due high CPU utilization of a related node, you will get two unrelated alerts and have to match them manually. Now imagine that several unrelated issues occur at once in your Kubernetes cluster of 100 nodes and 500 applications…
That’s exactly the problem Coroot is pretty good at solving!
Application-centric dashboards on steroids
In order to get a clear picture of a distributed system, Coroot builds a model of it by:
- grouping individual containers into applications
- enriching each container representation with resource consumption statistics, subsystems statuses, logged errors and runtime-specific data
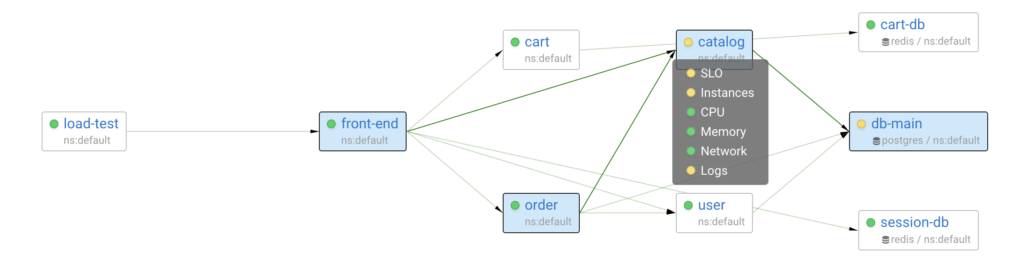
- linking applications to each other regarding their actual connections

Using such a model allows Coroot to audit all subsystems within the context of a particular application. In other words, each inspection is aware of the instances, nodes, and upstream services related to any given app.
Going back to the example, Coroot only checks CPU utilization of the nodes where the application is running.
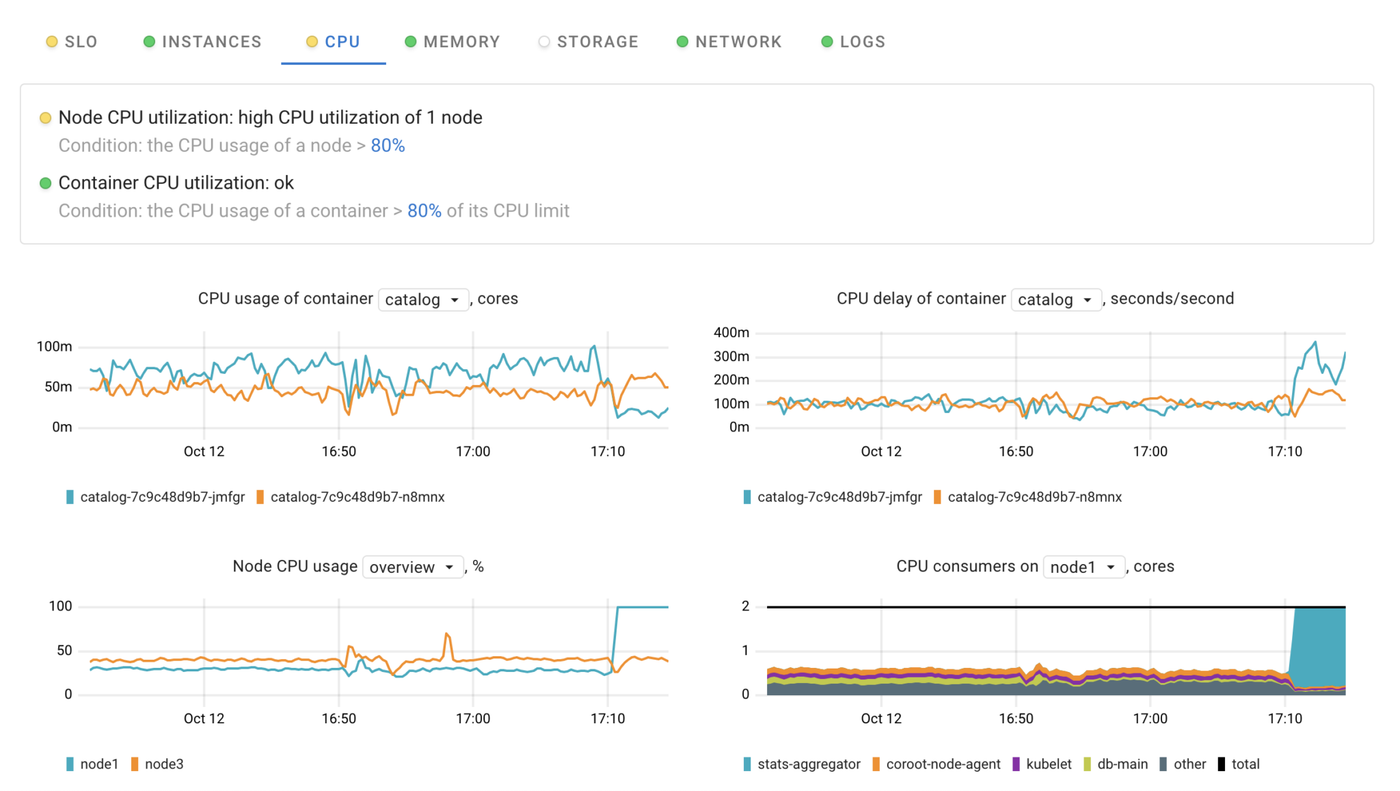
It doesn’t matter how many nodes are in the cluster or how many applications are running in it, these supercharged dashboards allow you to focus on a particular app and only on the relevant nodes. Moreover, each dashboard has a status, so you can quickly check if there are any issues without having to open the corresponding dashboard.
Application status
There are two fundamentally different types of inspections:
- Symptom-based inspections which identify issues that affect users (SLO, Postgres, Redis).
- Supplementary inspections that help in cause analysis (Instances, CPU, Memory, Storage, Network, Logs).
To highlight the status of each application on the overview page, Coroot takes into account only statuses of symptom-based inspections.
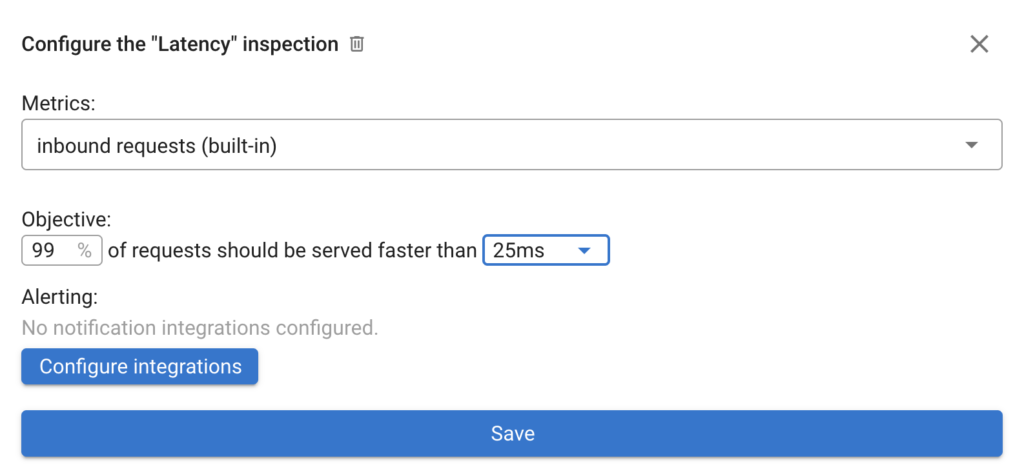
You can easily configure the Latency and Availability SLOs for an application by using your custom Prometheus metrics:
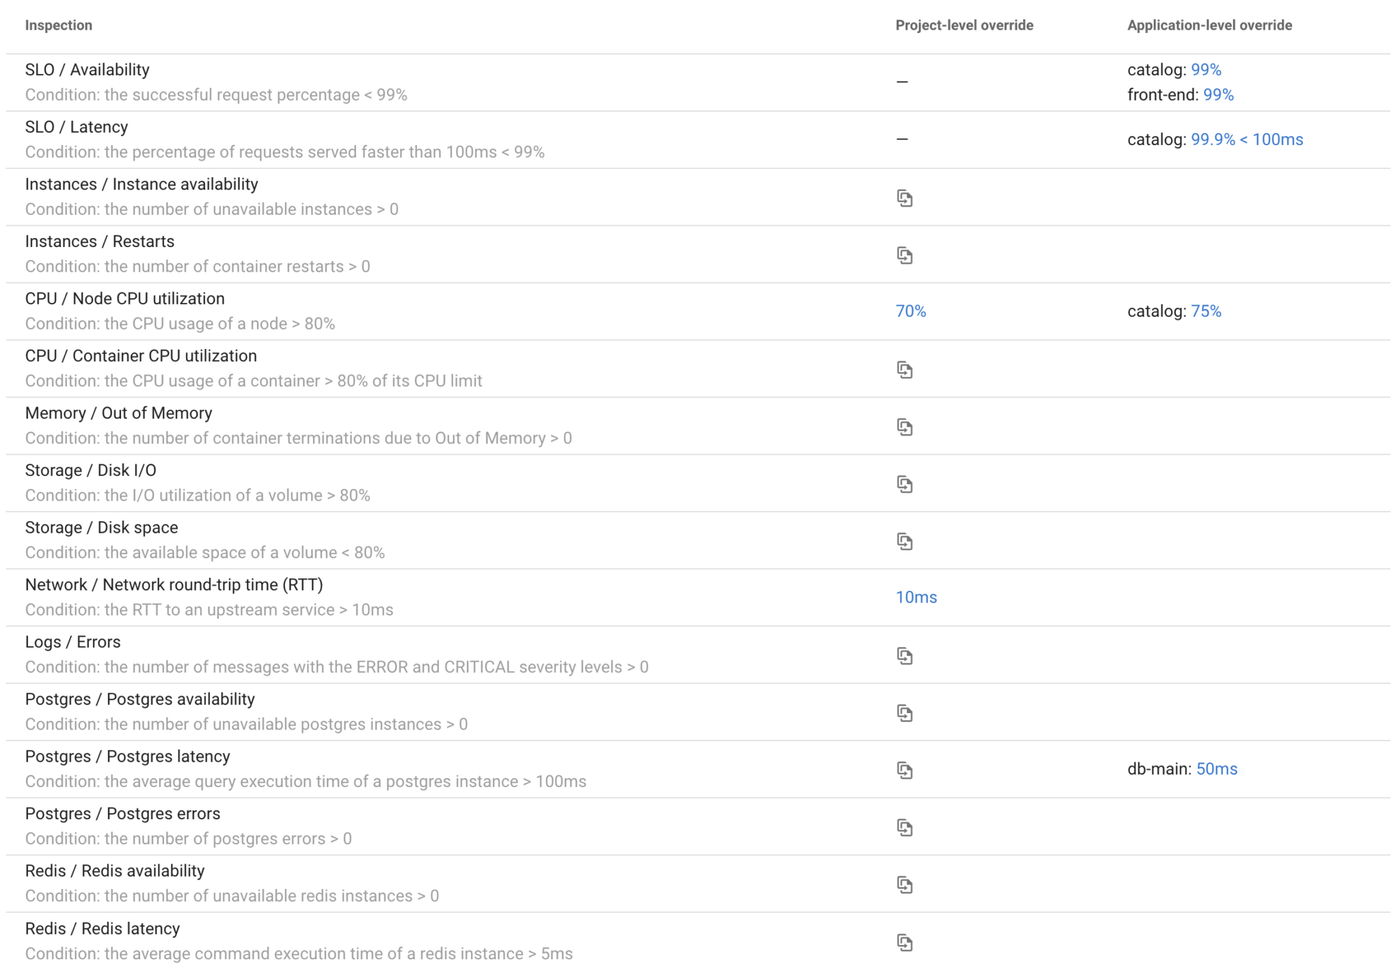
Instead of configuring custom SLOs for the Postgres and Redis databases, you can override the thresholds of the built-in checks.
Conclusion
As you can see, Coroot’s approach to metric analysis is not rocket science, but it can greatly improve observability of any distributed system.
Follow the instructions on our Getting started page to try Coroot now. If you like Coroot, give us a ⭐ on GitHub️.
Any questions or feedback? Reach out to us on Slack.