Coroot v1.0: Unified Observability for Heterogeneous Infrastructures
 Nikolay Sivko
In the current cloud-native era, almost every organization has one or more Kubernetes clusters in their production infrastructures. However, only a small percentage of companies, especially enterprise-level ones, can claim that they are fully committed to running everything exclusively on Kubernetes. The most typical scenario is that new stateless services are deployed on Kubernetes, while legacy applications, third-party services, and databases continue to run on dedicated VMs or bare-metal nodes.
To effectively monitor and understand a system, it’s essential to have a complete view without any blind spots.
Many Coroot users are happy using it to monitor apps in Kubernetes clusters, but they find it difficult to deploy Coroot in non-Kubernetes environments. We’re pleased to announce that Coroot 1.0 now makes it easier to monitor heterogeneous infrastructures.
Now it’s easier to add standalone nodes to a Coroot instance in Kubernetes. The agent, deployed as either a systemd service or Docker container on Virtual Machines or bare-metal servers, sends telemetry data (metrics, logs, traces, and profiles) directly to the Coroot instance. This eliminates the need to configure Prometheus to discover these nodes—just configure the agents with the Coroot endpoint.

As a result, you will have consistent observability regardless of whether services are deployed in Kubernetes or not.
The second improvement is that you can now deploy the entire Coroot stack using Docker Compose or Docker Swarm, in addition to Kubernetes.

So, even if you’re not using Kubernetes, deploying Coroot on a dedicated VM gives you full system visibility without needing to switch to modern tech stacks.
Demo
Let’s remember how applications used to be before Kubernetes became popular. Think of an app and its database installed as DEB packages directly on Linux machines (Ah, I sometimes miss those days).

Now let’s install Coroot on an Ubuntu VM to make this app observable.
Step #1: install Docker Compose
apt update && apt install -y docker-compose-v2
Step #2: install Coroot
curl -fsS https://raw.githubusercontent.com/coroot/coroot/main/deploy/docker-compose.yaml | docker compose -f - up -d
That’s it, now we can access Coroot at http://<NODE_IP>:8080/. Currently, Coroot is monitoring only this specific node:
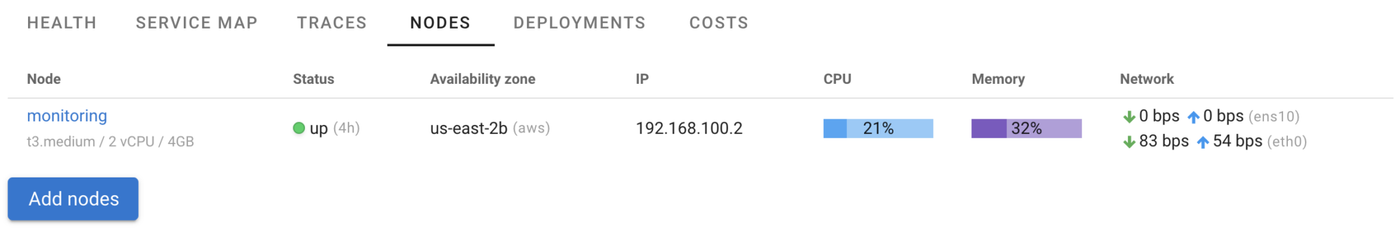
Instructions on how to add other nodes are available by clicking the “Add nodes” button:
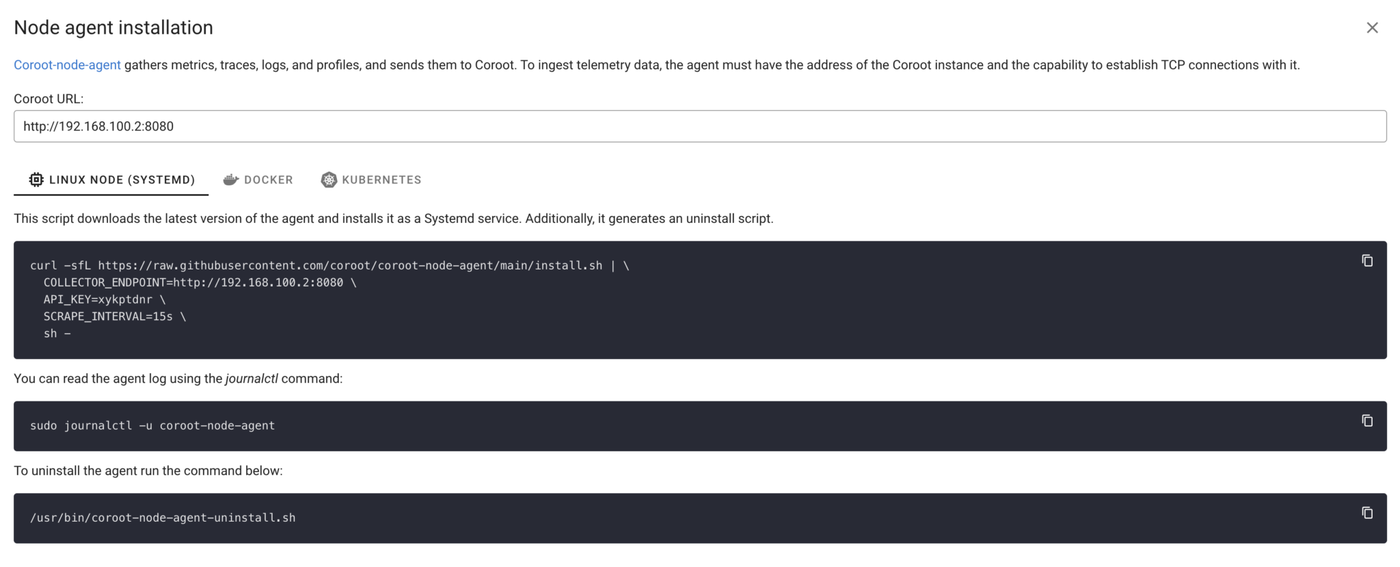
Step #3: install the agent to the application and DB nodes:
curl -sfL https://raw.githubusercontent.com/coroot/coroot-node-agent/main/install.sh |
  COLLECTOR_ENDPOINT=http://192.168.100.2:8080
  API_KEY=xykptdnr
  SCRAPE_INTERVAL=15s
  sh -
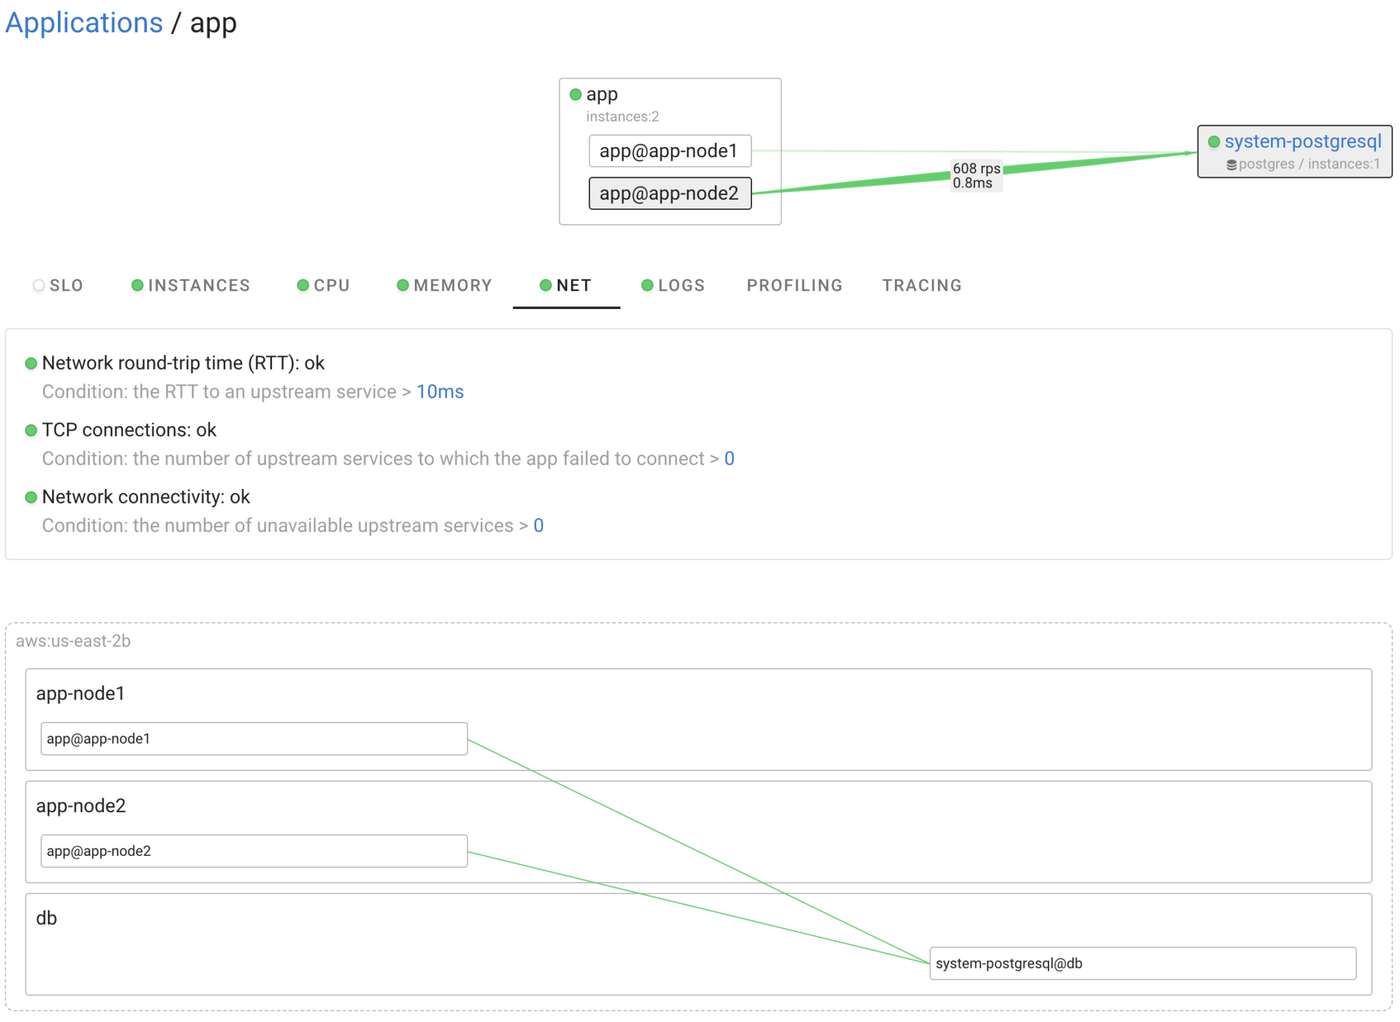
A minute later, we can see that the app instances and the Postgres database have appeared in the Coroot UI. All Coroot capabilities are fully supported.
Conclusion
We at Coroot work hard to make even complex systems observable! Coroot v1.0 is a huge milestone for us, and we believe its new features will enable you to troubleshoot like a ninja.
Coroot v1.0.0 is already available, so you can try it out right now.
Try Coroot Enterprise now (14-day free trial is available) or follow the instructions on our Getting started page to install Coroot Community Edition.
If you like Coroot, give us a ⭐ on GitHub️ – it helps us reach more engineers and improve our product for you.
Any questions or feedback? Reach out to us on Slack.