As more organizations move their databases to cloud-native environments, effectively managing and monitoring these systems becomes crucial. According to Coroot’s anonymous usage statistics, 64% of projects use PostgreSQL, making it the most popular RDBMS among our users, compared to 14% using MySQL. This is not surprising since it is also the most widely used open-source database worldwide. At Coroot, we strive to provide a smooth PostgreSQL monitoring experience, regardless of whether you run your databases on AWS RDS, bare-metal servers, dedicated EC2 instances, or Kubernetes.
Kubernetes is more than a platform for running containerized applications. It also enables better management of databases by allowing automation of tasks like backups, high availability, and scaling through its operator framework. This provides a management experience similar to using a managed service like AWS RDS but without vendor lock-in and often at a lower cost.
Coroot already supports most popular Postgres operators for Kubernetes such as Zalando’s Operator, Percona Operator, and Stackgres. However, the list would not be full without CloudNativePG, so let’s fix this out.
CloudNativePg is an open-source operator originally created by EDB, the oldest and the biggest Postgres vendor world-wide. As other operators, CNPG helps manage PostgreSQL databases on Kubernetes, covering the entire operational lifecycle from initial deployment to ongoing maintenance. Worth to mention that this is the youngest Postgres operator on the market, but its open source traction grows rapidly and based on my observations it’s the favorite operator across Reddit users.
In this post I’ll install a CNPG cluster in my lab, instrument it with Coroot, then generate some load and introduce some failures to ensure high availability and observability.
Setting up the cluster
Installing the CloudNativePG operator is simple:
helm repo add cnpg https://cloudnative-pg.github.io/charts
helm upgrade --install cnpg cnpg/cloudnative-pg
To deploy a cluster, create a Kubernetes custom resource:
kind: Cluster
metadata:
  name: pg-cluster
spec:
  instances: 3
  primaryUpdateStrategy: unsupervised
  storage:
    size: 30Gi
  postgresql:
    shared_preload_libraries: [pg_stat_statements]
    parameters:
      pg_stat_statements.max: "10000"
      pg_stat_statements.track: all
  managed:
    roles:
    - name: coroot
      ensure: present
      login: true
      connectionLimit: 2
      inRoles:
      - pg_monitor
      passwordSecret:
        name: pg-cluster
---
apiVersion: v1
data:
  username: ******==
  password: *********==
kind: Secret
metadata:
  name: pg-cluster
type: kubernetes.io/basic-auth
As you can see, I’ve enabled the pg_stat_statements extension and created a role named “coroot” for collecting Postgres metrics.
Installing Coroot
In this post, I’ll be using the Community Edition of Coroot, but the installation steps for the Enterprise Edition are quite similar.
Here are the commands to install the Coroot Operator for Kubernetes along with all Coroot components:
helm repo add coroot https://coroot.github.io/helm-charts
helm repo update coroot
helm install -n coroot --create-namespace coroot-operator coroot/coroot-operator
helm install -n coroot coroot coroot/coroot-ce
To access Coroot, I’m forwarding the Coroot UI port to my local machine. For production deployments the operator can create an Ingress.
kubectl port-forward -n coroot service/coroot-coroot 8083:8080
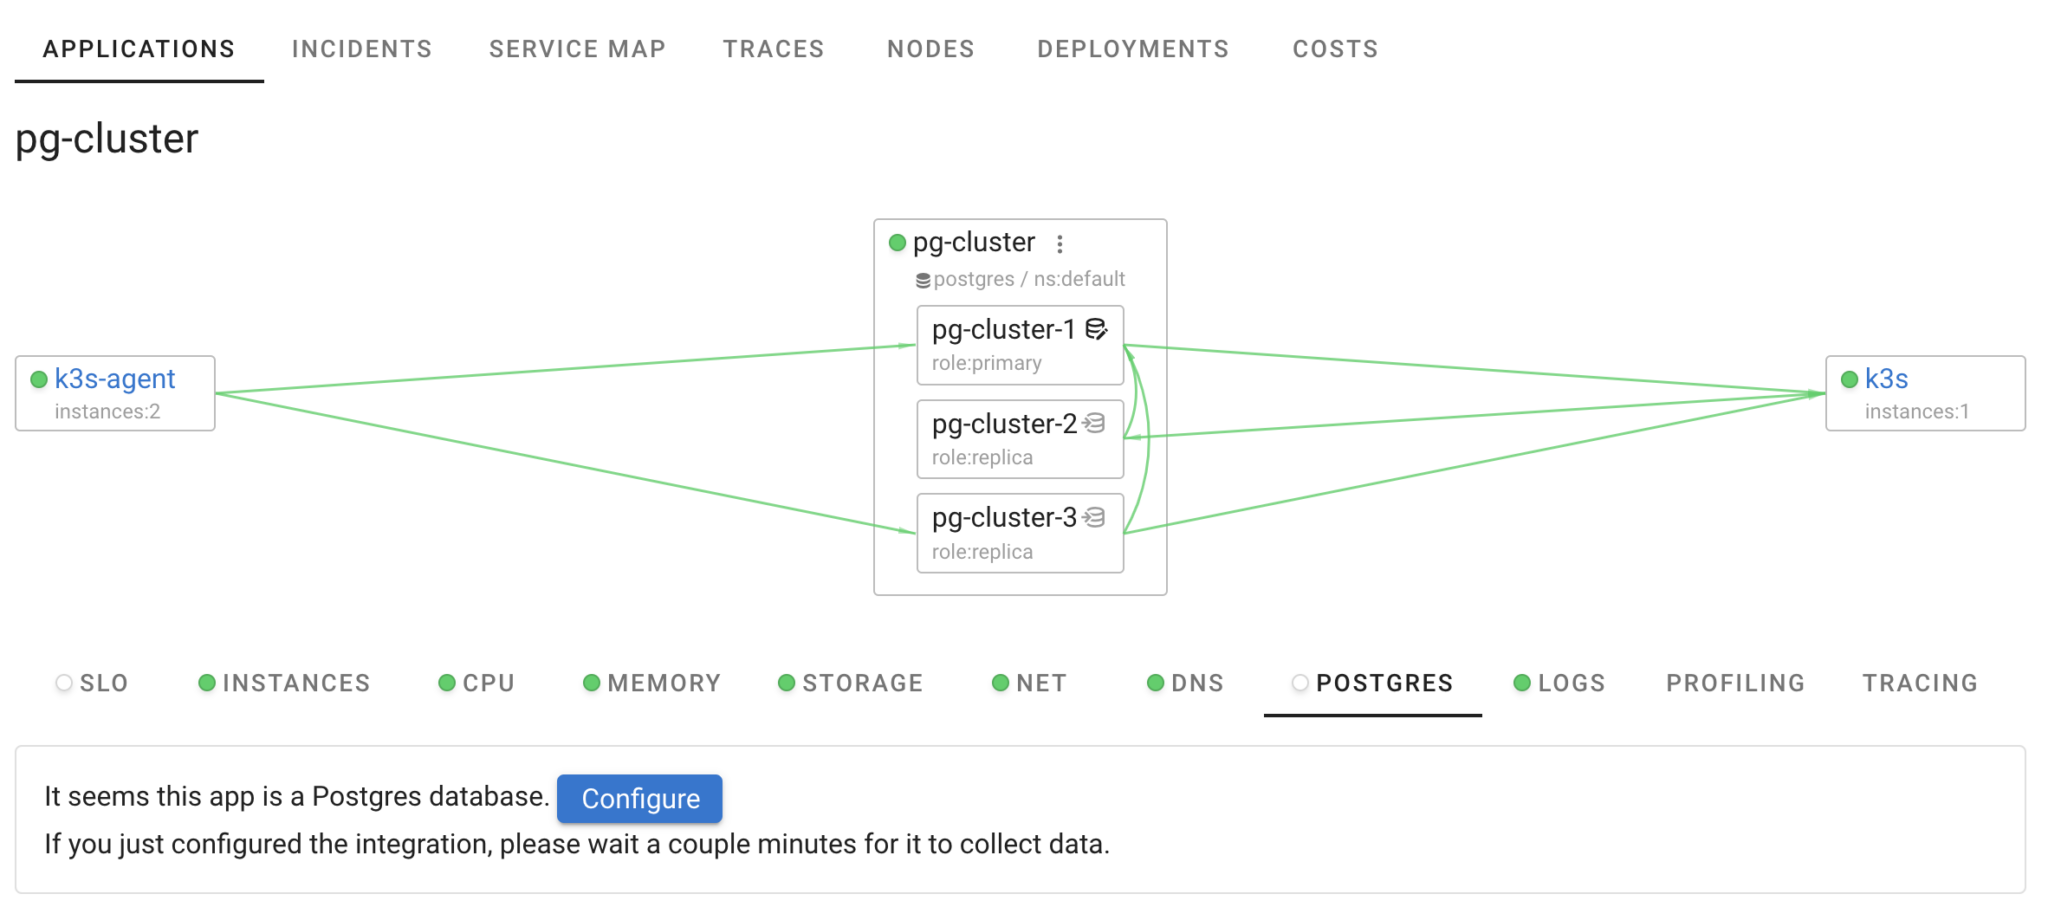
In the UI, we can see two applications: the operator (cnpg-cloudnative-pg) and our Postgres cluster (pg-cluster). Coroot has also identified that pg-cluster is a Postgres database and suggests integrating Postgres monitoring.
Coroot leverages eBPF to monitor Postgres queries between applications and databases, requiring no additional integration. While this approach provides a high-level view of database performance, it lacks the visibility needed to understand why issues occur within the database internals.
To bridge this gap, Coroot also collects statistics from Postgres system views such as pg_stat_statements and pg_stat_activity, complementing the eBPF-based metrics and traces.

The Kubernetes approach to monitoring databases typically involves running metric exporters as sidecar containers within database instance Pods. However, this method can be challenging for certain use cases. For example, CNPG doesn’t support running custom sidecar containers, and their CNPG-i capability requires specific plugin support and is still in the experimental stage.
To address these limitations, Coroot has a dedicated coroot-cluster-agent that can discover and gather metrics from databases without requiring a separate container for each database instance.
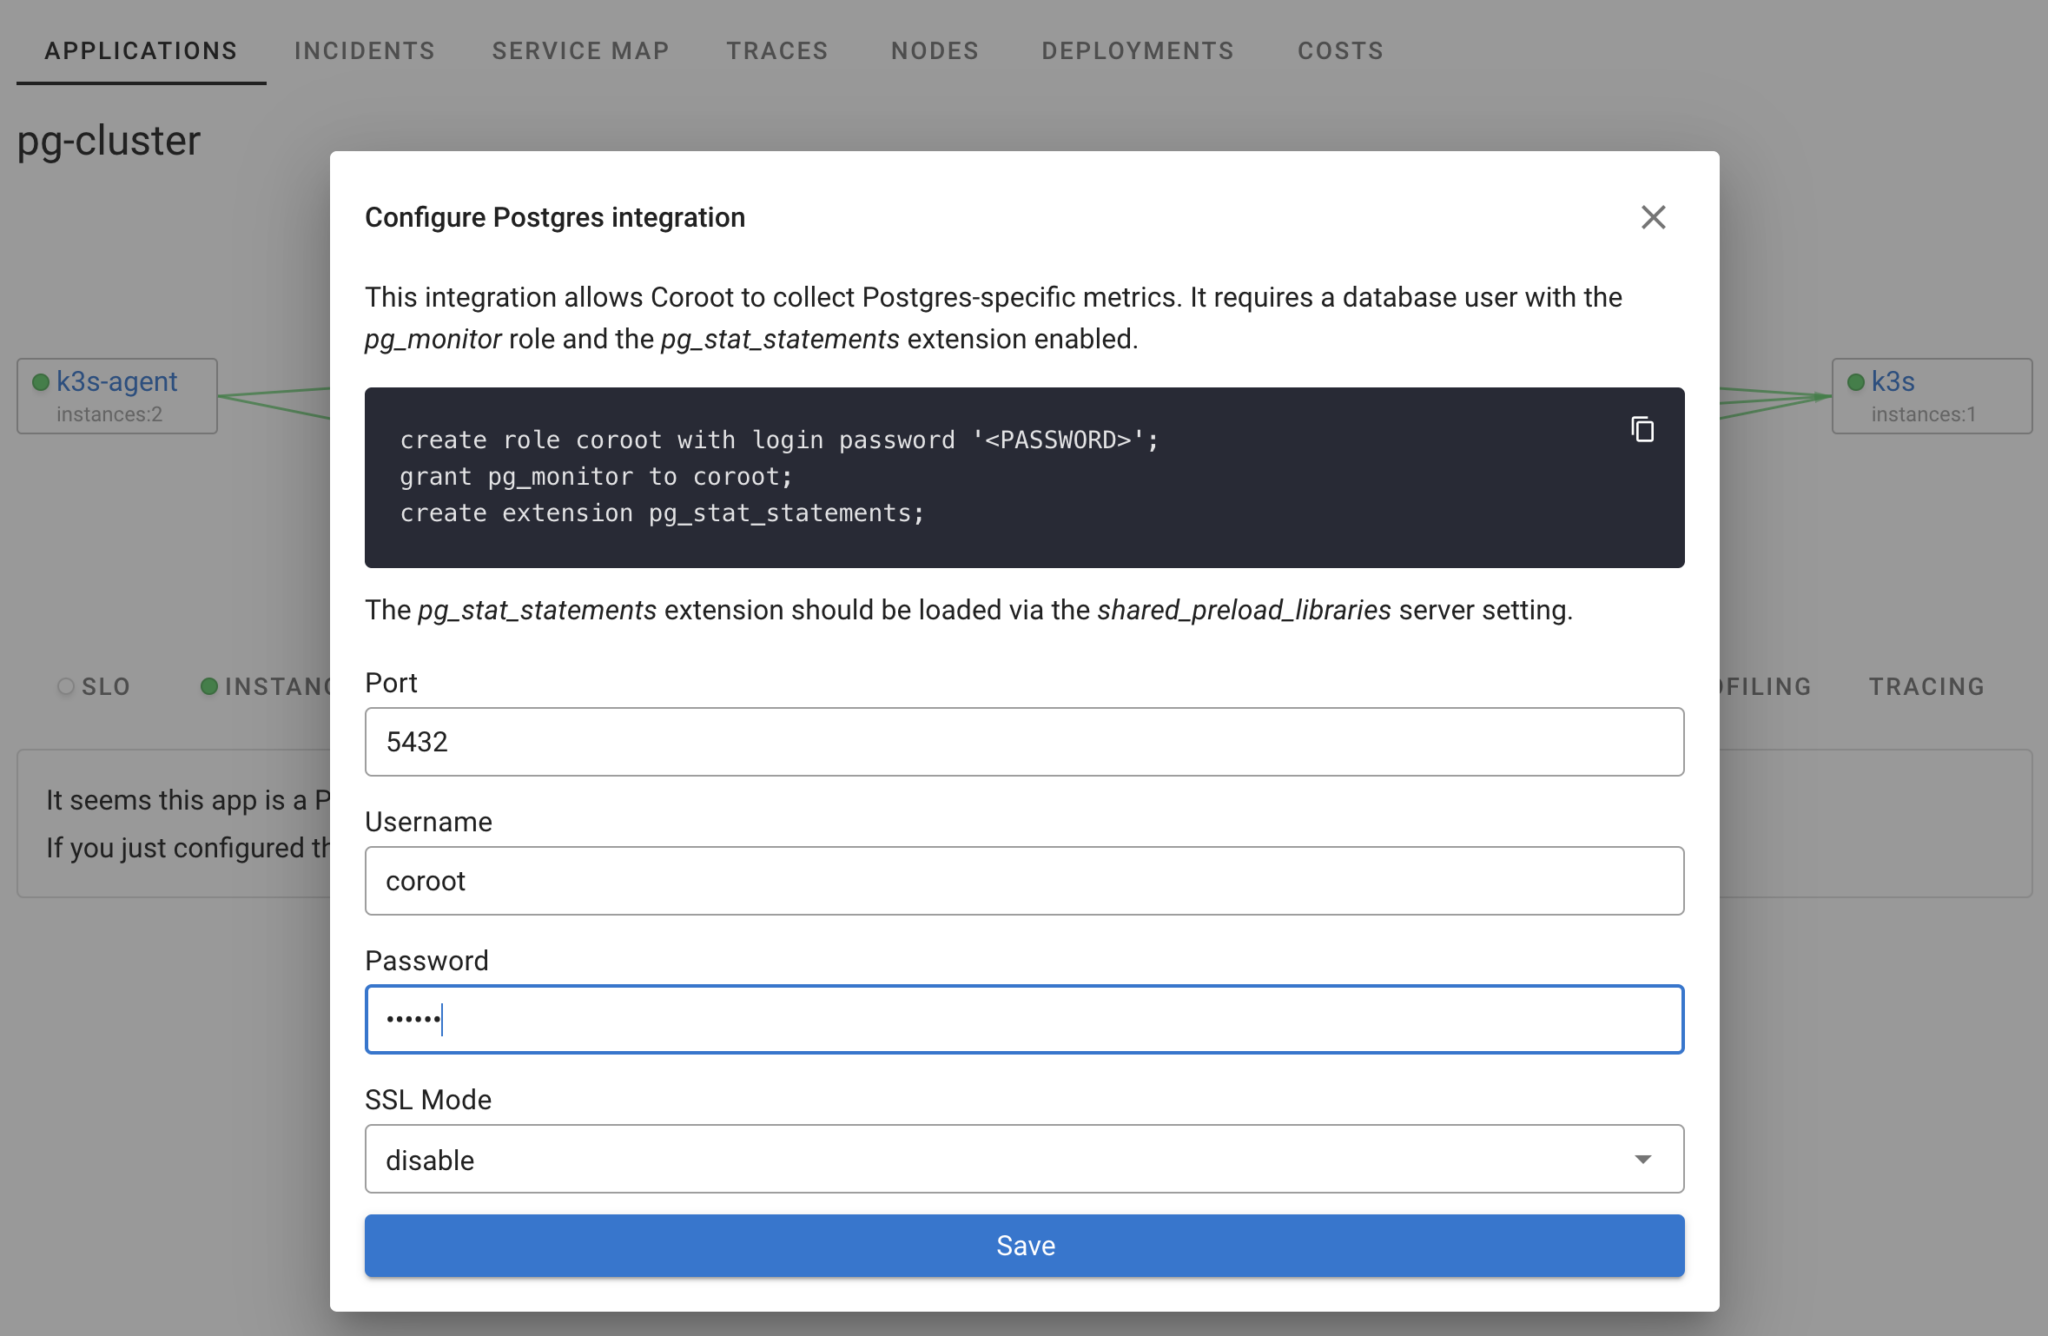
To configure this integration, simply use the credentials of the database role already created for Coroot. Click on “Postgres” in the Coroot UI and then on the “Configure” button.
Next, provide the credentials configured for Coroot in the cluster specification. Coroot’s cluster-agent will then collect Postgres metrics from each instance in the cluster. The pg_stat_statements extension, which we enabled during cluster creation, is already set up, so no manual steps are required. Since Coroot understands the dynamic nature of Kubernetes applications, it will automatically instrument all instances, even as you add more replicas.
That’s it! Within a minute, our Postgres cluster is fully monitored by Coroot. And this goes beyond just having some Postgres metrics in Prometheus. We now have it all: metrics, logs, traces, profiles, dashboards, and predefined inspections that automatically highlight any performance issues or database unavailability.
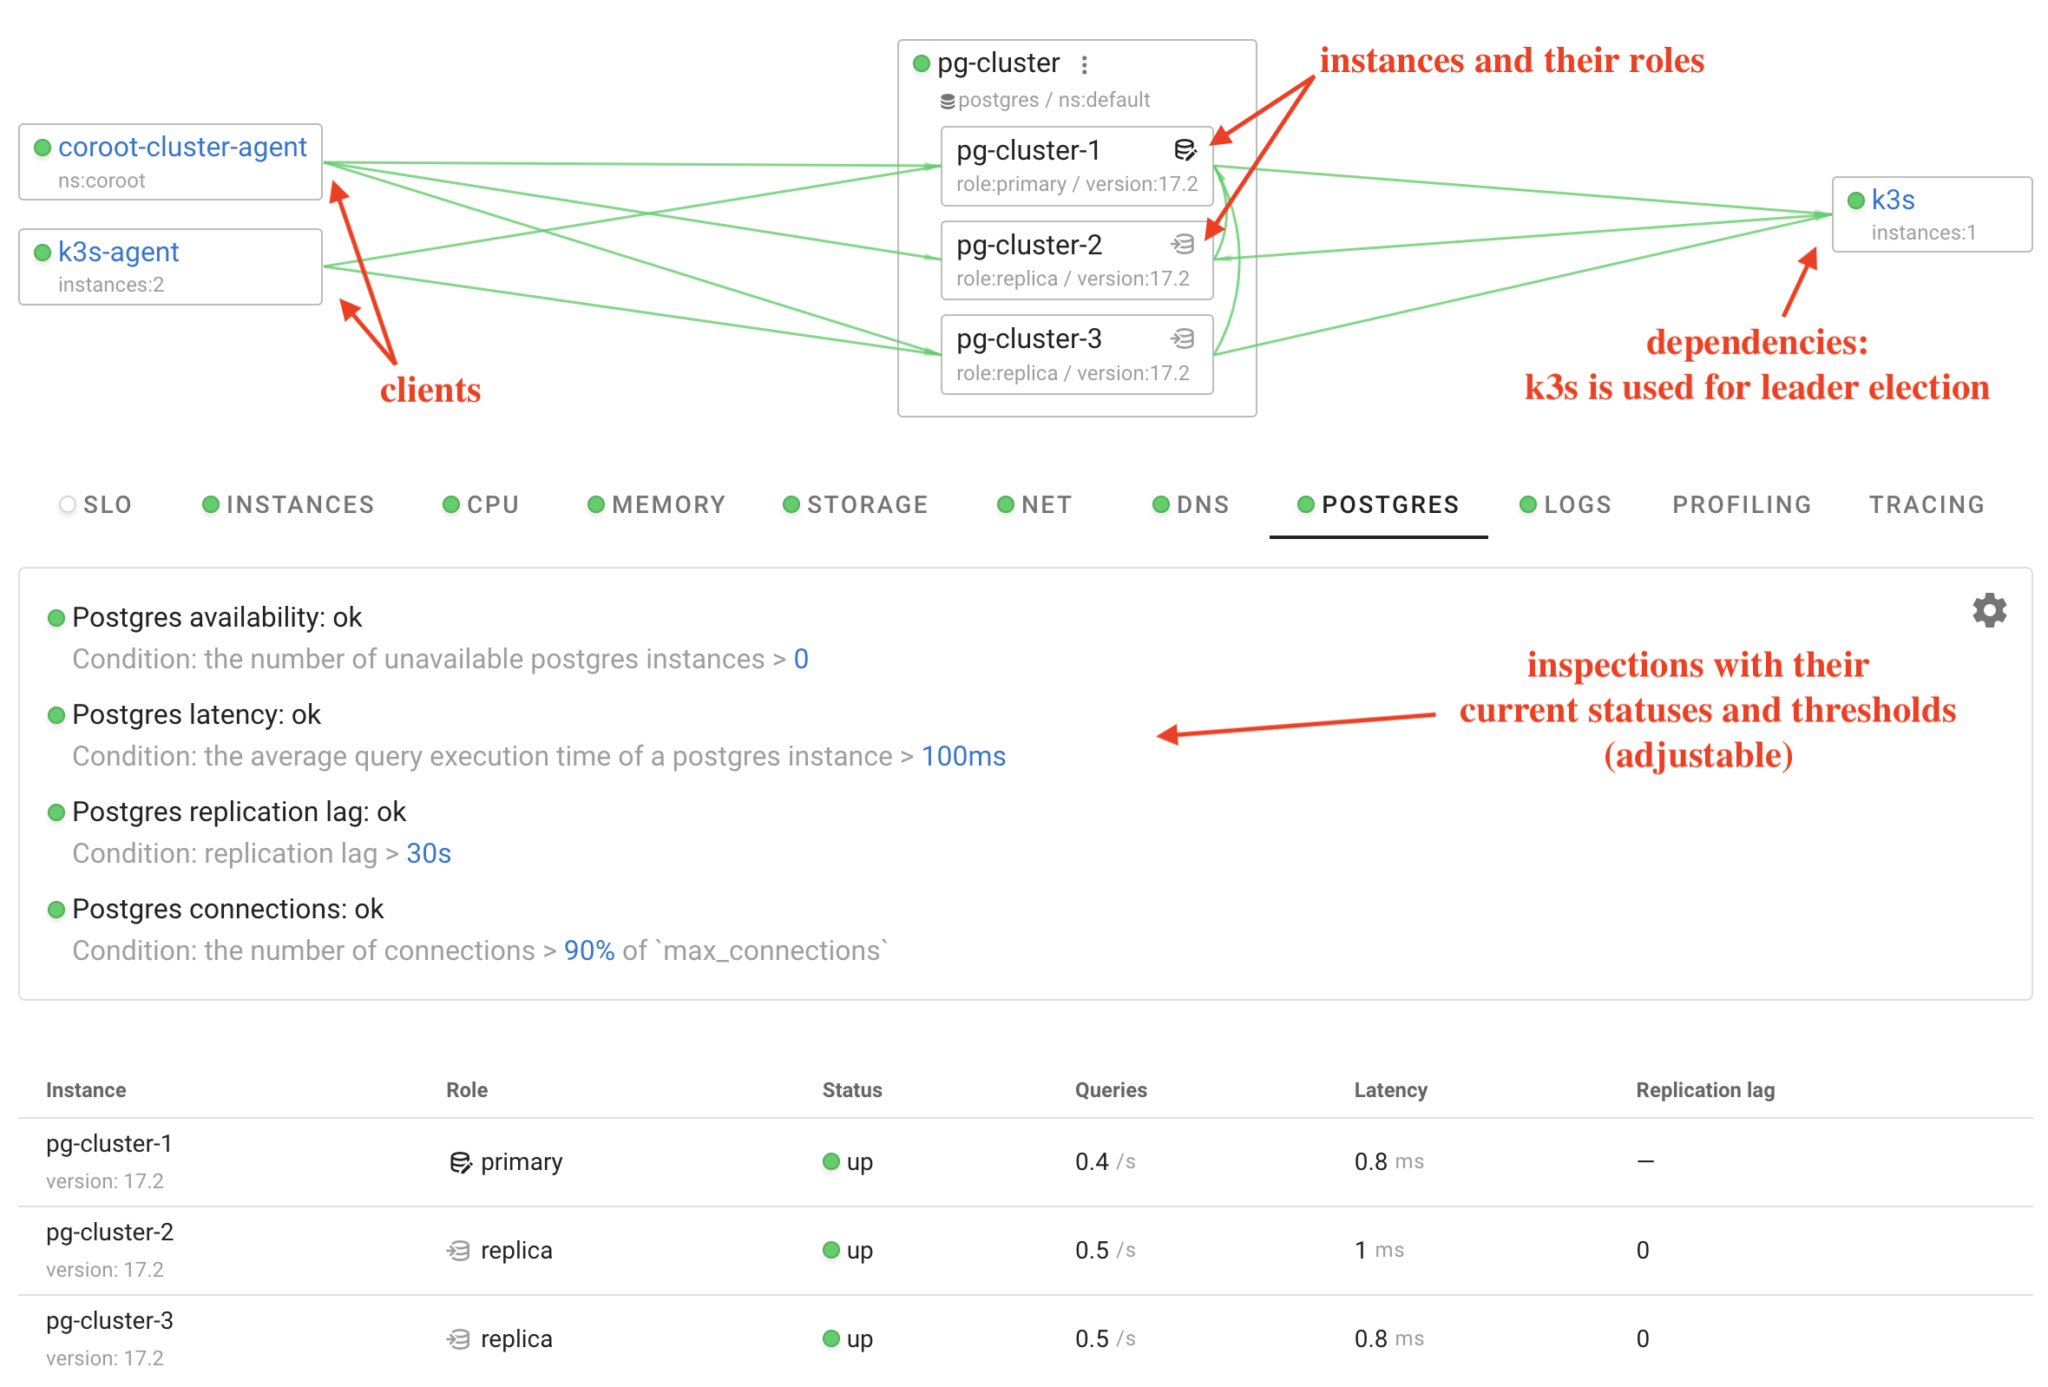
This is great, but it feels a bit dull without any load or issues. Let’s add an application that interacts with this database.
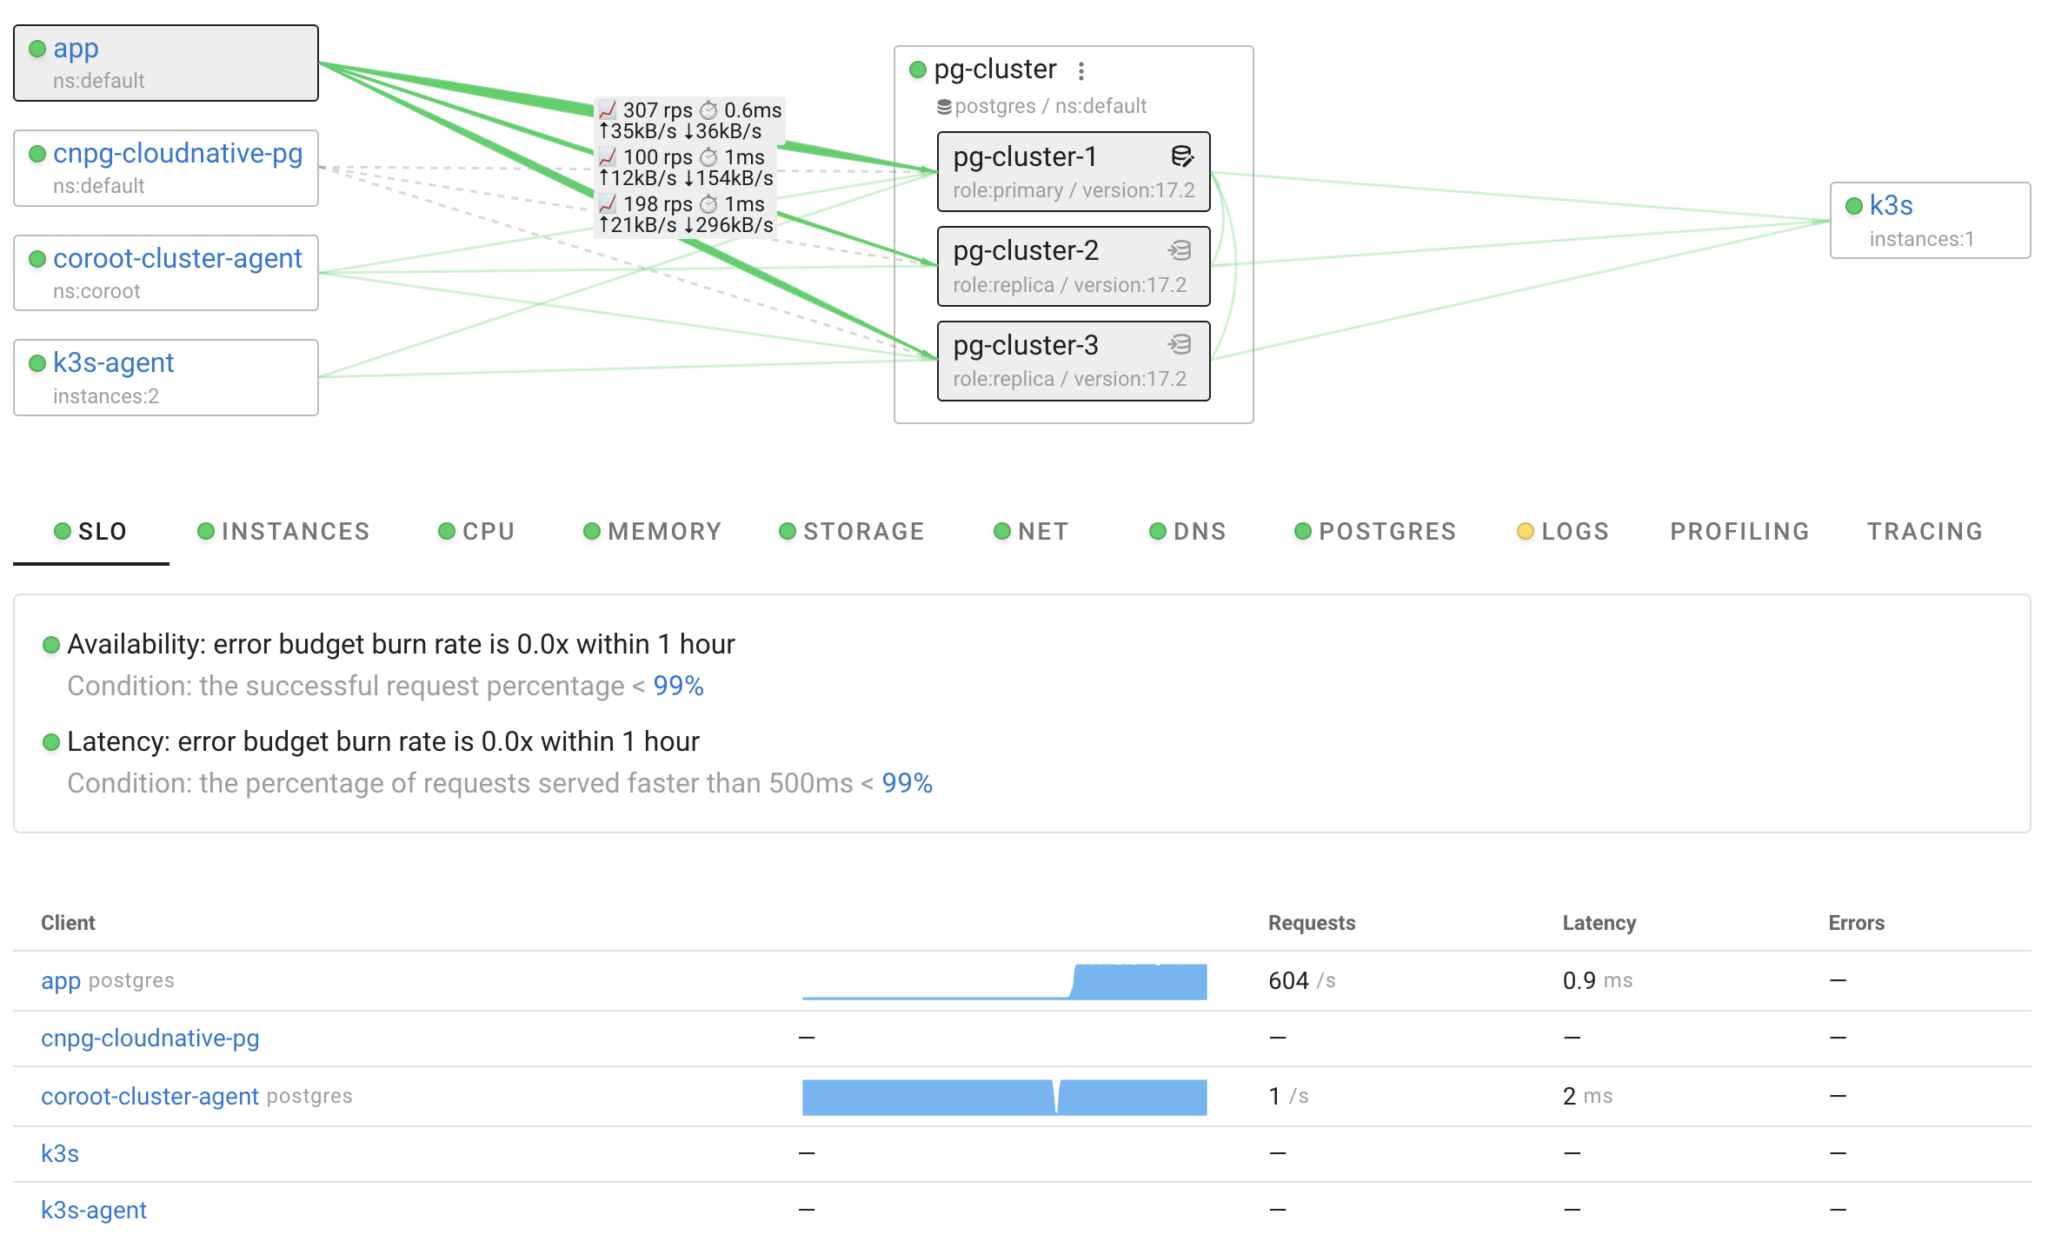
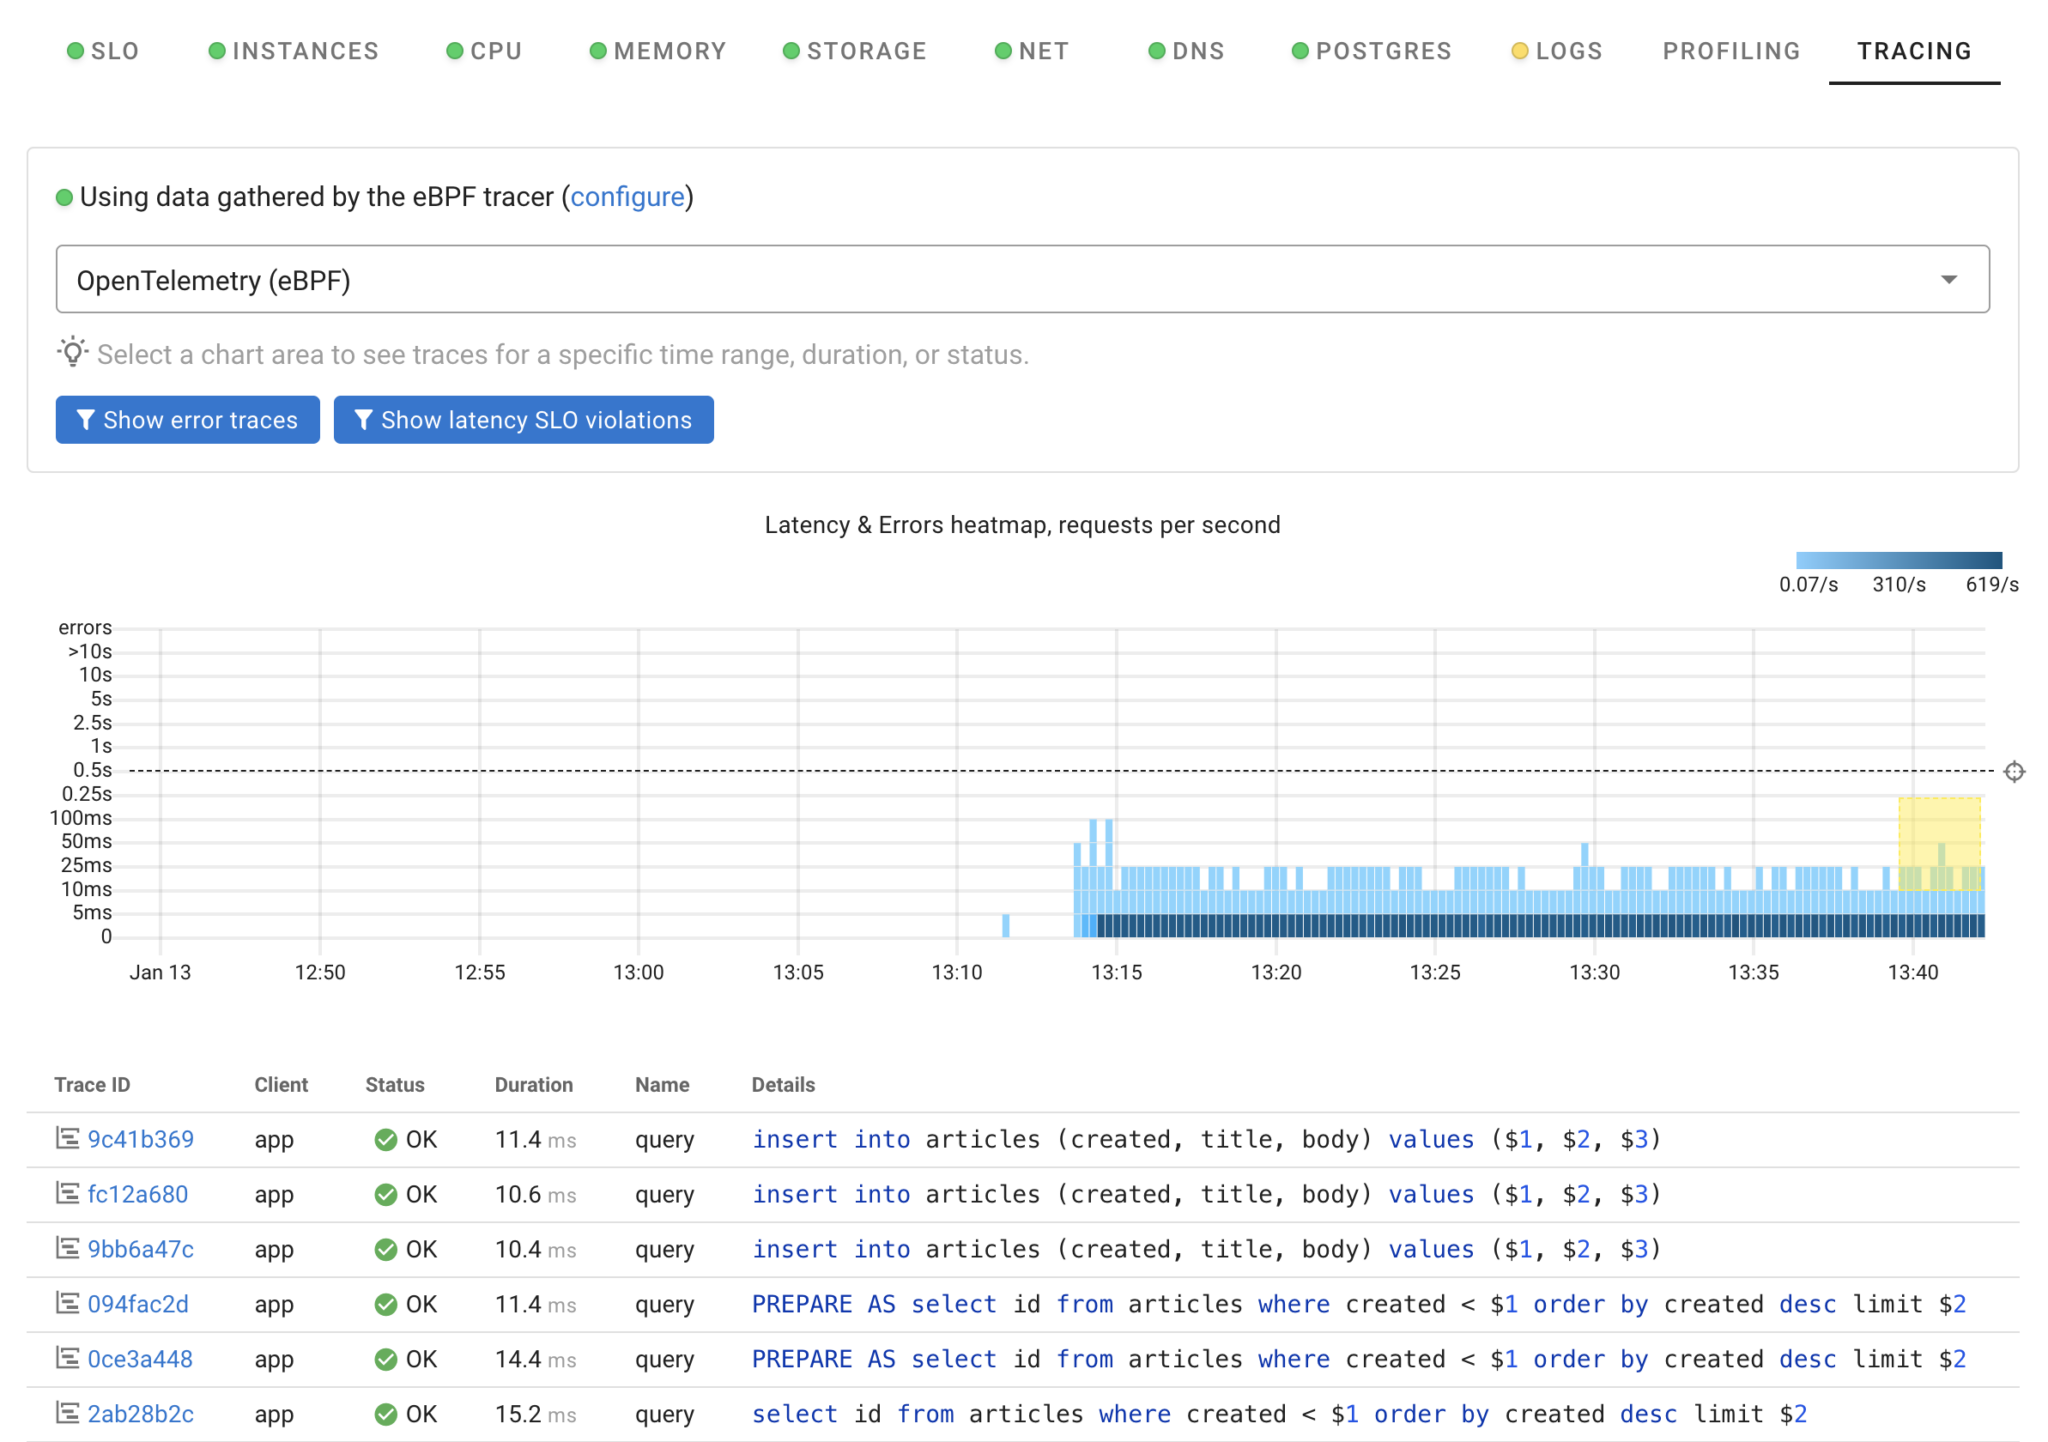
I deployed a simple application called “app” that executes approximately 600 queries per second: 300 on the primary and 300 across both replicas. Coroot gathers statistics for these queries using eBPF, requiring no code changes. As a result, we can track the number of requests and their latency. Moreover, with eBPF-based tracing, we can identify specific queries, which is particularly useful for analyzing latency anomalies. Simply select an area on the heatmap to pinpoint which queries were slow.
I believe that any observability solution must be tested on failures to ensure that if some problem occurs, we will be able to quickly identify the root case. So, let’s introduce some failures 🔥🔥🔥.
Failure #1: CPU noisy neighbor
In shared infrastructures like Kubernetes clusters, applications often compete for resources. Let’s simulate a scenario with a noisy neighbor, where a CPU-intensive application runs on the same node as our database instance. The following Job will create a Pod with stress-ng on node100:
apiVersion: batch/v1
kind: Job
metadata:
  name: cpu-stress
spec:
  template:
    metadata:
      labels:
        app: cpu-stress
    spec:
      nodeSelector:
        kubernetes.io/hostname: node100
      containers:
        - name: stress-ng
          image: debian:bullseye-slim
          command:
            - "/bin/sh"
            - "-c"
            - |
              apt-get update &&
              apt-get install -y stress-ng &&
              stress-ng --cpu 0 --timeout 300s
      restartPolicy: Never
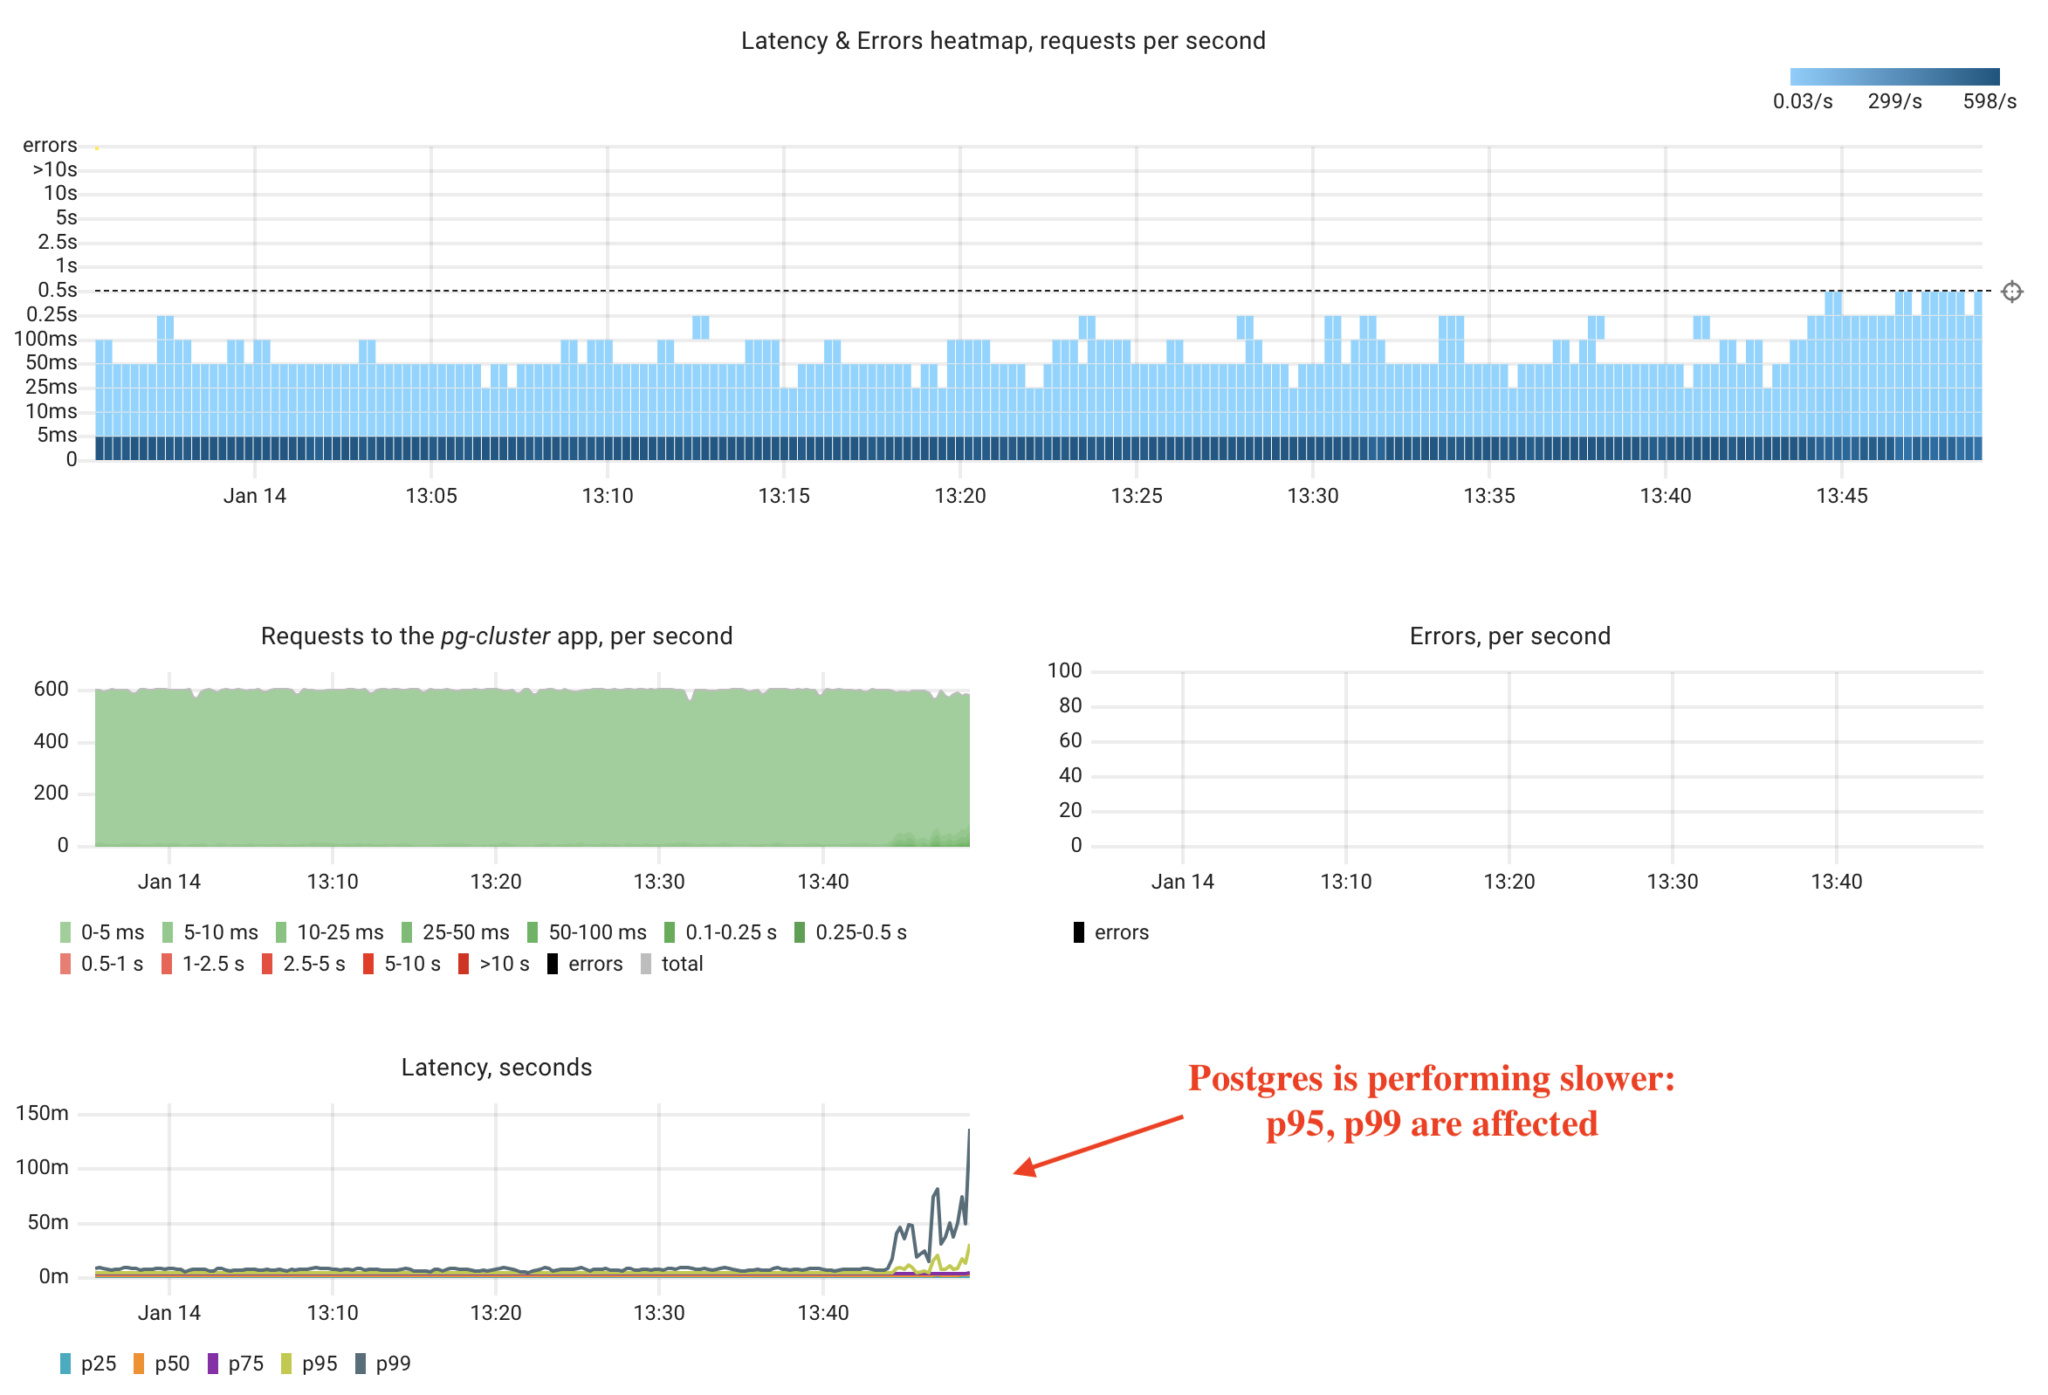
As we can see, our “noisy neighbor” has affected Postgres performance. Now, let’s assume we don’t know the root cause and use Coroot to identify the issue.
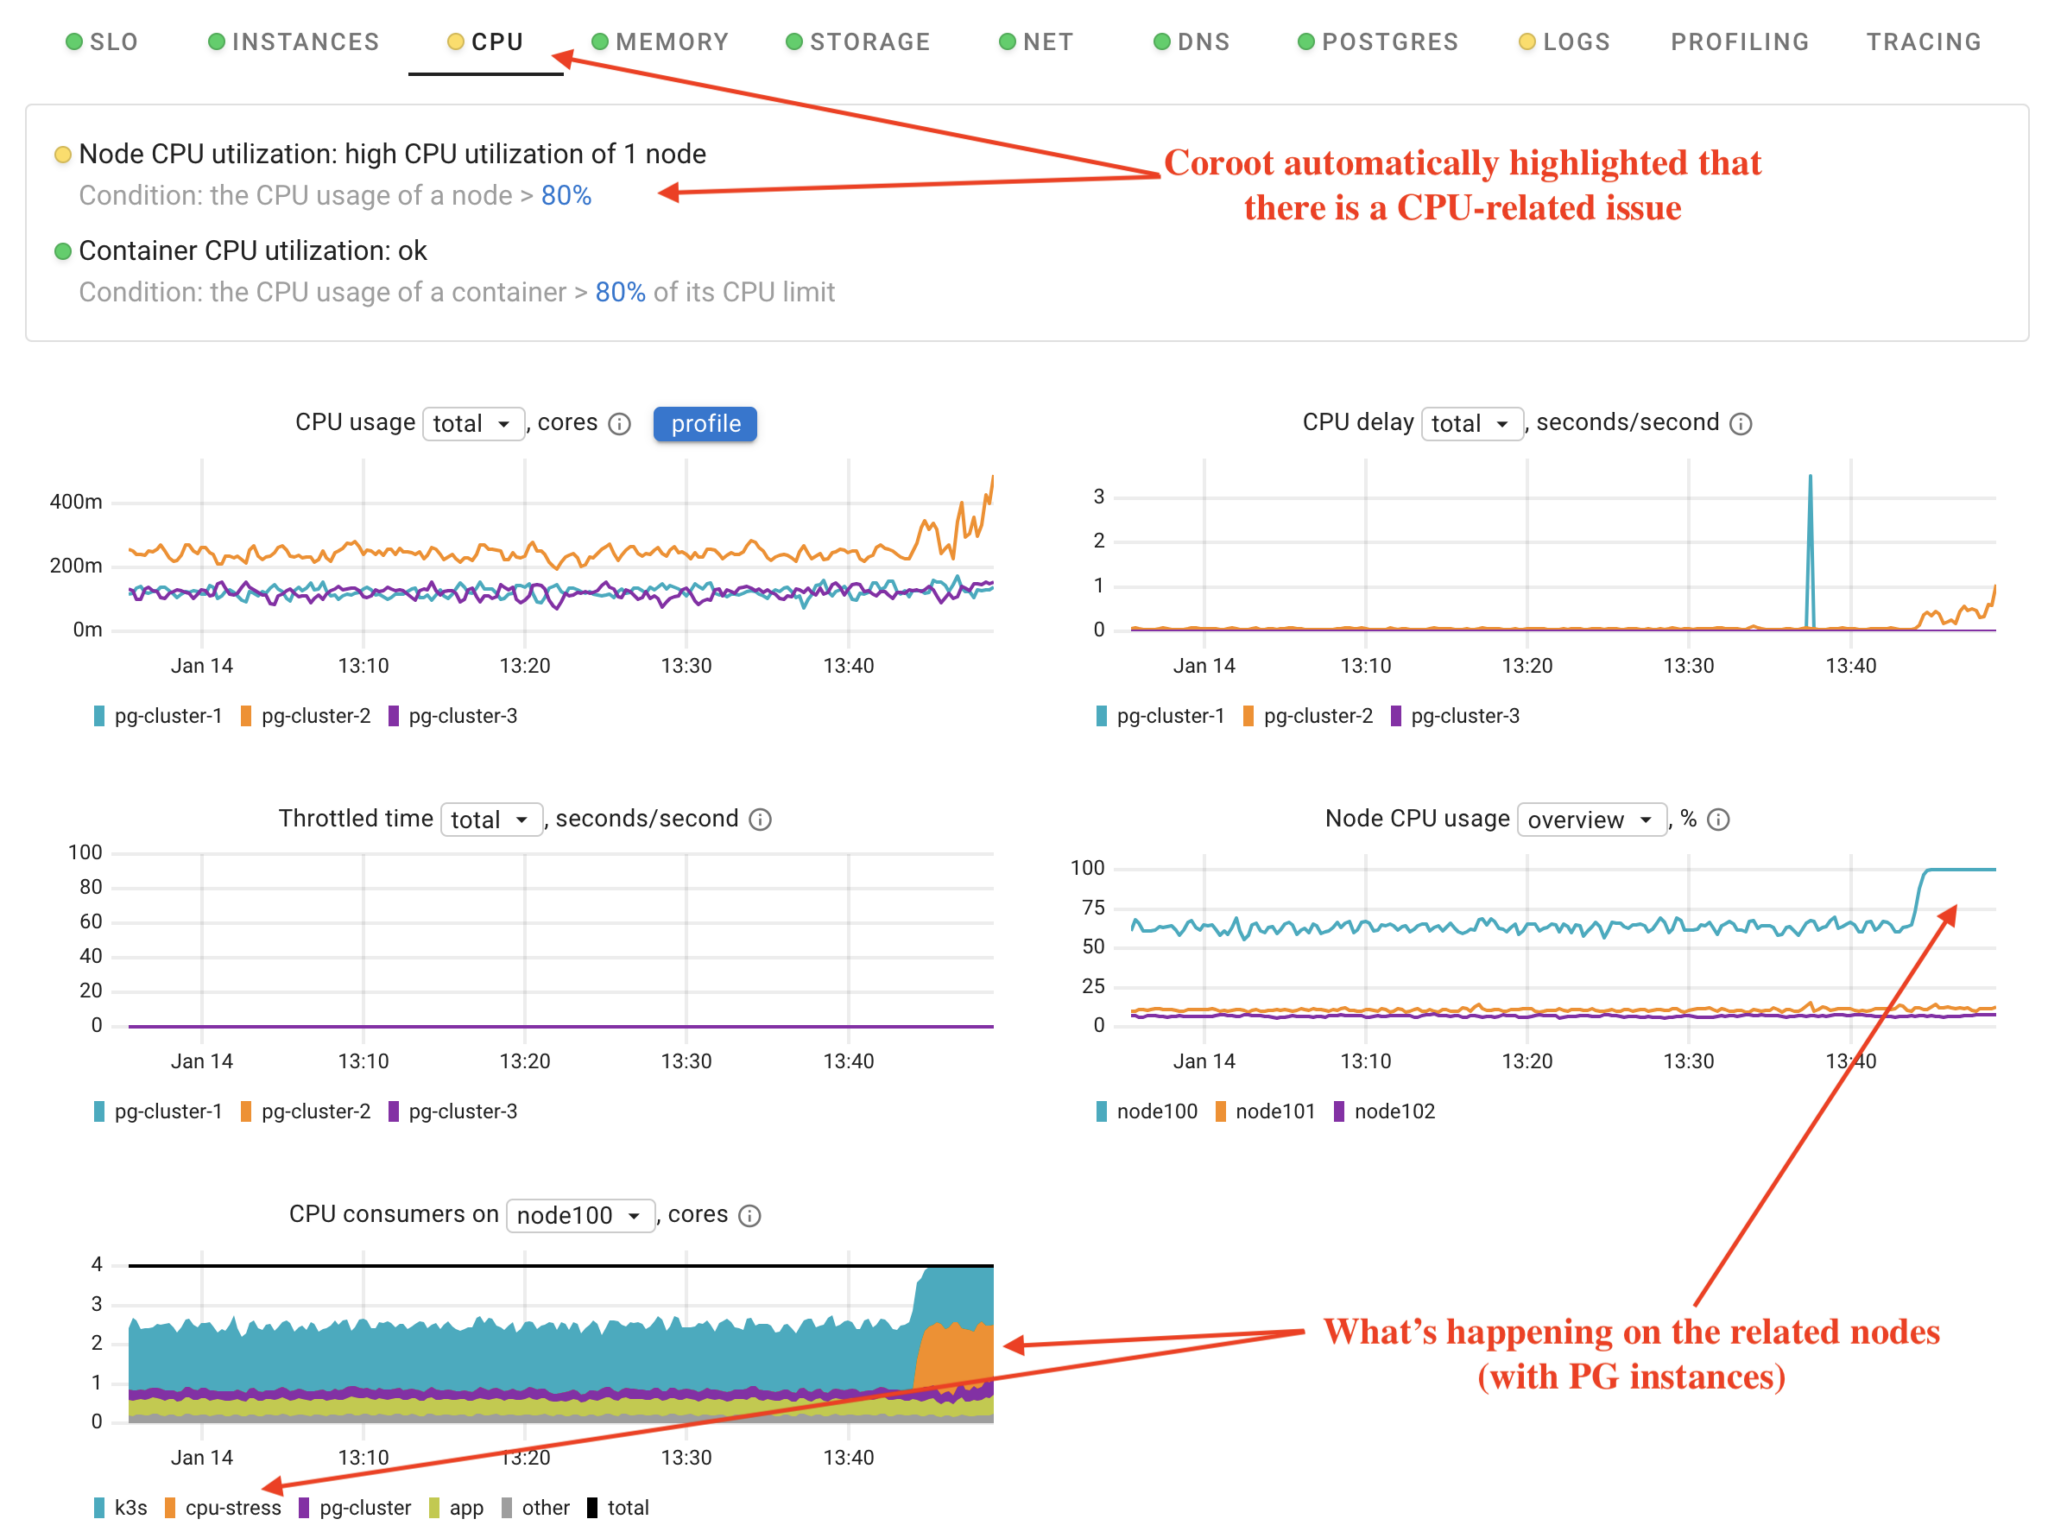
First, Coroot flagged an issue with the CPU. By understanding the system’s model, Coroot focuses only on nodes related to the specific application, in this case, Postgres. Our database instances run on three nodes: node100, node101, and node102. This means that even in a cluster with many nodes, Coroot only highlights the relevant ones.
Using the CPU Delay chart, we can observe that pg-cluster-2 is experiencing a CPU time shortage. Why? Because node100 is overloaded. And why is that? The cpu-stress application has consumed all available CPU time.
Pretty straightforward, right?
Failure #2: Postgres Locks
Now, let’s explore a Postgres-specific failure scenario. We’ll run a suboptimal schema migration on our articles table, which contains 10 million rows:
ALTER TABLE articles ALTER COLUMN body SET NOT NULL;
For those who aren’t deeply familiar with databases, this migration will lock the entire table to verify that all rows are not NULL. Since the table is relatively large, the migration can take some time to complete. During this period, queries from our app will be forced to wait until the lock is released.
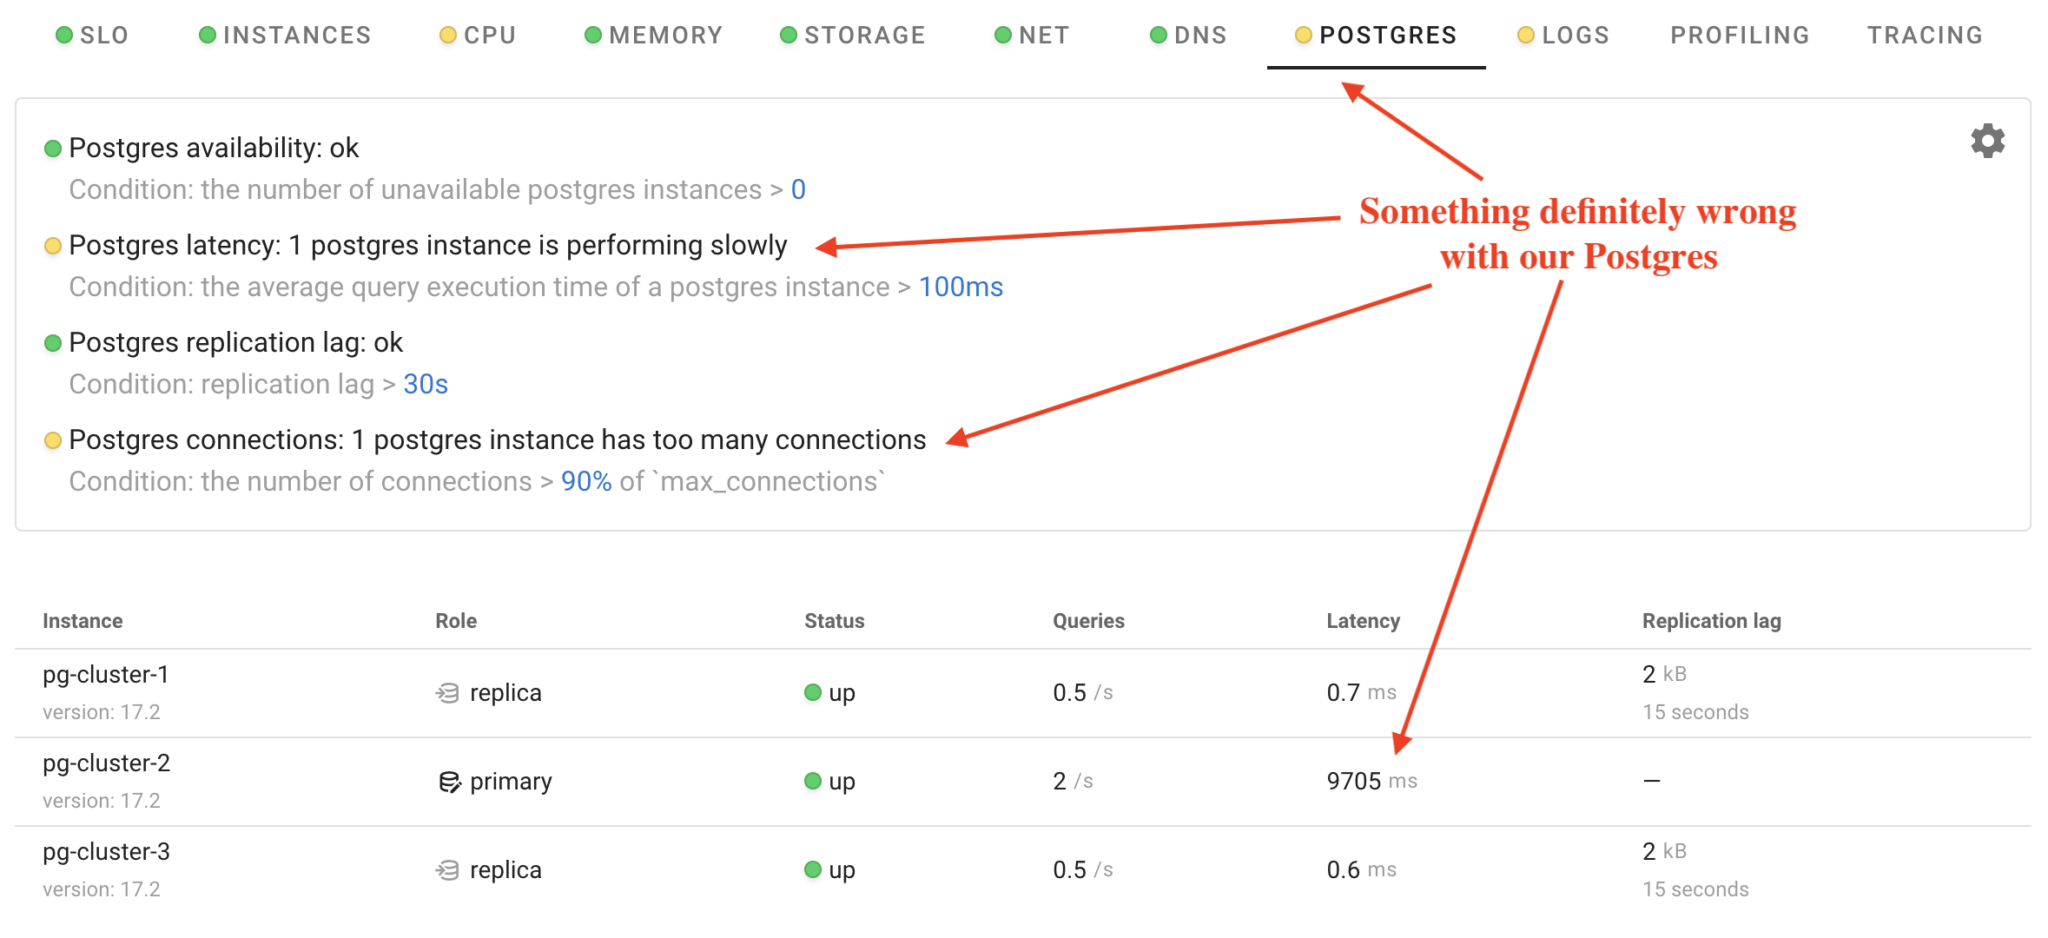
Coroot has detected issues with one of the Postgres instances. Let’s once again assume we don’t know the root cause and use Coroot to identify it.
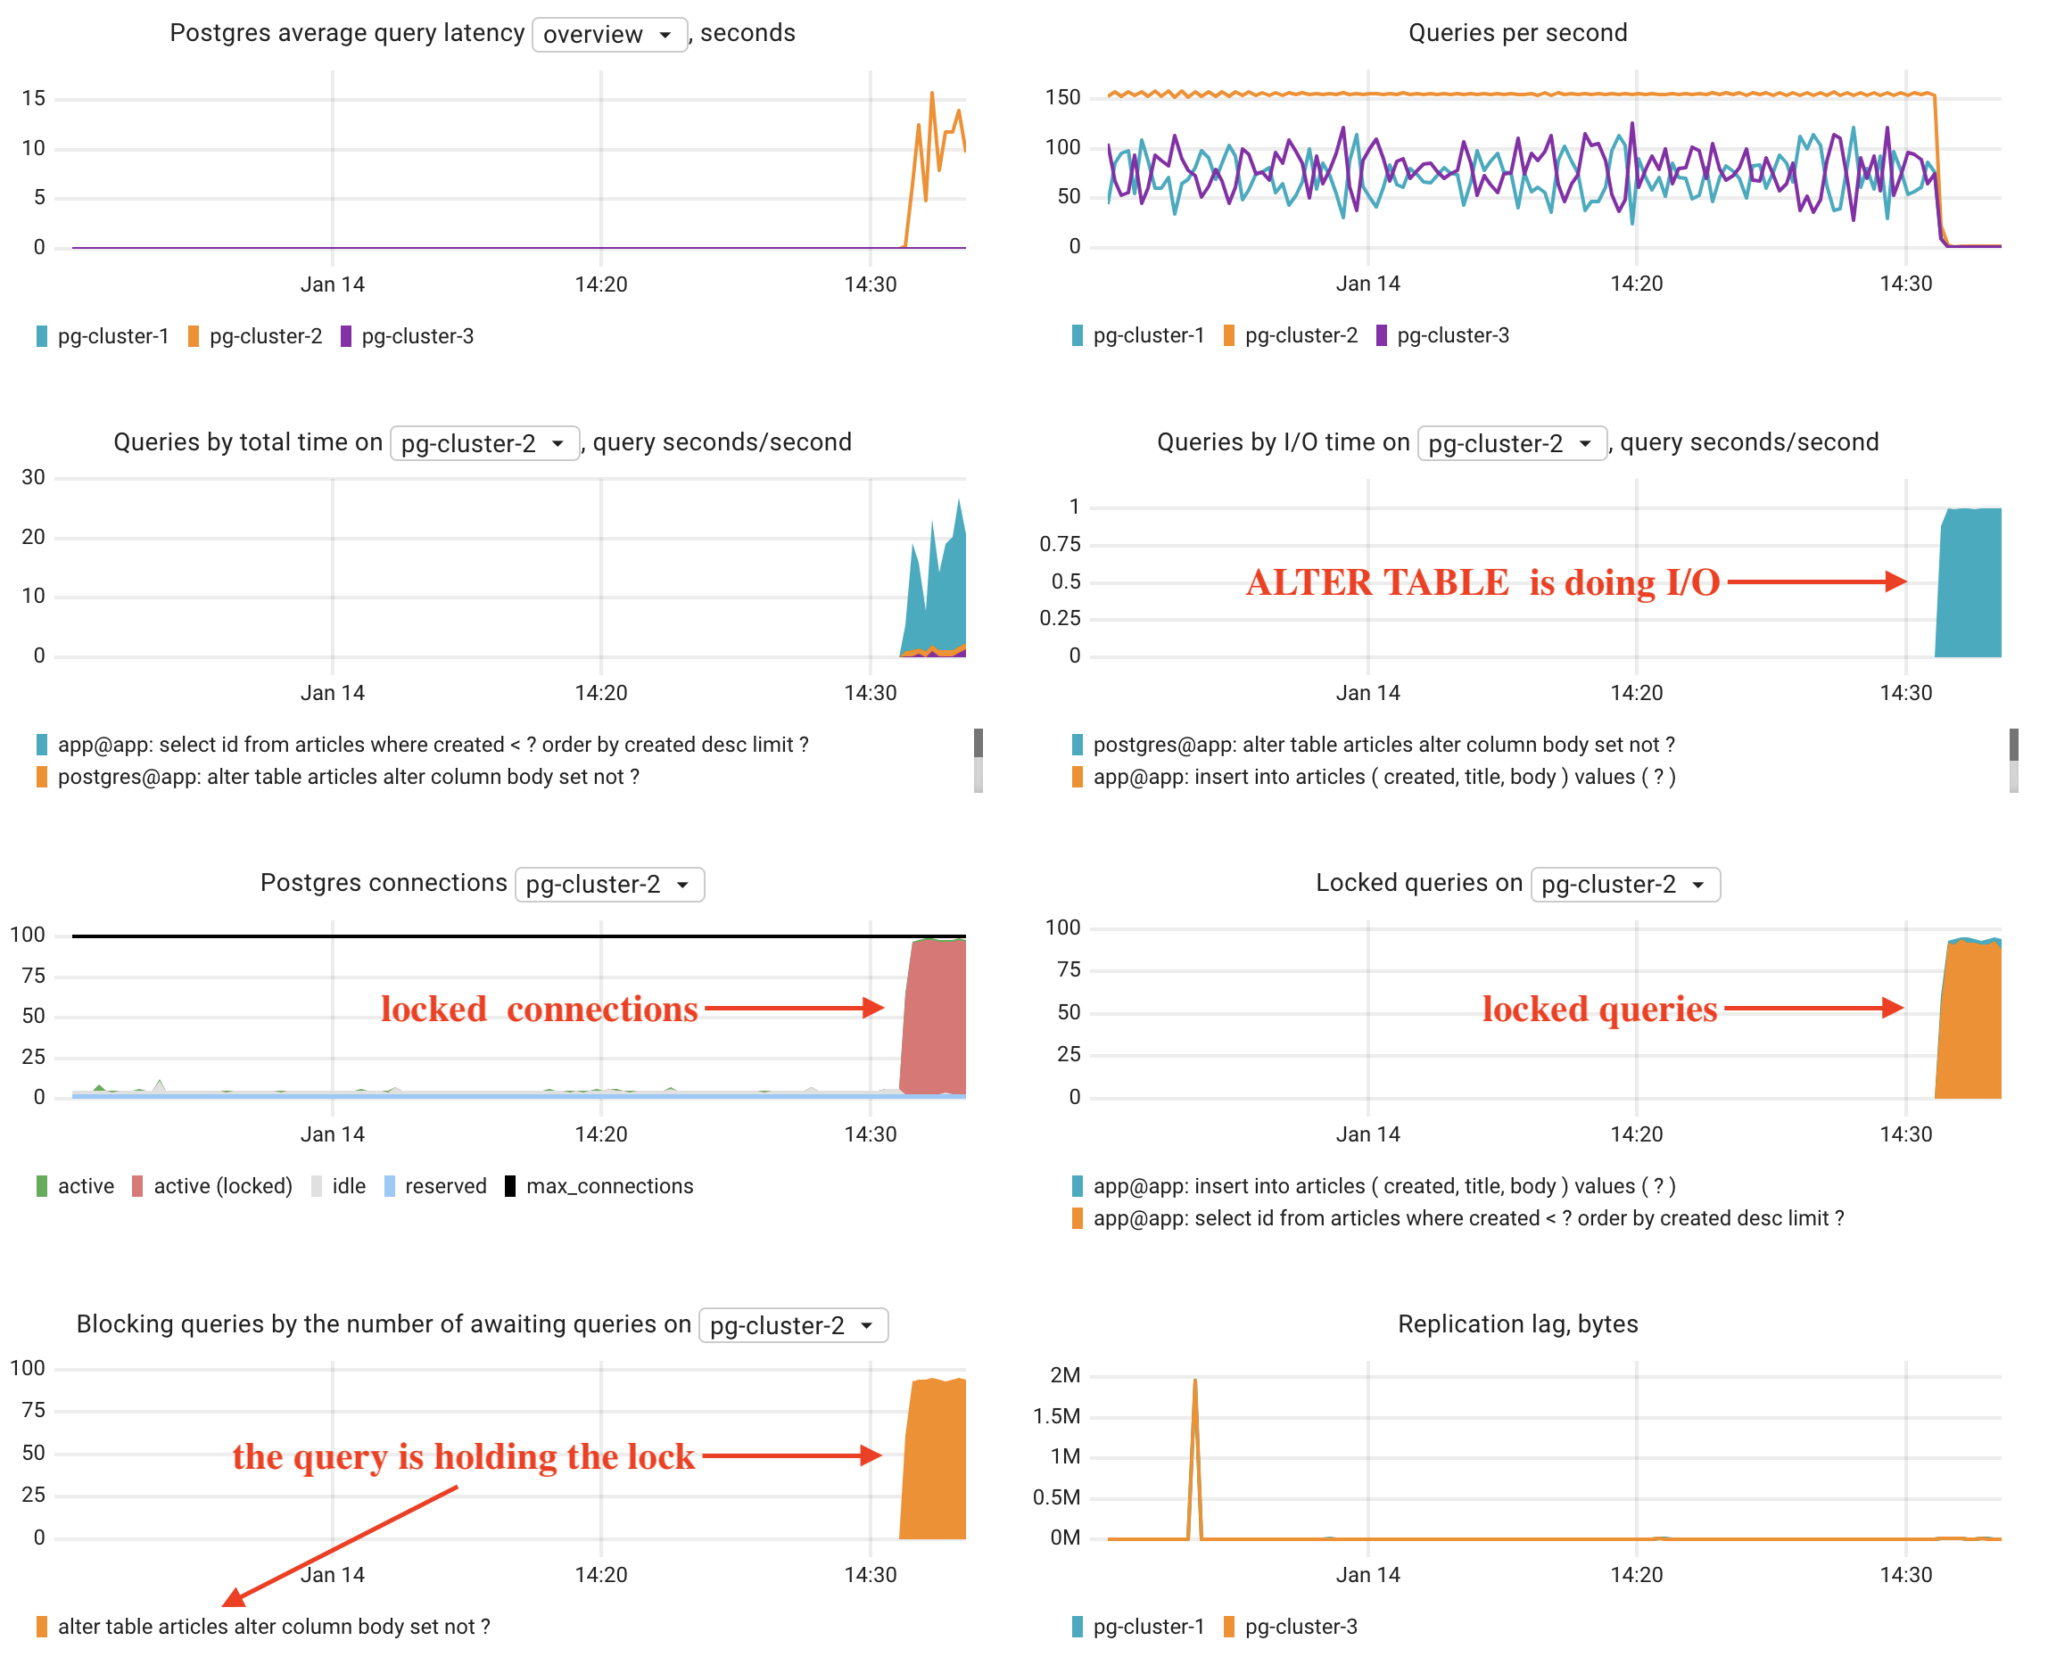
Let’s interpret these charts together: The Postgres latency of pg-cluster-2 has significantly increased. Many SELECT and INSERT queries are locked by another query. Which one? The ALTER TABLE query. Why is this query taking so long to execute? Because it is performing I/O operations to verify that the body column in each row is not NULL.
As you can see, having the right metrics was crucial in this scenario. For instance, simply knowing the number of Postgres locks wouldn’t help us identify the specific query holding the lock. That’s why at Coroot, we love conducting experiments like this, to ensure our product can quickly and accurately pinpoint the root cause.
Failure #3: primary Postgres instance failure
Now, let’s see how CloudNativePG handles a primary instance failure. To simulate this failure, I’ll simply delete the Pod of the primary Postgres instance.
kubectl delete pod pg-cluster-2
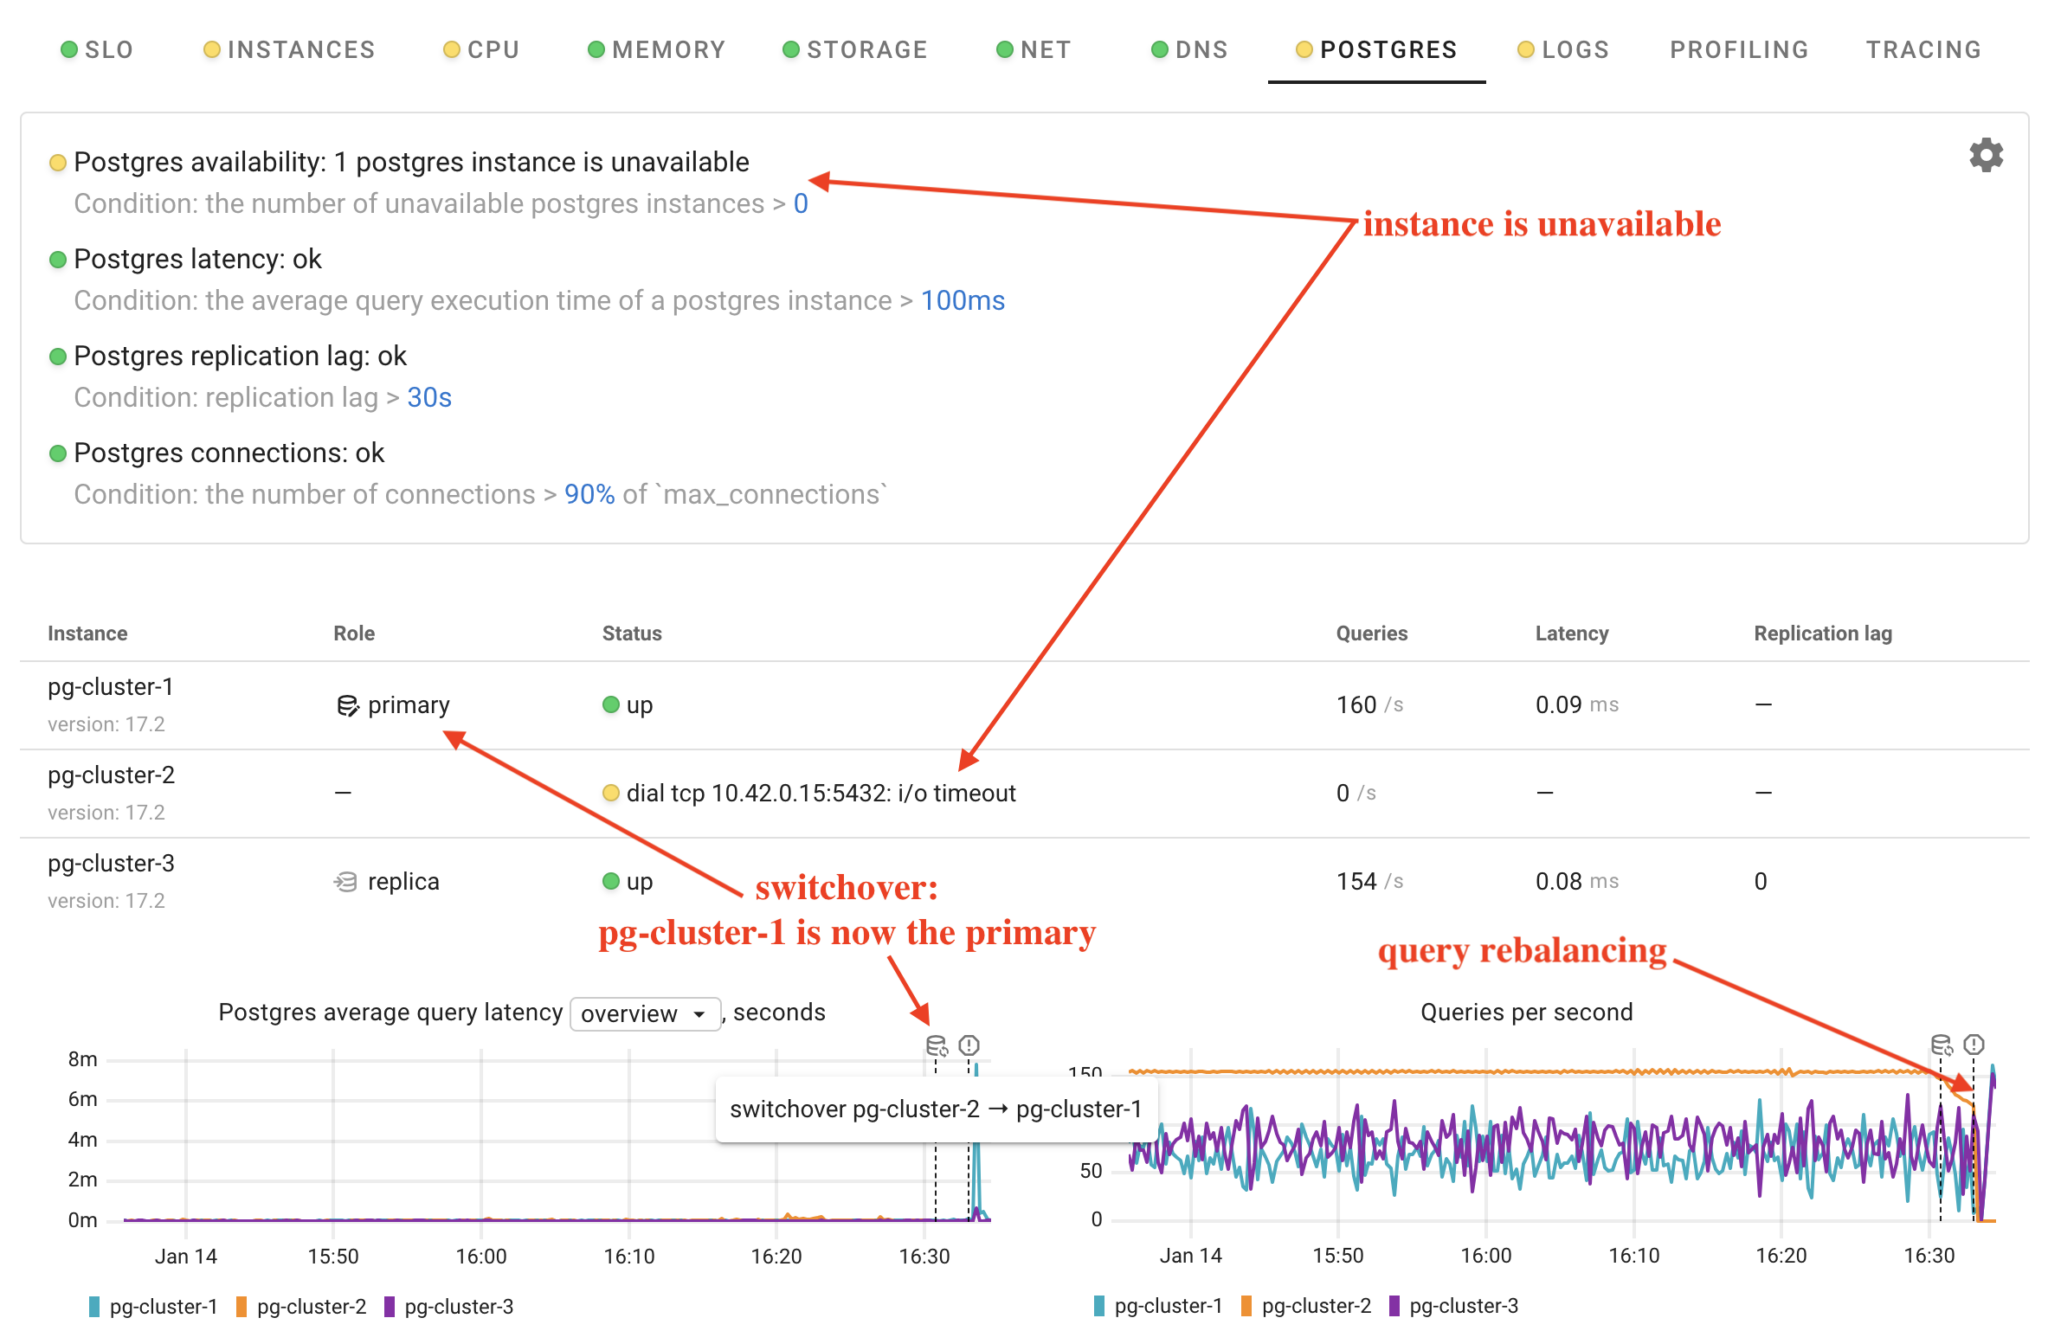
The operator detected the failure and initiated a switchover, promoting pg-cluster-1 as the new primary. In Coroot, we can clearly observe what happened to our cluster and see that it took approximately 3 minutes to restore query processing.
Conclusion
CloudNativePG and Coroot make a great team for running and monitoring PostgreSQL on Kubernetes. CloudNativePG handles the heavy lifting for database management, like backups and failovers, while Coroot keeps everything visible and easy to troubleshoot. Together, they make it simple to tackle real-world issues and keep your databases running smoothly in the cloud-native world.
Ready to dive into full-featured observability with advanced Postgres monitoring? Try Coroot Community Edition for free, or start a free trial of Coroot Enterprise Edition for advanced capabilities.
If you like Coroot, give us a ⭐ on GitHub️.
Any questions or feedback? Reach out to us on Slack.


