eBPF is a powerful technology used by many observability solutions, including Coroot. While web-based observability tools like Coroot are invaluable, there’s a specific class of eBPF tools that often go overlooked (besides Brendan Gregg of course): eBPF Linux Command Line Tools. These tools are essential for diving deep into complex performance issues.
The Power of eBPF: Beyond Web Applications
But first – why would you need those at all if you have convenient observability focused web applications ? The reason is simple – even deeper depth. Even though eBPF is very efficient, you can’t instrument absolutely everything all the time, and so if you need to really go deep to resolve some complicated problem eBPF Linux Command Line Tools are essential.
The 80/20 Rule
We can roughly apply the 80%-20% rule here – Web solutions, like Coroot, are helpful to resolve 80% of the problems. Out of the remaining 20%, 80% can be solved with help of eBPF Linux Command Line Tools, and for the rest you might need to implement custom eBPF programs, potentially with help of tools like BPFtrace.
BCC vs. bpftrace
When it comes to command line tools for eBPF, also could be referred as “frontends” many of them are in turn based on either BCC (older) technology or on bpftrace with some of the tools existing in two implementations, sometimes with slightly different feature set. BCC eBPF performance tools collection still has more command line available, but bpftrace collection is also growing quickly
Both collections are very safe to use, due to the foundational aspect of eBPF – safety. Because an eBPF coder runs in the virtual machine, and is checked to ensure limited complexity, even accidentally (or intentionally) “bad” eBPF program will not crash or “hang” your kernel. See more details here
Essential Command Line Tools
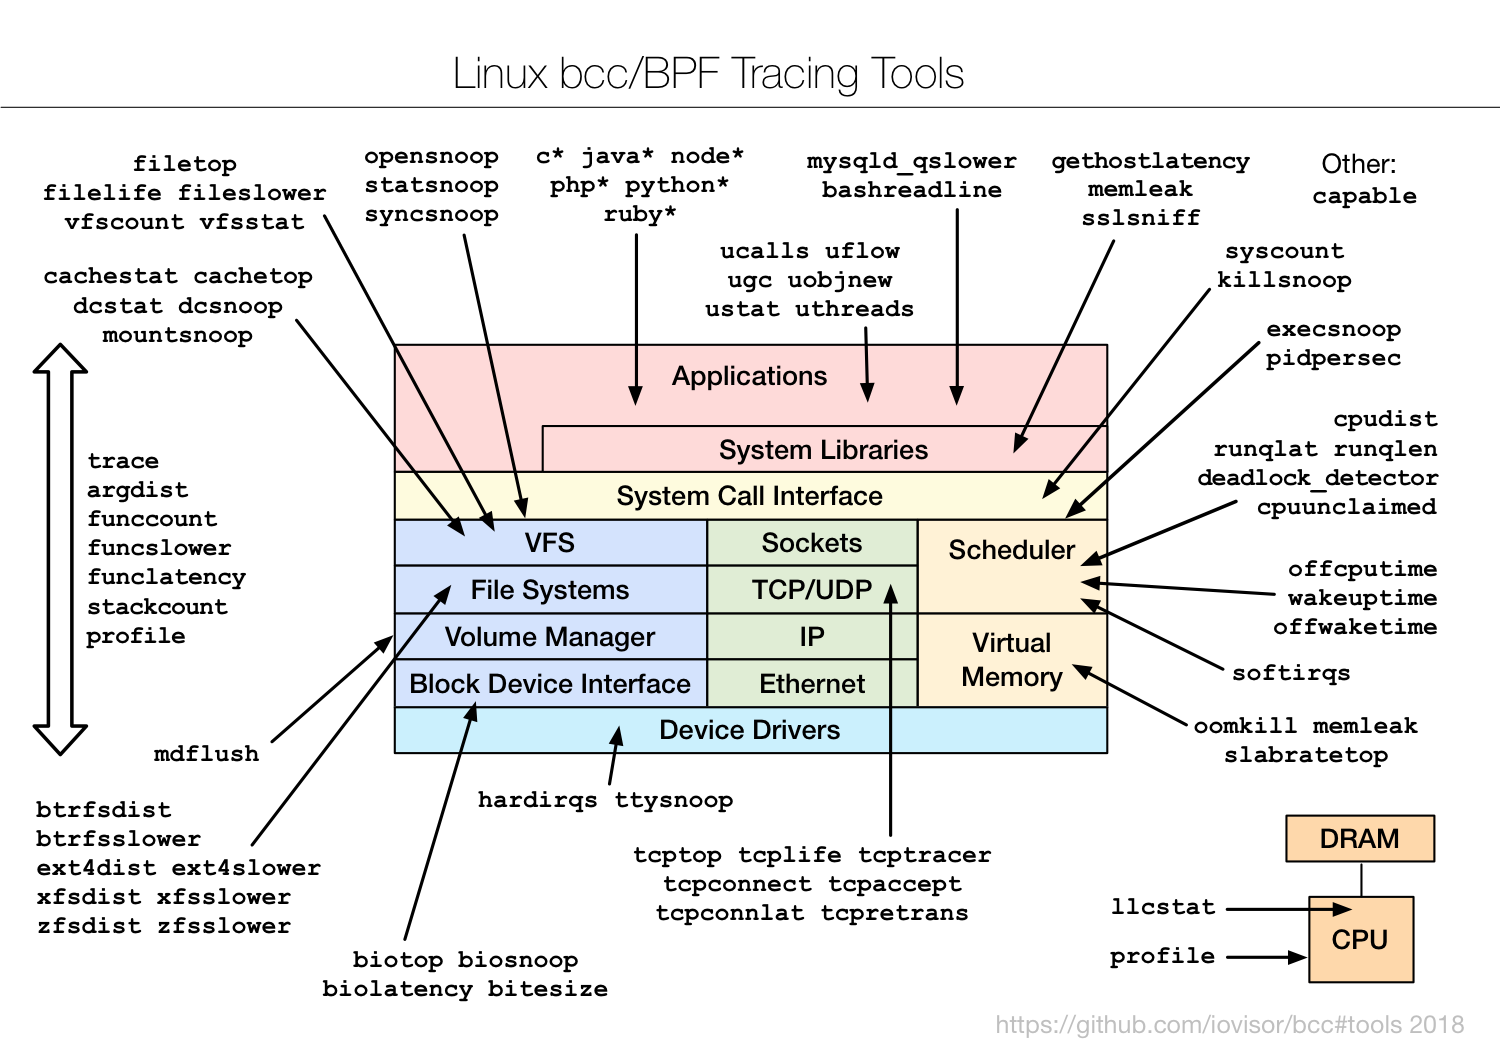
Let’s explore some of the most useful eBPF command line tools from the BCC collection:
- filetop: Similar to the top command, but focuses on file-based activity.
- gethostlatency: Discovers DNS requests made by your applications and their latency.
- runqlat and runqslower: Check if CPU scheduling latency is impacting your service performance.
Conclusion
While web-based observability solutions like Coroot are invaluable, combining them with knowledge of eBPF Linux Command Line Tools can help support insight into system performance.