Every Python developer has heard about the GIL (Global Interpreter Lock) This lock simplifies memory management and ensures thread safety, but it also limits the performance of multi-threaded, CPU-bound programs because threads can’t run Python code in parallel. Here is a great explanation of why Python requires the GIL by Python’s creator, Guido van Rossum: Guido van Rossum: Will Python ever remove the GIL? | Lex Fridman Podcast Clips.
In most cases, web applications are not CPU-bound because they spend most of their time waiting for data from databases or other services. However, we cannot be certain whether the GIL affects the performance of a Python application without measuring its impact.
What would be an ideal metric to measure the impact of the GIL? I like to think of any lock as added latency. In other words, if a thread spent 100ms waiting for the GIL while processing a user request, it means the request took 100ms longer to complete compared to a no-GIL situation. Therefore, we need to measure the total time the thread spent acquiring the GIL, i.e., the time between when it requested the lock and when it acquired it.
Let’s dive into CPython’s code to find where the GIL is acquired. Ah, here’s the take_gil function. This looks like exactly what we need.
At Coroot, we use eBPF to gather telemetry data. eBPF provides uprobes and uretprobes, which let us attach an eBPF program to a userspace function call. Here’s how can use them:
- When take_gil is called, our uprobe records the start time in an eBPF map using the PID and ThreadID.
- Once take_gil completes, our uretprobe retrieves the start time from the eBPF map and calculates the lock acquisition time.
It sounds straightforward, but the devil is in the details. To attach uprobes, we need to know the function offset in the binary of our app. In this case, the binary is the Python interpreter or the dynamically loaded libraries it uses.
Let’s find the take_gil symbol in real Python apps. I have a testing Kubernetes cluster with several Python apps running on it. Here’s how we see them from the node:
$ ps aux|grep python
root     3813790  0.7  0.6 436328 52820 ?        Ssl  11:37   0:01 /usr/local/bin/python /usr/local/bin/waitress-serve --port=80 app:app
systemd+ 2188081  0.0  0.3 845980 29988 ?        Sl    2023 284:58 /usr/bin/python3 /usr/local/bin/patroni /home/postgres/postgres.yml
Since all these processes are running in containers, or in low-level terms, in dedicated mount and network namespaces, I will use some /proc magic to access binaries and libraries. First, let’s start with the app with PID 3813790 and check if it uses a statically linked Python or the dynamically linked libpython:
$ cat /proc/3813790/maps |grep libpython
7fe5753ec000-7fe57544d000 r--p 00000000 00:148 600968                    /usr/local/lib/libpython3.9.so.1.0
7fe57544d000-7fe5755e5000 r-xp 00061000 00:148 600968                    /usr/local/lib/libpython3.9.so.1.0
7fe5755e5000-7fe5756d4000 r--p 001f9000 00:148 600968                    /usr/local/lib/libpython3.9.so.1.0
7fe5756d4000-7fe5756da000 r--p 002e8000 00:148 600968                    /usr/local/lib/libpython3.9.so.1.0
7fe5756da000-7fe575714000 rw-p 002ee000 00:148 600968                    /usr/local/lib/libpython3.9.so.1.0
As we can see it uses libpython3.9.so.1.0, so we need to find take_gil there:
$ readelf -s --wide /proc/3813790/root/usr/local/lib/libpython3.9.so.1.0|grep take_gil
  4379: 0000000000194d00   562 FUNC    LOCAL  DEFAULT   12 take_gil
  4382: 00000000000f2ebf   345 FUNC    LOCAL  DEFAULT   12 take_gil.cold
Awesome, we’ve found it. Now, let’s check another app to ensure that it is always there and examine the Patroni app with PID 3813790:
$ grep libpython /proc/2188081/maps
$
There is no libpython linked, so in this case, we should look for the take_gil symbol in the interpreter binary:
$ readelf -s --wide  /proc/2188081/exe |grep take_gil
$
Nothing:(
In this case, the Python interpreter might have been compiled with optimization flags that inline certain functions, or its binary has been stripped. Therefore, we can’t rely on instrumenting take_gil directly. Let’s delve deeper to understand the underlying mechanisms CPython uses to implement the GIL. Here is the main code of the take_gil function:
int drop_requested = 0;
while (_Py_atomic_load_relaxed(&gil->locked)) {
    unsigned long saved_switchnum = gil->switch_number;
    unsigned long interval = (gil->interval >= 1 ? gil->interval : 1);
    int timed_out = 0;
    COND_TIMED_WAIT(gil->cond, gil->mutex, interval, timed_out);
    if (timed_out &&
        _Py_atomic_load_relaxed(&gil->locked) &&
        gil->switch_number == saved_switchnum)
    {
        if (tstate_must_exit(tstate)) {
            MUTEX_UNLOCK(gil->mutex);
            if (drop_requested) {
                RESET_GIL_DROP_REQUEST(interp);
            }
            PyThread_exit_thread();
        }
        assert(is_tstate_valid(tstate));
        SET_GIL_DROP_REQUEST(interp);
        drop_requested = 1;
    }
}
This code uses the COND_TIMED_WAIT macro to acquire the GIL with a timeout, allowing the thread to be blocked for only a short time. That’s why this macro is called in a loop. On Linux, Python relies on POSIX threads, so COND_TIMED_WAIT uses pthread_cond_timedwait provided by C standard library to implement the GIL.
Now, let’s try to find pthread_cond_timedwait in the symbol table. The specific library can vary depending on the system:
- libc.so: the standard C library
- libpthread.so: in some cases, POSIX thread-related functions are stored in a dedicated library
- musl.so: Alpine Linux-based container images use the alternative implementation of the C standard library
Now, let’s check our apps. Patroni:
$ grep -E "(libc.|pthread|musl)" /proc/2188081/maps
7ff1c862f000-7ff1c8657000 r--p 00000000 00:c9 401437                     /usr/lib/x86_64-linux-gnu/libc.so.6
7ff1c8657000-7ff1c87ec000 r-xp 00028000 00:c9 401437                     /usr/lib/x86_64-linux-gnu/libc.so.6
7ff1c87ec000-7ff1c8844000 r--p 001bd000 00:c9 401437                     /usr/lib/x86_64-linux-gnu/libc.so.6
7ff1c8844000-7ff1c8848000 r--p 00214000 00:c9 401437                     /usr/lib/x86_64-linux-gnu/libc.so.6
7ff1c8848000-7ff1c884a000 rw-p 00218000 00:c9 401437                     /usr/lib/x86_64-linux-gnu/libc.so.6
$ readelf -s --wide /proc/2188081/root/usr/lib/x86_64-linux-gnu/libc.so.6 |grep pthread_cond_wait
  2709: 00000000000938b0  1066 FUNC    GLOBAL DEFAULT   15 pthread_cond_wait@@GLIBC_2.3.2
  2710: 0000000000092000   111 FUNC    GLOBAL DEFAULT   15 pthread_cond_wait@GLIBC_2.2.5
Another app:
$ grep -E "(libc.|pthread|musl)" /proc/3784739/maps
7f96d4657000-7f96d465d000 r--p 00000000 00:9f 2476319                    /lib/x86_64-linux-gnu/libpthread-2.31.so
7f96d465d000-7f96d466d000 r-xp 00006000 00:9f 2476319                    /lib/x86_64-linux-gnu/libpthread-2.31.so
7f96d466d000-7f96d4673000 r--p 00016000 00:9f 2476319                    /lib/x86_64-linux-gnu/libpthread-2.31.so
7f96d4673000-7f96d4674000 r--p 0001b000 00:9f 2476319                    /lib/x86_64-linux-gnu/libpthread-2.31.so
7f96d4674000-7f96d4675000 rw-p 0001c000 00:9f 2476319                    /lib/x86_64-linux-gnu/libpthread-2.31.so
$ readelf -s --wide /proc/3784739/root/lib/x86_64-linux-gnu/libpthread-2.31.so |grep pthread_cond_wait
   172: 000000000000e5d0   717 FUNC    GLOBAL DEFAULT   14 pthread_cond_wait@@GLIBC_2.3.2
   173: 000000000000f650   103 FUNC    GLOBAL DEFAULT   14 pthread_cond_wait@GLIBC_2.2.5
   164: 000000000000f650   103 FUNC    LOCAL  DEFAULT   14 __pthread_cond_wait_2_0
   170: 000000000000e5d0   717 FUNC    LOCAL  DEFAULT   14 __pthread_cond_wait
   465: 000000000000e5d0   717 FUNC    GLOBAL DEFAULT   14 pthread_cond_wait@@GLIBC_2.3.2
   522: 000000000000f650   103 FUNC    GLOBAL DEFAULT   14 pthread_cond_wait@GLIBC_2.2.5
Great, we found a way to instrument the application even if it uses a stripped Python interpreter and the take_gil function is inlined for optimization purposes. Now, all we have to do is implement the eBPF programs.
struct {
__uint(type, BPF_MAP_TYPE_HASH);
__uint(key_size, sizeof(__u64));
__uint(value_size, sizeof(__u64));
__uint(max_entries, 10240);
} python_thread_locks SEC(".maps");
SEC("uprobe/pthread_cond_timedwait_enter")
int pthread_cond_timedwait_enter(struct pt_regs *ctx) {
__u64 pid_tgid = bpf_get_current_pid_tgid();
__u64 timestamp = bpf_ktime_get_ns();
bpf_map_update_elem(&python_thread_locks, &pid_tgid, ×tamp, BPF_ANY);
return 0;
}
The eBPF program above simply stores the start time of the pthread_cond_timedwait call in the map using the PID and TGID of the current thread.
struct {
    __uint(type, BPF_MAP_TYPE_PERF_EVENT_ARRAY);
    __uint(key_size, sizeof(int));
    __uint(value_size, sizeof(int));
} python_thread_events SEC(".maps");
struct python_thread_event {
    __u32 type;
    __u32 pid;
    __u64 duration;
};
SEC("uprobe/pthread_cond_timedwait_exit")
int pthread_cond_timedwait_exit(struct pt_regs *ctx) {
    __u64 pid_tgid = bpf_get_current_pid_tgid();
    __u64 *timestamp = bpf_map_lookup_elem(&python_thread_locks, &pid_tgid);
    if (!timestamp) {
        return 0;
    }
    struct python_thread_event e = {
        .type = EVENT_TYPE_PYTHON_THREAD_LOCK,
        .pid = pid_tgid >> 32,
        .duration = bpf_ktime_get_ns()-*timestamp,
    };
    bpf_perf_event_output(ctx, &python_thread_events, BPF_F_CURRENT_CPU, &e, sizeof(e));
    return 0;
}
This program handles the exit from the pthread_cond_timedwait function and reports statistics to user space for further processing. Since we want to see these statistics by container rather than by PID, the user-space code uses a PID-to-container mapping to identify the container by PID.
Now for the interesting part, let’s take a look at the resulting metrics. Coroot’s agent automatically discovers Python applications and instruments them with eBPF, so no configuration is needed.
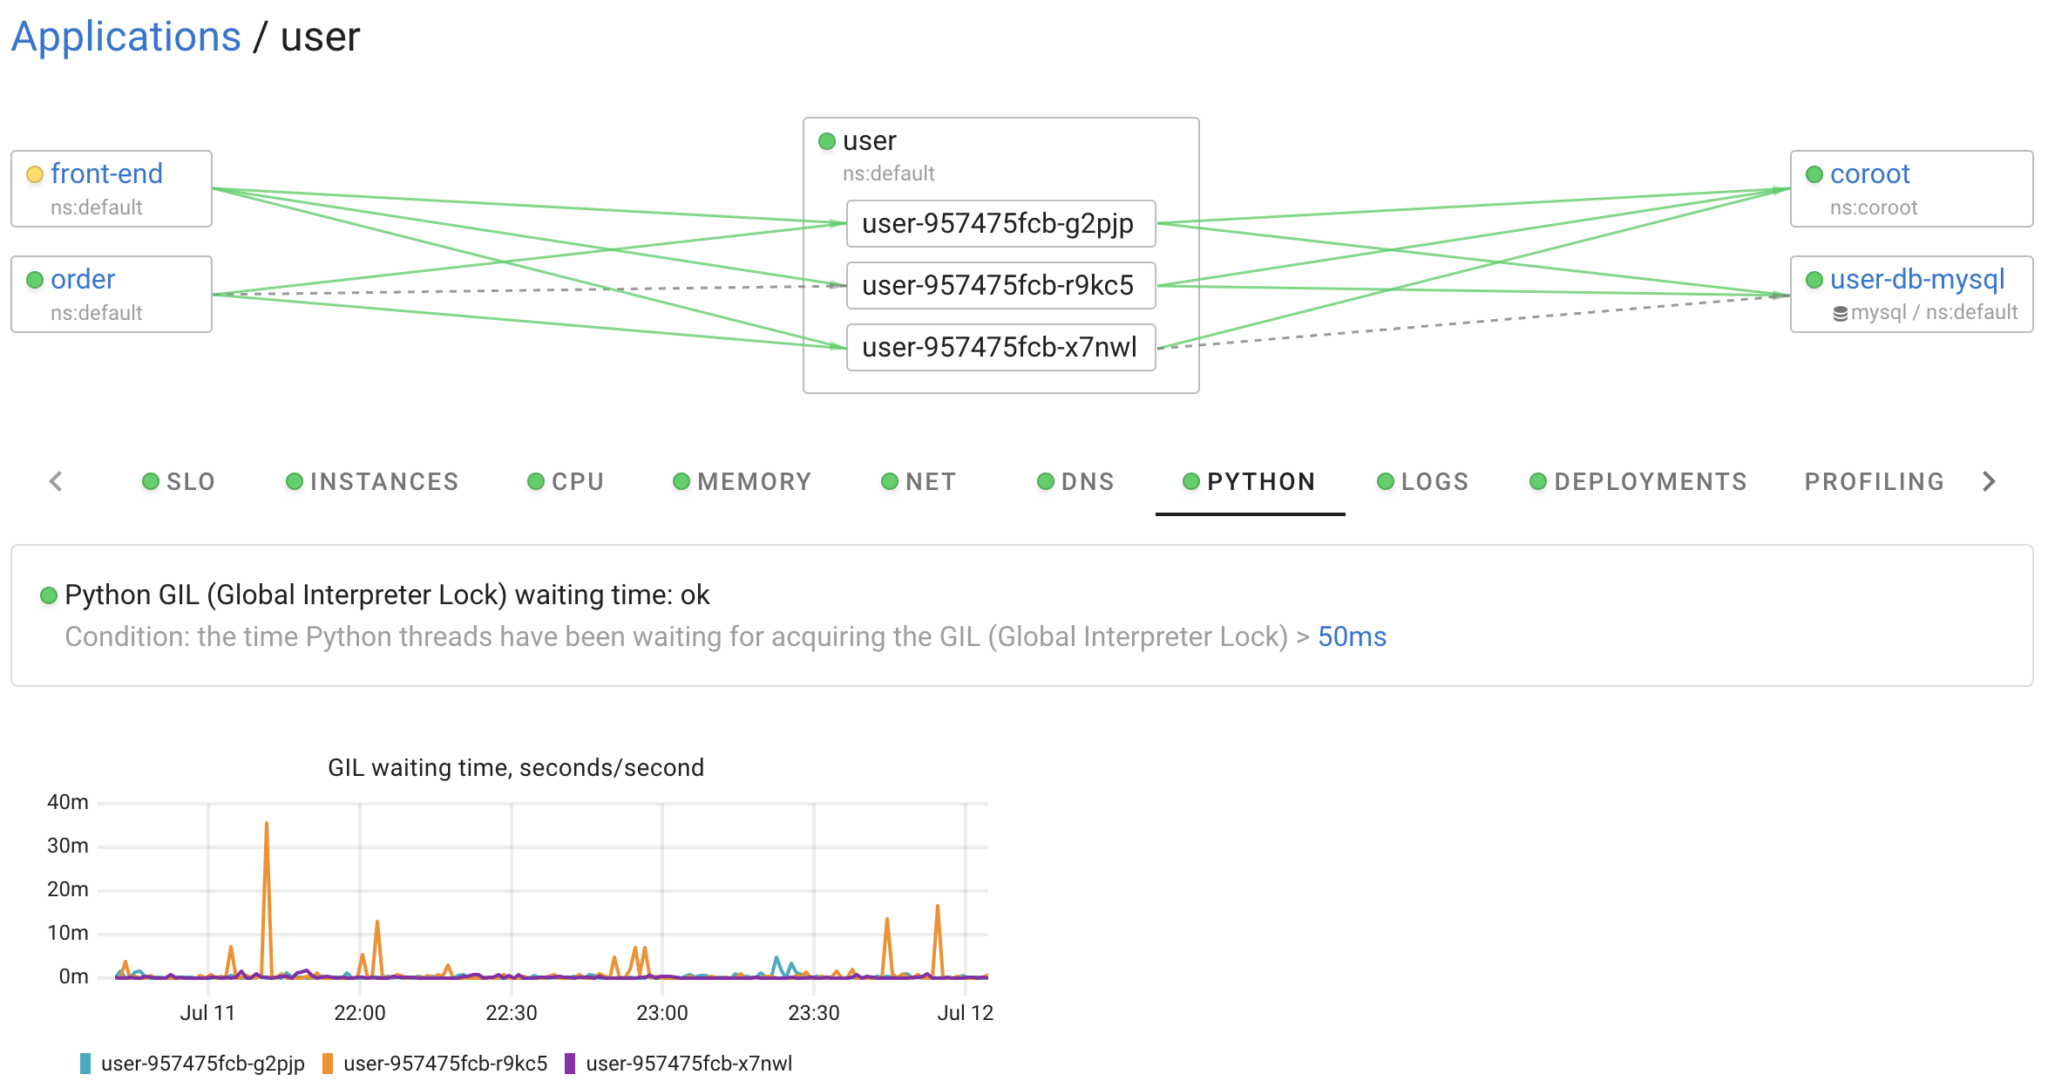
In my environment, the maximum lock time I’ve observed is 36ms per second. Whether this is a lot or a little depends on the application. The important thing is that we can now easily measure the additional latency the GIL introduces to our Python applications.
There are many discussions about the GIL and ways to avoid it, including rewriting Python apps in other programming languages. However, I strongly believe that before changing anything, engineers should measure the impact and then make decisions.
Coroot can help you understand your system better… without any code changes! Python GIL monitoring already available in Coroot v1.3.1.
Follow the instructions on our Getting started page to install Coroot Community Edition.
If you like Coroot, give us a ⭐ on GitHub️.
Any questions or feedback? Reach out to us on Slack.