Looking through endless postmortem reports and talking to other SREs, I feel that about 80% of outages are caused by similar factors: infrastructure failures, network errors/delays, lack of computing resources, etc. However, the cause of the remaining 20% can vary significantly since not all applications are built the same way.
Logs
All well-designed applications log their errors, so using a log management system can help you navigate through the logs quite efficiently. Yet, the cost of such systems can be unreasonably high. In fact, engineers don’t even need all the logs when investigating an incident, because it’s impossible to read every single message in a short period of time. Instead, they try extracting some sort of summary from the logs related to a specific timespan. If using console utilities, it should look like this:
- Getting the stream of the related log:
< cat | tail | journalctl | kubectl logs > ...
- Identifying the format to filter messages by severity
... | grep ERROR
- If needed, doing something with multi-line messages:
... | grep -C<N> ...
- Clustering (grouping) messages to identify the most frequent errors:
... | < some awk | sed | sort magic >
The resulting summary is usually a list of message groups with a sample and the number of occurrences.
It seems like this particular type of analysis can be done without a centralized log management system. Moreover, with some automation, we can greatly speed up this type of investigation.
At Coroot, we implemented an automated log parsing in our open-source Prometheus exporter node-agent. To explain how it works, let’s follow the same steps as I mentioned above.
Container logs discovery
The agent can discover the logs of each container running on a node by using different data sources depending on the container type:
- A process might log directly to a file in /var/log. In this case, the agent detects this by reading the list of open files of each process from /proc/<pid>/fd.
- Services managed by systemd usually use journald as a logging backend, so the agent can read a container’s log from journald.
- To find logs of Kubernetes pods or standalone containers, the agent uses meta-information from dockerd or containerd.
Handling multi-line messages
To extract multi-line messages from a log stream, we use a few dead-simple heuristics. The general one: if a line contains a field that looks like a datetime, and the following lines don’t — these are probably parts of a multi-line message. In addition to that, the agent uses some special parsing rules for Java stack traces and Python tracebacks.
According to our tests, this simple approach works pretty accurately and it can even handle custom multi-line messages.
Severity level detection
I would say it’s not actually detection, it’s more like guessing. For most log formats, the agent simply looks for a mention of known levels at the beginning of each message. In addition, we implemented special parsers for glog/klog and redis log formats. If it is impossible to detect the level of severity, the UNKNOWN level is used.
Messages clustering
A great compilation of the publications related to automated log parsing is available here. After reviewing these papers, we realized that our problem is much simpler than the ones most researchers have tried to solve. We just want to cluster messages to groups identified by some fingerprint. In doing so, we do not need to recognize the message format itself.
Our approach is entirely empirical and based on the observation that a logging entity is actually a combination of a template and variables, such as date, time, severity level, component, and other user-defined variables. We discovered that after removing everything that looks like a variable from a message, the remaining part itself can be considered as the pattern of this message.
In the first step, the agent removes quoted parts, parts in brackets, HEX numbers, UUIDs, and numeric values. Then, the remaining words are used to calculate the message group fingerprint. We extracted the code related to log parsing to this separate repository along with a command-line tool that can parse a log stream from stdin.
Here is a summary for a log from the logpai/loghub dataset (kudos to the Logpai team for sharing this dataset):
cat Zookeeper_2k.log | docker run -i --rm ghcr.io/coroot/logparser
▇                      12 ( 0%) - ERROR [LearnerHandler-/10.10.34.11:52225:LearnerHandler@562] - Unexpected exception causing shutdown while sock still open
▇                       1 ( 0%) - ERROR [CommitProcessor:1:NIOServerCnxn@180] - Unexpected Exception:
▇▇▇▇▇▇▇▇▇▇▇▇▇▇▇▇▇▇▇▇▇ 314 (23%) - WARN [SendWorker:188978561024:QuorumCnxManager$SendWorker@679] - Interrupted while waiting for message on queue
▇▇▇▇▇▇▇▇▇▇▇▇▇▇▇▇▇▇▇   291 (21%) - WARN [RecvWorker:188978561024:QuorumCnxManager$RecvWorker@762] - Connection broken for id 188978561024, my id = 1, error =
▇▇▇▇▇▇▇▇▇▇▇▇▇▇▇▇▇     266 (19%) - WARN [RecvWorker:188978561024:QuorumCnxManager$RecvWorker@765] - Interrupting SendWorker
▇▇▇▇▇▇▇▇▇▇▇▇▇▇▇▇▇     262 (19%) - WARN [SendWorker:188978561024:QuorumCnxManager$SendWorker@688] - Send worker leaving thread
▇▇▇▇▇▇                 86 ( 6%) - WARN [WorkerSender[myid=1]:QuorumCnxManager@368] - Cannot open channel to 2 at election address /10.10.34.12:3888
▇▇▇                    39 ( 2%) - WARN [NIOServerCxn.Factory:0.0.0.0/0.0.0.0:2181:ZooKeeperServer@793] - Connection request from old client /10.10.34.19:33442; will be dropped if server is in r-o mode
▇▇▇                    37 ( 2%) - WARN [NIOServerCxn.Factory:0.0.0.0/0.0.0.0:2181:NIOServerCnxn@349] - caught end of stream exception
▇▇                     19 ( 1%) - WARN [LearnerHandler-/10.10.34.12:35276:LearnerHandler@575] - ******* GOODBYE /10.10.34.12:35276 ********
▇                       3 ( 0%) - WARN [NIOServerCxn.Factory:0.0.0.0/0.0.0.0:2181:NIOServerCnxn@354] - Exception causing close of session 0x0 due to java.io.IOException: ZooKeeperServer not running
▇                       1 ( 0%) - WARN [LearnerHandler-/10.10.34.13:42241:Leader@576] - First is 0x0
1996 messages processed in 0.053 seconds:
  error: 13
  warning: 1318
  info: 665
Metrics
Node-agent parses the logs of every container running on a node and exports the container_log_messages_total:
container_log_messages_total{
    container_id="<ID of the container writing this log>",
    source="<log path or the stream source>",
    severity="<DEBUG|INFO|WARNING|ERROR|FATAL|UNKNOWN>",
    pattern_hash="<hash of the recognized pattern>",
    sample="<a sample message that is matched to this pattern>", # this can be replaced with Prometheus examplars in the future
}
AWS-agent exports the similar metrics aws_rds_log_messages_total related to every discovered RDS instance.
After Prometheus has collected the metrics from the node-agents, you can query these metrics using PromQL expressions like this:
sum by(level) (rate(container_log_messages_total{container_id="/docker/prometheus"}[1m]))
How we use these metrics
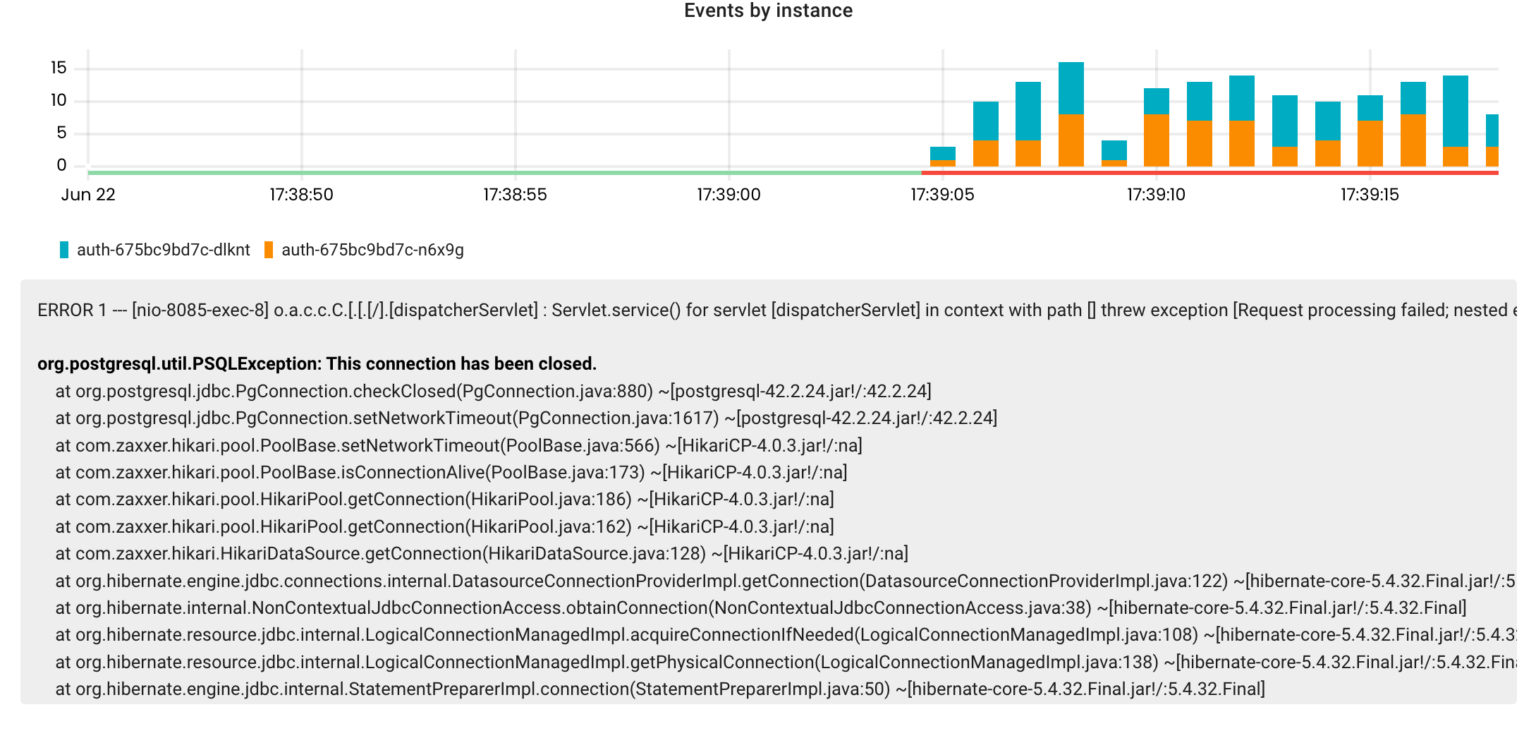
Coroot’s Logs Inspection (part of our commercial product) uses the log-based metrics to highlight errors that are correlating with the application SLIs. Here is a sample report:

Coroot’s Logs Inspection (part of our commercial product) uses the log-based metrics to highlight errors that are correlating with the application SLIs. Here is a sample report:

Useful links
- Get started with Coroot
- node-agent (Apache-2.0 License)
- logparser (Apache-2.0 License)
- Logs Inspection


