There seems to be even more buzz concerning the three, four, or possibly more pillars of observability. In the end it’s just metrics, logs, and traces. Some are now referring to profiles as the fourth pillar.
All the experts focus mostly on how to gather and store telemetry data. However, I have hardly ever heard any thoughts on how to use all this data to pinpoint issues. I believe, the most important thing is to know what to do when you’ve been notified that there is something wrong with your system:
- Should I look at metrics? Which ones exactly? I have thousands of them!
- Or maybe logs or traces? Where should I start?
Perhaps the reason why there isn’t a broader conversation about this crucial part of troubleshooting is that some people believe it doesn’t make sense to suggest anything without knowing the specifics of a particular system, as not all systems are built the same.
But, is that really the case?
Let’s conduct a thought experiment. Imagine that a friend is calling you for help about an issue in their system which you know nothing about. If you really wanted to help, what hypotheses would you propose about the possible cause of the problem? I’ve been asking many engineers this question, and it’s surprising to find that over 80% of hypotheses are the same.
Although it may seem like there are endless possible causes of an outage, try writing them down one by one. After a few minutes, you’ll likely find it challenging to come up with something completely new to add to your list.
We built Coroot under the belief that, in most cases, the root cause of an outage can be detected automatically. Coroot is an open-source zero-instrumentation observability tool that turns telemetry data into answers about app issues and how to fix them.
In this post, I’ll try to convince you that there are much fewer potential scenarios of problems than it may seem at first glance.
Let’s make a comprehensive list of the factors that may potentially cause an application to become unavailable, responding with errors, or operate slower than usual. Firstly, let’s list the possible types of problems. I could only come up with the following six types. While I might have overlooked something, I don’t believe it’s possible to double this list.
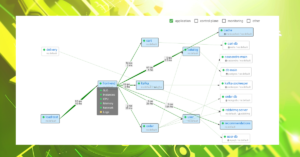
Now, let’s dig into each of these types and explore the various failure scenarios and how to identify them. The biggest challenge in automatically detecting a specific cause is that all checks must be carried out within the context of a particular application. This means that it’s essential to have knowledge of all application instances, the nodes they run on, and the services they interact with, among other relevant factors.
Lack of CPU time
The CPU time available on a given node is a finite resource that must be shared among the containers running on it. As a result, these containers compete for their fair share of CPU time. When the CPU becomes overwhelmed or an application container has reached its CPU limit, the app’s ability to process user requests may be significantly impacted.
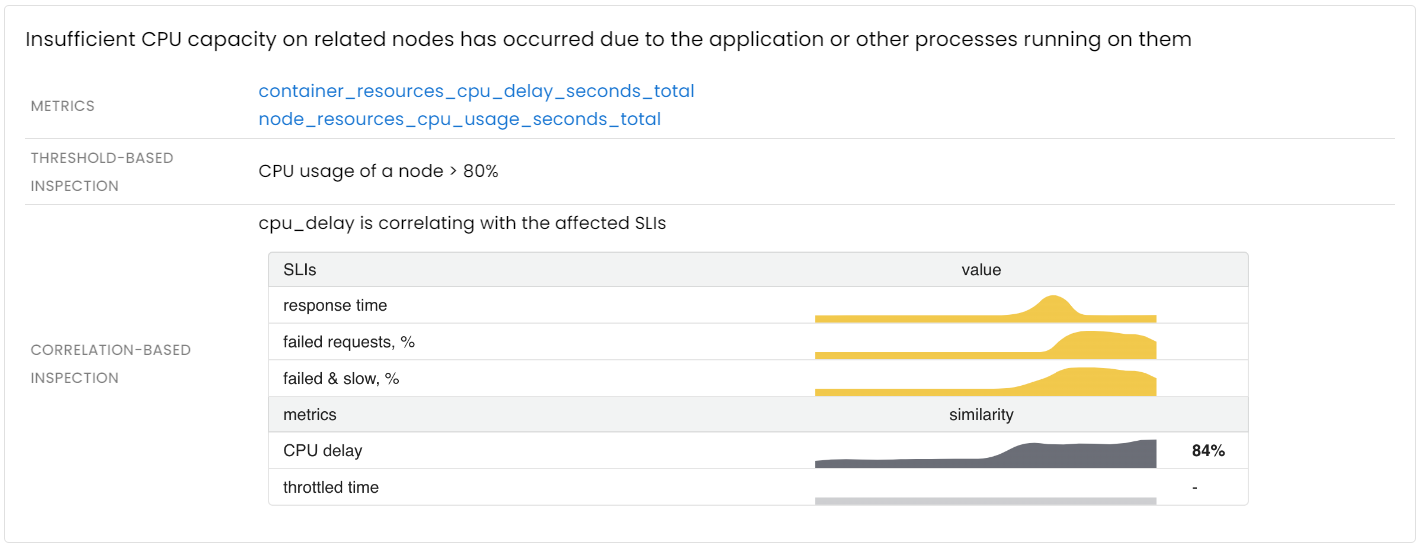

Once a CPU-related issue is detected, you can use a continuous profiler to analyze any unexpected spike in CPU usage down to the precise line of code.
![]()
Application instances are not available
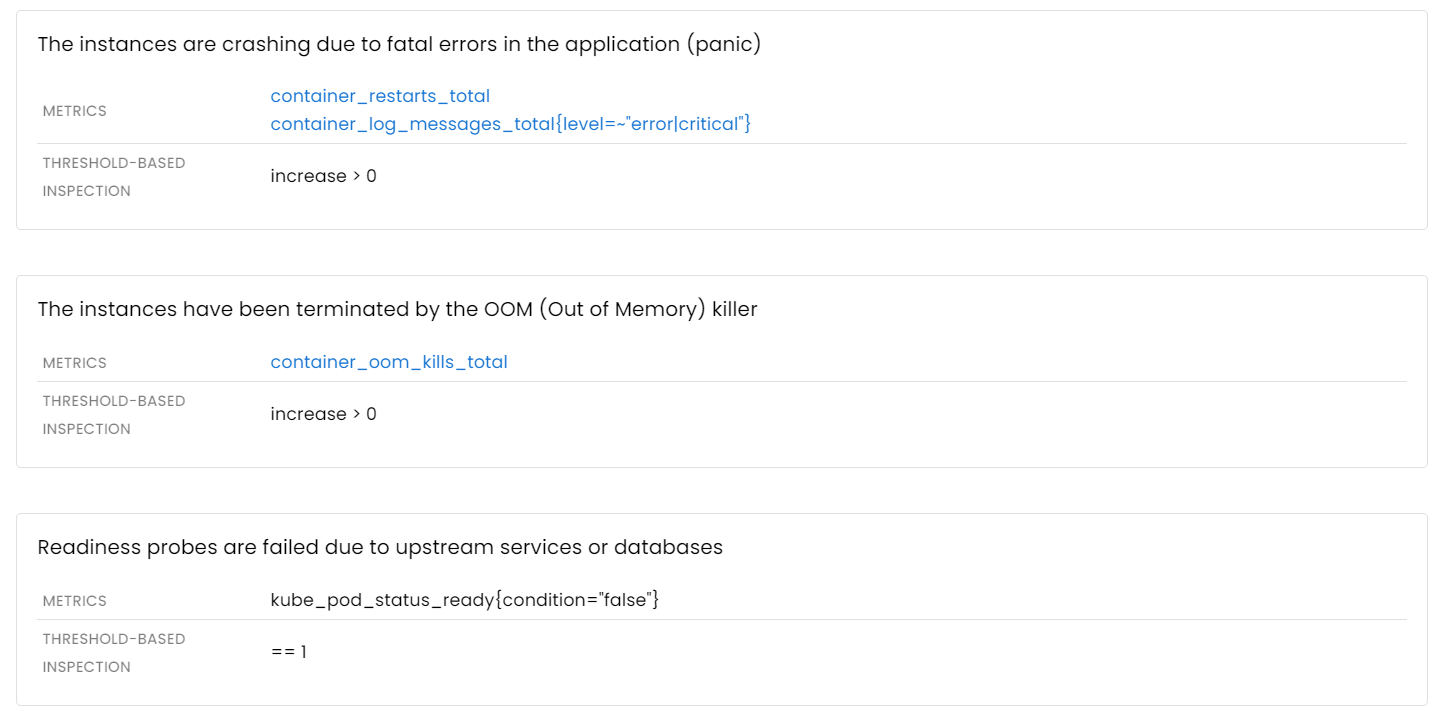
So, what are the possible scenarios that could lead to one or more application instances becoming unavailable? Everyone is familiar with the manual investigation process, which involves using kubectl, logs, and some container metrics.
However, the most common failure scenarios can be detected automatically:

Storage issues
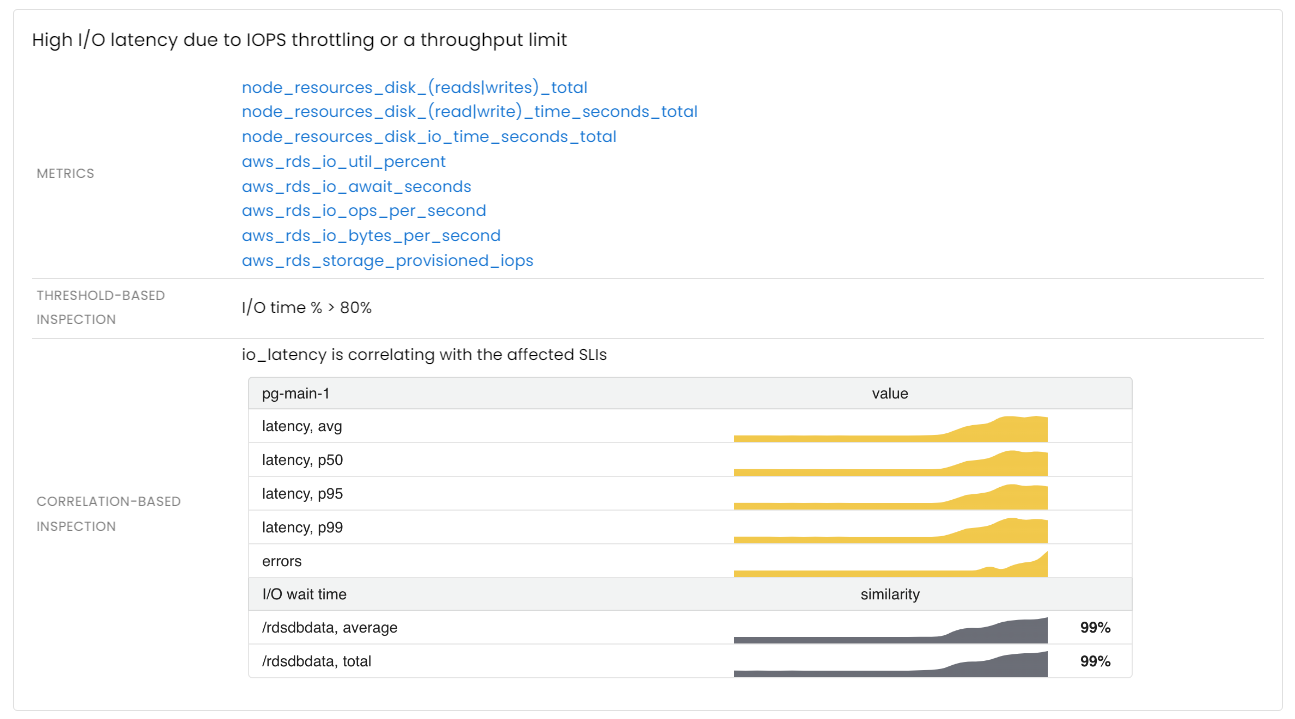
A disk subsystem is a crucial component for most stateful applications such as database servers. There are two primary types of issues with storage that can affect any stateful application:
- Inability to perform read or write requests
- I/O latency: slow disk access times can cause delays in reading or writing data

Application runtime issues
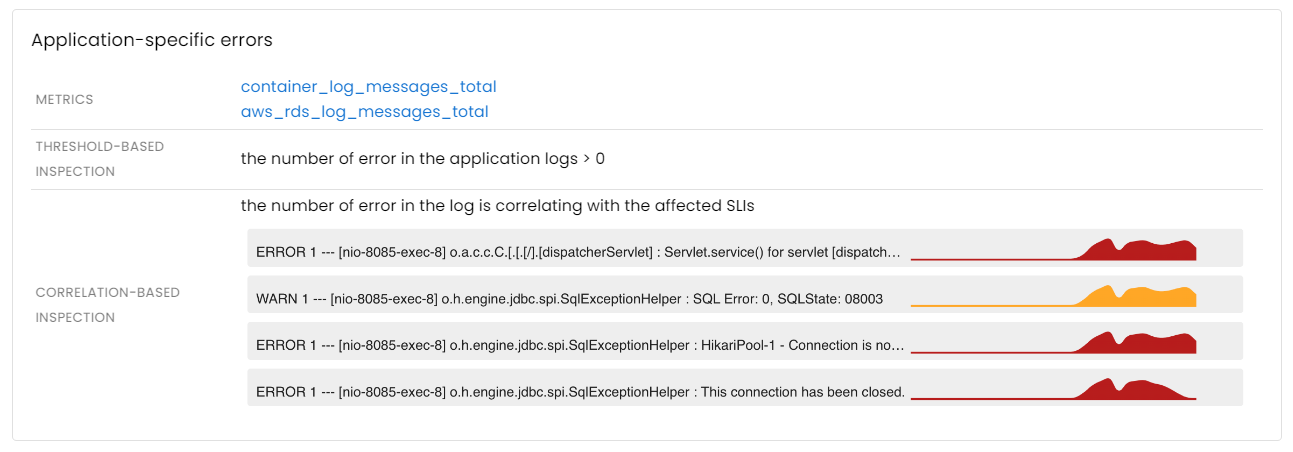
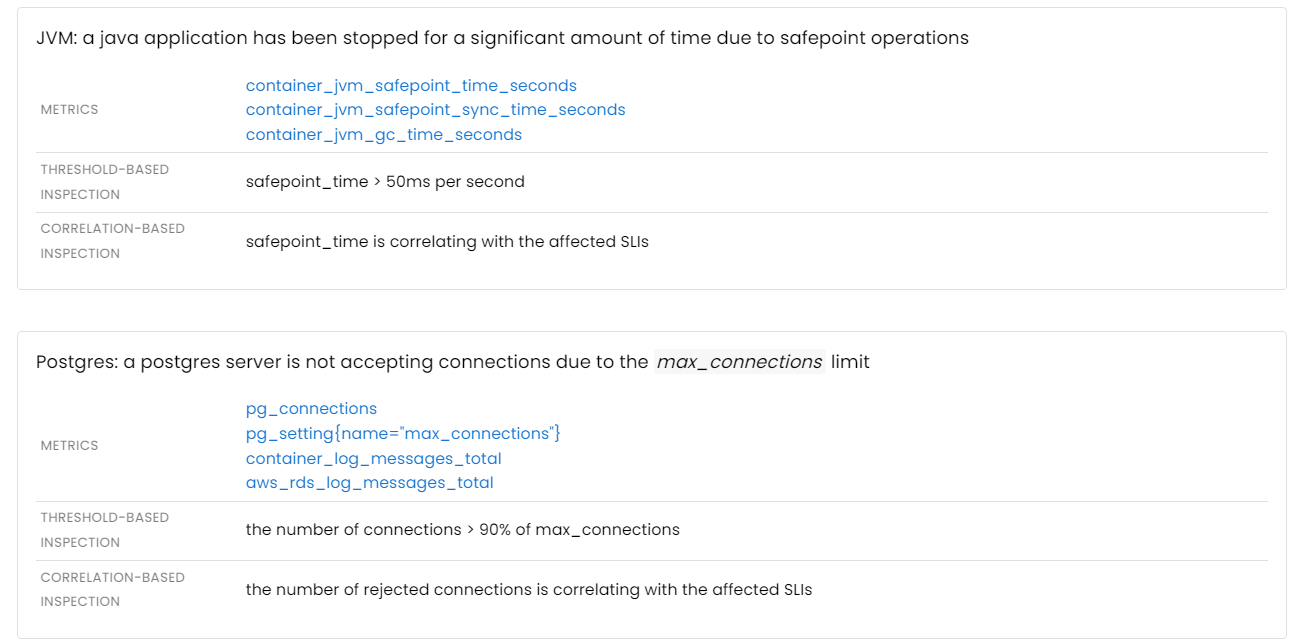
Although this class of problems is highly diverse and the specific scenarios can vary depending on the architecture of each individual application, there are some common issues that can be automatically identified. Furthermore, analyzing application logs can help pinpoint errors relevant to a particular outage.
- Application-specific errors
- Lock contention
- Thread/connection pool capacity
- Garbage collection / stop-the-world pauses

Issues with upstream services and databases
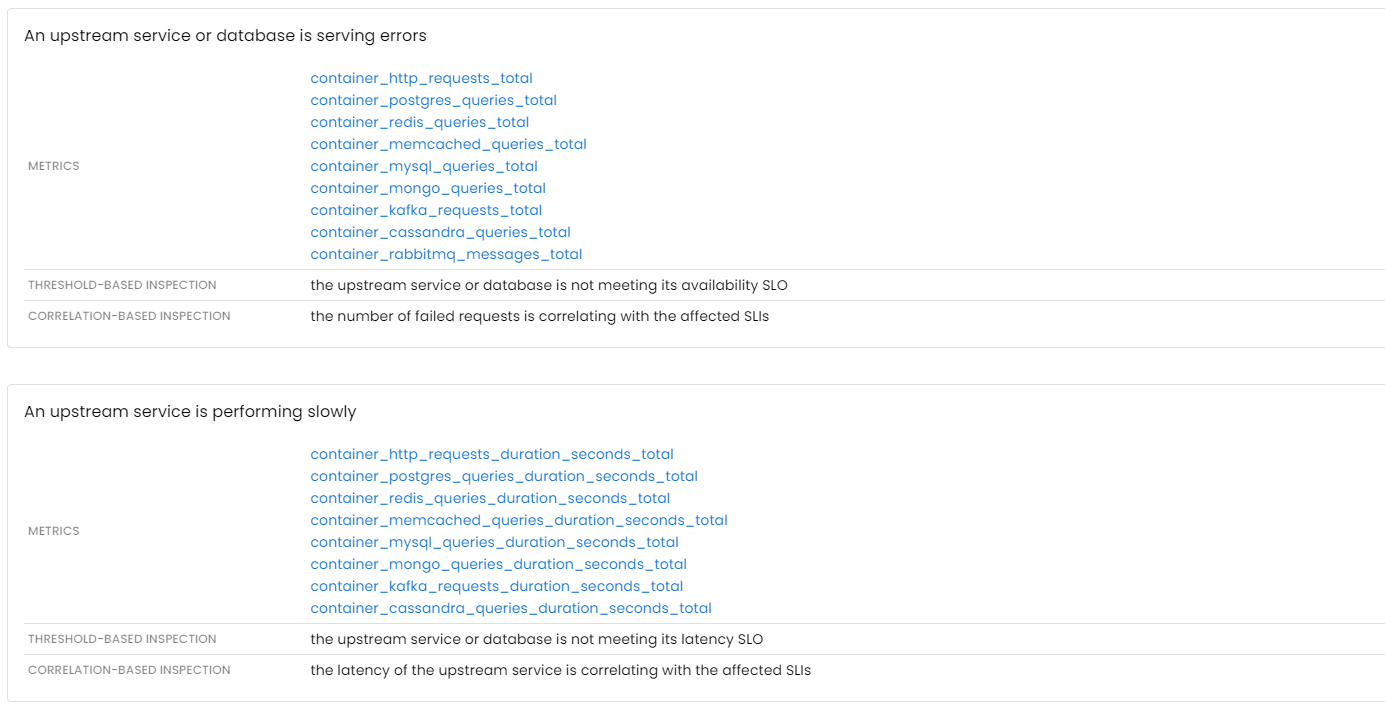
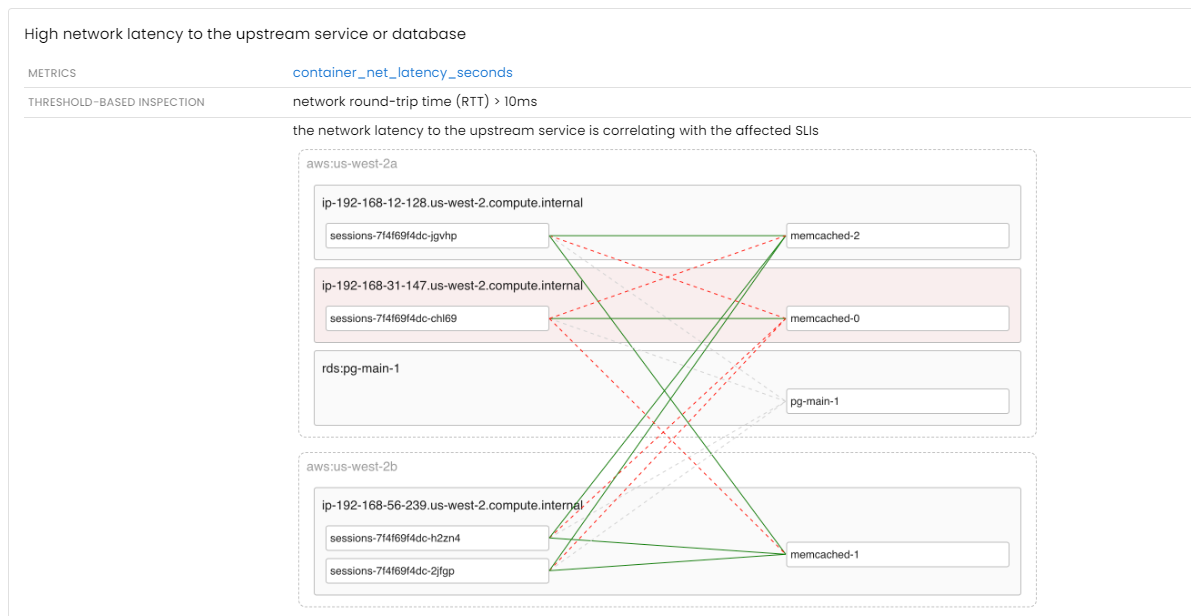
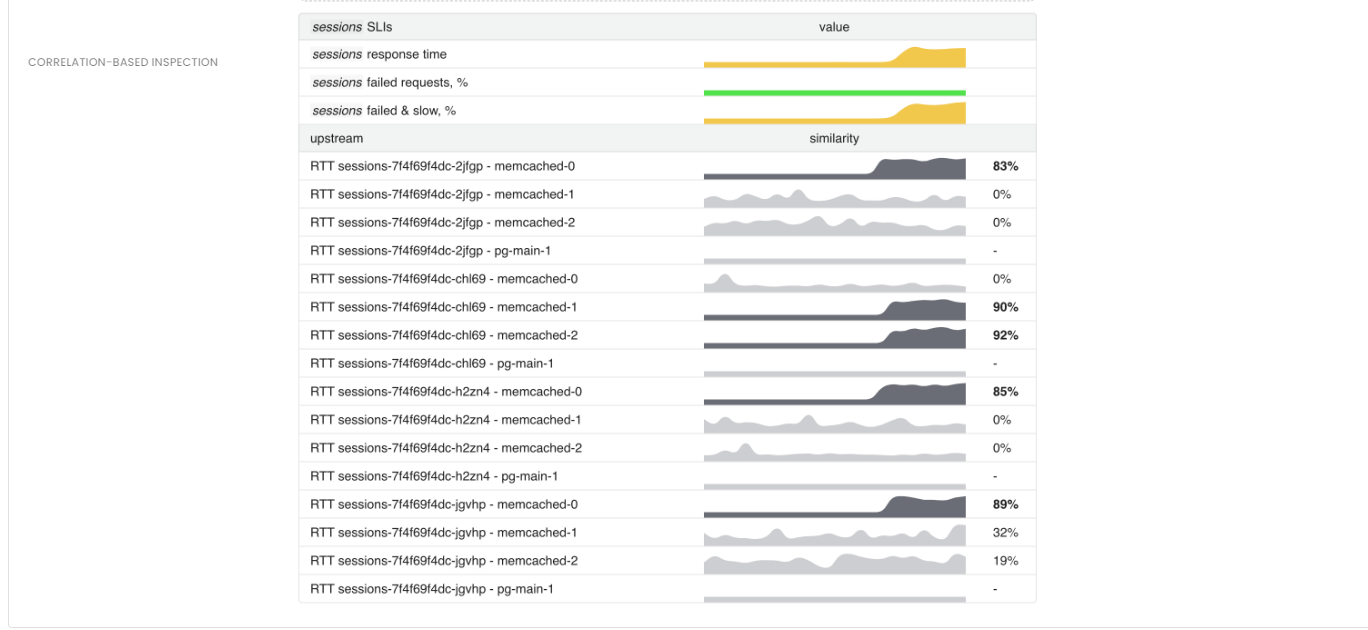
If an application depends on other services or databases to process requests, any degradation in the performance of those components will inevitably impact the application’s own performance.
Distributed tracing is a common method used to gain insight into the interactions between services. While traces are effective for analyzing individual requests, aggregated metrics are better suited for automated analysis. Moreover, it’s worth noting that traces may not always be effective for identifying network issues that occur between services.

Conclusion
It is difficult to accurately estimate the coverage of all possible issues by these inspections, but such analysis is an excellent starting point for troubleshooting.
For example, if an application violates its SLOs, Coroot will send you an alert that already contains the list of the issues related to this app:

Follow the instructions on our Getting started page to try Coroot now. Not ready to Get started with Coroot? Check out our live demo.
If you like Coroot, give us a ⭐ on GitHub️ or share your experience on G2.
Any questions or feedback? Reach out to us on Slack.

