In this blog post we will look at runqlat and runqslower commands. They are available in both BCC and bpftrace tool collections.
Background
One of the core functions of Linux operating system is to schedule processes across available CPUs. When service gets a request, Linux typically will need to schedule the process, processing that request to run on one of CPUs. This might be very quick process if idle CPU is available or it can take significant time, if all CPUs are currently busy running different processes. In complicated environments other limits may exist – CPU usage limits in Virtualized environments or cgroups CPU limits often used in Kubernetes environments.
No matter what is the reason of CPU scheduling delay, it will be seen as additional latency from the standpoint of service or user originating request. In many cases CPU starvation first represents itself as additional tail latencies and may not be visible in overall CPU utilization graphs.
Problem
Check if CPU starvation is causing significant additional latency in my application, see what applications are affected and if this added latency reaches unacceptable levels.
Tools Usage
Running runqlat on relatively idle system we see most processes are scheduled in less than 10 microseconds, with very few cases of scheduling taking more than 1ms
# runqlat
Tracing run queue latency… Hit Ctrl-C to end.
^C
usecs : count distribution
0    ->    1    : 2672 **
2    ->    3    : 14113 *************
4    ->    7    : 37836 ****************************************
8    ->    15   : 10423 ***********
16   ->    31   : 542 *****
32   ->    63   : 3642 ***
64   ->    127  : 3563 ***
128  ->    255  : 2409 **
256  ->    511  : 1147 *
512  ->    1023 : 363
1024 ->    2047 : 161
2048 ->    4095 : 61
4096 ->    8191 : 6
If we put the same system under CPU starvation condition (a lot more runnable processes than CPUs available) we will see different picture:
# runqlat
Tracing run queue latency… Hit Ctrl-C to end.
^C
usecs : count distribution
0      -> 1      : 18415 **
2      -> 3      : 20065 ***
4      -> 7      : 237573 ****************************************
8      -> 15     : 51526 ********
16     -> 31     : 29037 ****
32     -> 63     : 18729 ***
64     -> 127    : 19147 ***
128    -> 255    : 10897 *
256    -> 511    : 7154  *
512    -> 1023   : 7506  *
1024   -> 2047   : 10168 *
2048   -> 4095   : 11203 *
4096   -> 8191   : 9991  *
8192   -> 16383  : 10058 *
16384  -> 32767  : 4019
32768  -> 65535  : 57832 *********
65536  -> 131071 : 29226 ****
131072 -> 262143 : 363
262144 -> 524287 : 8
Note we have significantly more cases when the process had to wait for 50ms or longer to be scheduled.
In this case we’re looking at the run queue latency / scheduling latency for system overall, where it is common to be interested only latency impact for specific process or cgroup – the tools also allows it (see Command Line Options Section)
Interested to easily see what process are impacted by scheduling latency ? You can see runqslower tool for that. Let’s see which processes are affected by waiting more than 100ms to get placed on the CPU ?
# runqslower 100000
Tracing run queue latency higher than 100000 us
TIME     COMM    TID    LAT (us)
19:20:22 stress 1063596 105001
19:20:24 stress 1063599 101999
19:20:24 stress 1063599 100537
19:20:24 stress 1063616 101000
19:20:24 stress 1063605 100359
19:20:24 stress 1063575 102001
19:20:24 stress 1063570 102001
19:20:24 stress 1063591 102005
19:20:25 stress 1063562 112699
19:20:25 stress 1063576 131656
19:20:25 stress 1063574 102000
19:20:31 stress 1063565 100999
19:20:31 stress 1063612 100998
19:20:31 stress 1063593 101001
“Stress” is application I used to cause high CPU usage – and we can see Linux being pretty smart here and now “interactive” applications are showing high scheduling latency in this example
Command Line Options
# runqlat –help
Usage: runqlat [OPTION…]
Summarize run queue (scheduler) latency as a histogram.
USAGE: runqlat [–help] [-T] [-m] [–pidnss] [-L] [-P] [-p PID] [interval] [count] [-c CG]
EXAMPLES:
runqlat # summarize run queue latency as a histogram
runqlat 1 10 # print 1 second summaries, 10 times
runqlat -mT 1 # 1s summaries, milliseconds, and timestamps
runqlat -P # show each PID separately
runqlat -p 185 # trace PID 185 only
runqlat -c CG # Trace process under cgroupsPath CG
-c, –cgroup=/sys/fs/cgroup/unified
Trace process in cgroup path
-L, –tids Print a histogram per thread ID
-m, –milliseconds Millisecond histogram
–pidnss Print a histogram per PID namespace
-p, –pid=PID Trace this PID only
-P, –pids Print a histogram per process ID
-T, –timestamp Include timestamp on output
-v, –verbose Verbose debug output
-?, –help Give this help list
–usage Give a short usage message
-V, –version Print program version
# runqslower –help
Usage: runqslower [OPTION…]
Trace high run queue latency.
USAGE: runqslower [–help] [-p PID] [-t TID] [-P] [min_us]
EXAMPLES:
runqslower # trace latency higher than 10000 us (default)
runqslower 1000 # trace latency higher than 1000 us
runqslower -p 123 # trace pid 123
runqslower -t 123 # trace tid 123 (use for threads only)
runqslower -P # also show previous task name and TID
-p, –pid=PID Process PID to trace
-P, –previous also show previous task name and TID
-t, –tid=TID Thread TID to trace
-v, –verbose Verbose debug output
-?, –help Give this help list
–usage Give a short usage message
-V, –version Print program version
Related Features in Coroot
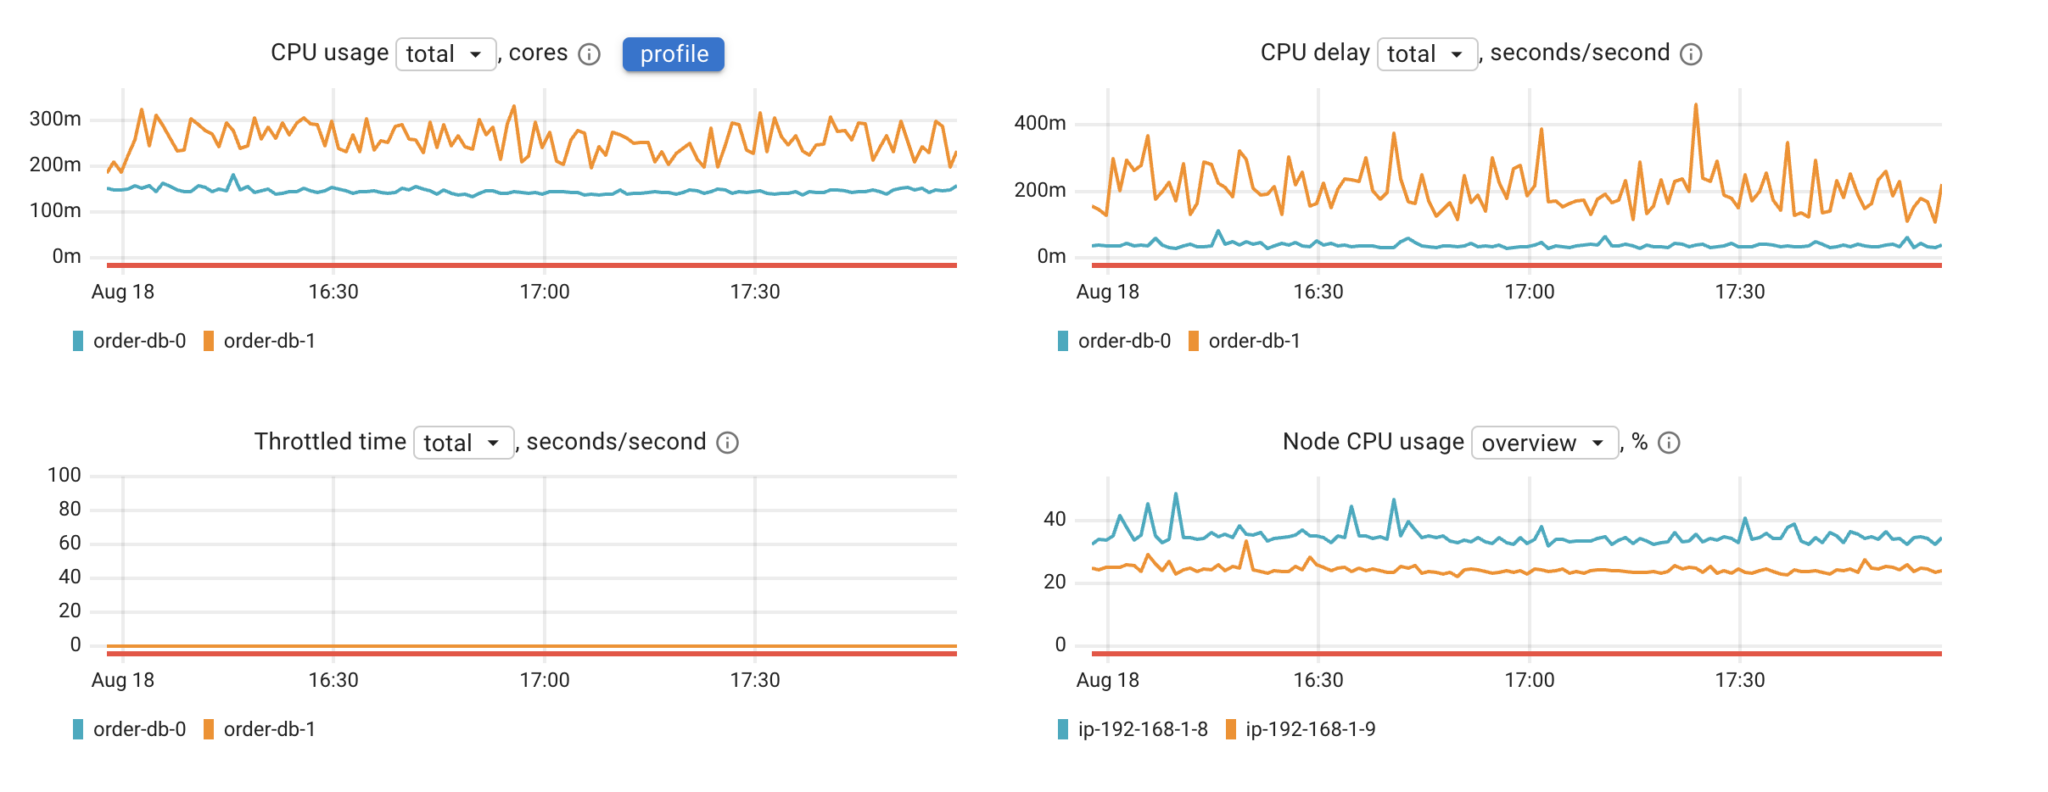
Coroot uses Linux Delay Accounting to help to understand if CPU starvation is a limiting factor for service performance. As of Coroot 1.4.1 Coroot does not provide distribution latency information or detects specific outliers.
For more eBPF Linux Command Line tools check out this article.