Introducing Coroot
 Nikolay Sivko
We’re Nik and Anton, founders of Coroot. We’ve built a tool that boosts the reliability engineering skills of your team. Think of it as your personal assistant who has not only found the root cause of an outage but also suggested a list of possible fixes.
Background
Having a background in managing IT ops teams and building a cloud monitoring platform, here are my observations based on my experience:
-
The main purpose of monitoring tools is to help you detect and fix outages. Instead of doing this, most only give you the ability to configure dashboards and triggers. Furthermore, you still have to manually search for the needle in the haystack of metrics, logs, and traces.
-
Monitoring software would do so much more if it only knew what engineers know. For instance, if a container is limited in CPU time due to throttling, that means this container is performing slower. Most engineers could realize that these two events are interrelated due to their understanding of the physical meaning of metrics. Current tools would just overlook it.
Another limitation existing tools have is their inability to see the whole picture. For example, it is advantageous to understand that an application is a set of containers that work together. So, a metric describing an individual container will not tell you anything. However, a metric describing all related containers would be quite revealing.
-
I’ve seen a lot of engineers work on fixing issues. Interestingly enough, they all act practically the same. They check a similar set of hypotheses about a possible root cause, confirming or rejecting them one by one: compute resources, upstream services, databases, etc.
Of course, this list is not exhaustive since each application might have its own specific issues. Nevertheless, imagine if you were able to check for common pitfalls in just one second.
Coroot
We’ve built Coroot under the belief that more than 80% of issues can be detected automatically. Coroot is a virtual assistant who audits your infrastructure just like an experienced engineer would. It:
- turns metrics describing any system to a model of that system
- checks a set of hypotheses to confirm or reject having issues in any subsystem
- suggests a list of possible fixes along with helpful details concerning each particular issue
Making a model of a distributed system
In order to get a clear picture of a distributed system, Coroot makes a model of it. The first main step here is to group individual containers into services or applications.
Previously, meta-information for the grouping was only available in manifests of configuration management tools, such as Chef, Ansible, and Puppet. Nowadays, the widespread adoption of Kubernetes makes it easier to extract this data. However, it is not enough.
We also need to know how applications communicate with each other. Coroot uses network-level tracing to get a comprehensive map of all network connections in a cluster. This approach has a number of advantages over application-level tracing:
- Easy integration without the need to change code.
- It traces absolutely all communications, including connections between infrastructure components (e.g., message brokers and databases).
Network tracing is a part of our open-source node-agent which is compatible with Prometheus.
Below you can see a model of the product-catalog application. It has two instances running three applications communicating with it: kubelet, prometheus, and frontend. Product-catalog itself depends only on the pg-main-1 database.
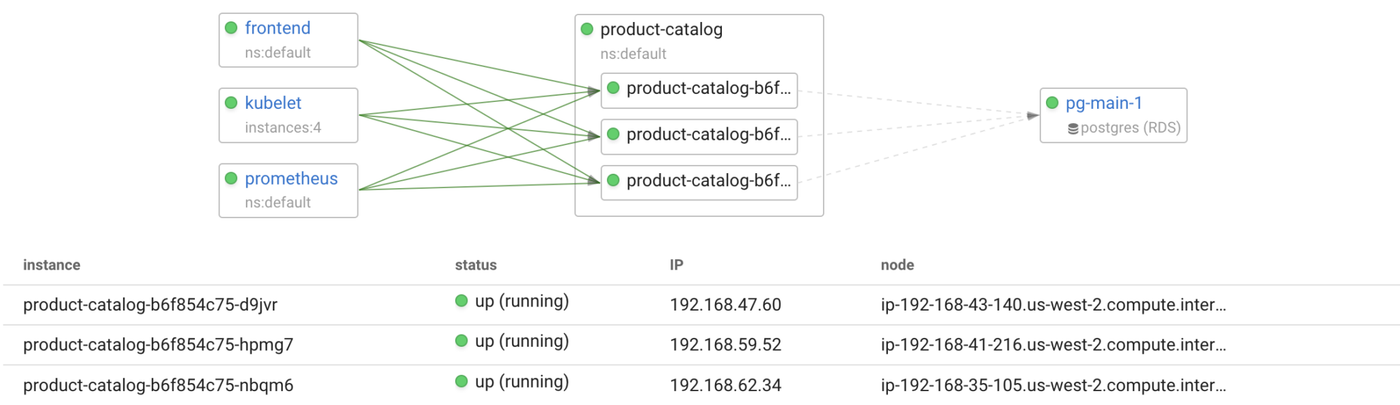
A model like this is already pretty useful since it gains visibility into the distributed system architecture. At Coroot, we went further by using application models for root cause analysis.
Model aware inspections
Unfortunately, using thresholds for metrics is not always possible, since not all applications are built the same. For instance, an application with a response time objective set at 10ms would be affected even by the slightest increase in network latency. So, setting a low threshold for network latency seems reasonable. Though, doing this may generate a large number of false positives for services resilient against such delays.
Using a model, such as the one described above, empowers Coroot to audit all subsystems within an application’s context. In other words, each inspection is aware of the instances, nodes, and services related to any particular application.
For example, the Storage inspection checks the correlation between database latency and its volumes’ performance:
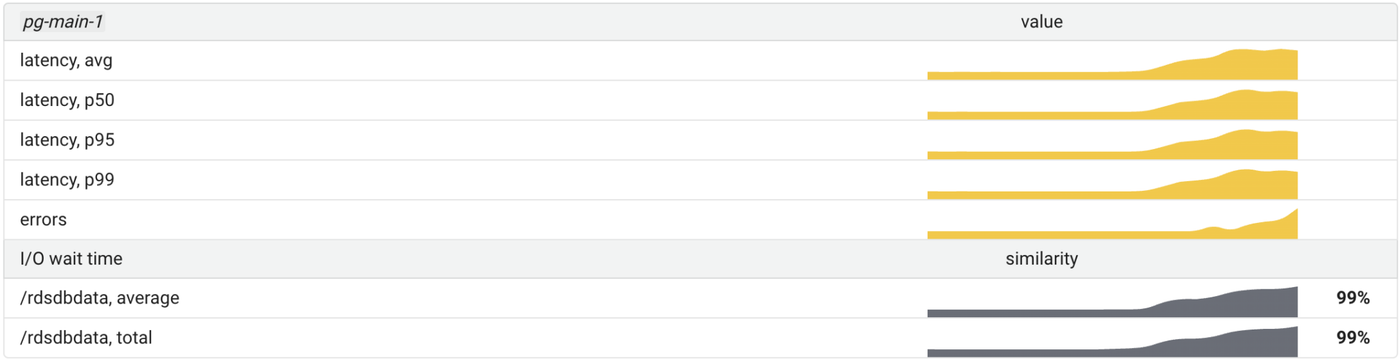
The strong correlation seen here means the database latency has been affected by the storage I/O latency. If an application is meeting its SLOs in the short term, it is not necessary to perform such inspections. This eliminates false positives in root cause analysis.
The coolest thing is that this approach does not require any configuration other than the user-defined application SLOs.
Help in fixing issues
Coroot aims to help in troubleshooting by providing you with a list of possible fixes and useful details on every detected issue.
Below is an example of the Storage inspection‘s report:
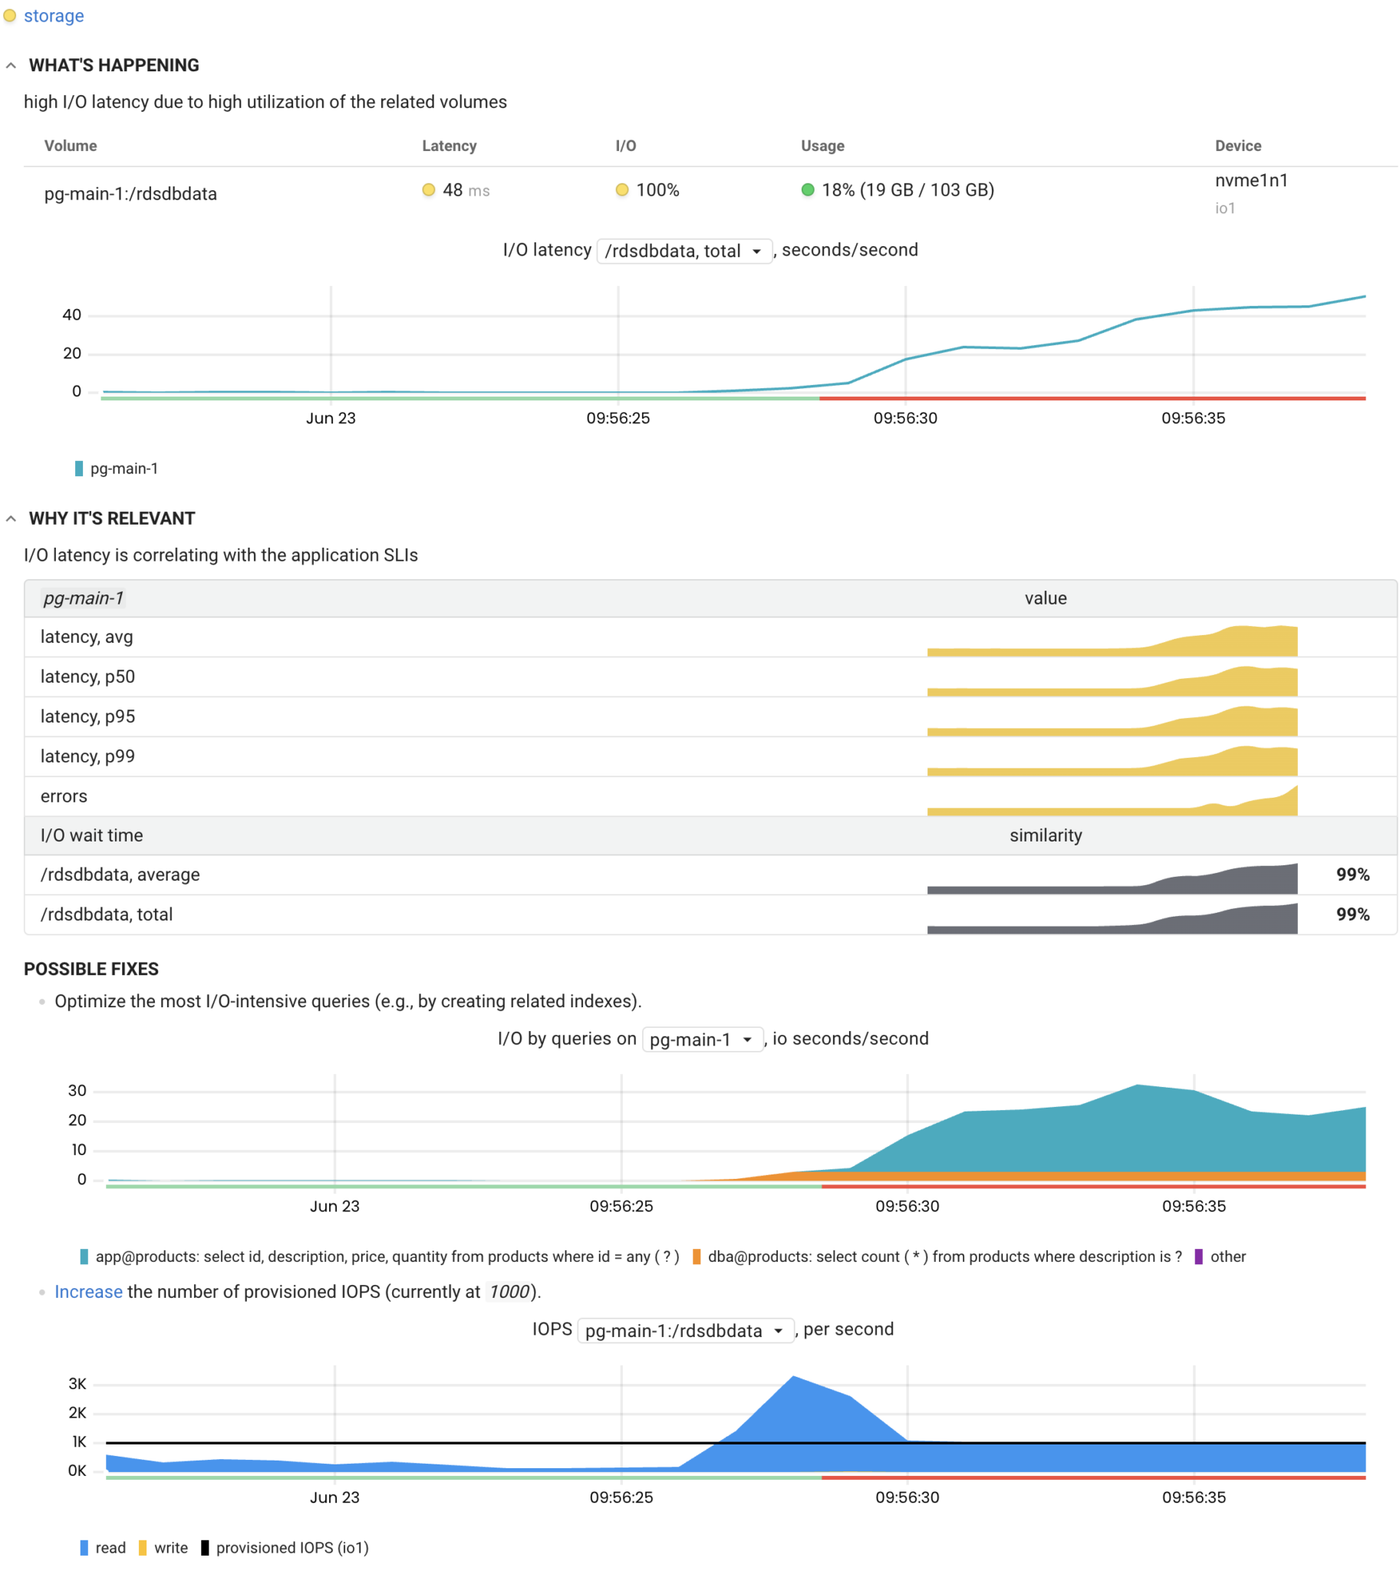
As you can see, there are two primary ways to fix the issue: reduce the I/O load or increase the volume performance. However, Coroot went a step further and collected all the details needed to troubleshoot:
- The list of most I/O-intensive database queries that helps to identify which ones are necessary to optimize, eliminate or move over to a separate read replica.
- The details of the volume, such as storage type, size, and the number of provisioned IOPS.
- Links to the related documentation pages to avoid navigating through your knowledge base or googling it.
Conclusion
As we work on Coroot, we are constantly asking ourselves:
- What are all the possible ways to fix an outage?
- What do engineers need to troubleshoot efficiently?
- What additional information might be helpful to them?
Though these questions are very basic and straightforward, chasing to answer them through a product is quite complicated. Nevertheless, we have come up with a truly efficient assistant that promises to make any engineer’s life much easier.