Adopting a microservice architecture can unleash development agility and productivity, but it can also significantly increase the complexity of a system. From the ops perspective, a single cluster can run dozens or hundreds of services that compete for computing resources and communicate with each other over a network across several availability zones. Even the slightest instability in such a system can start a domino effect. For example, a network latency increase between two random nodes in a cluster can affect dozens of microservices at once.
We built Coroot to simplify troubleshooting even in complex systems. One of the key differences between Coroot and other tools out there is its ability to discover any distributed system topology automatically. This makes it possible to find the issues that definitely affect a particular application without any configuration other than defining SLOs (Service Level Objectives). In other words, you only need to define how you expect the service to work. For example, the SLOs of a web service can look something like this:
- Availability: 99% of requests should not fail
- Latency: 99% of requests should be served in less than 100ms
Once you define the SLOs of a service, Coroot starts to track their compliance.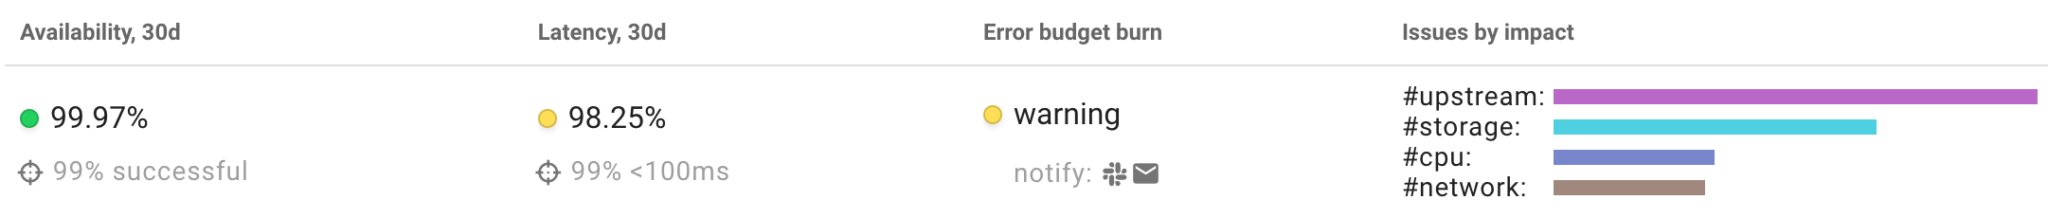
Incident intelligence automation
Whenever a service does not meet the specified SLOs, Coroot initiates an automated investigation to find the issues affecting that service. Each of the following inspections checks the correlation between the affected app’s SLIs (Service Level Indicators) and metrics describing a subsystem:
- CPU: identifies when an app is experiencing a lack of CPU time due to throttling or high CPU usage on the related nodes.
- Memory: detects situations where an app’s containers have been terminated by the OOM (Out Of Memory) killer.
- Storage: identifies when the performance of a storage volume is affecting the application.
- Instances: detects when one or more instances of an app are unavailable or have been restarted.
- Logs: audits log-based metrics and highlights the errors correlating with the SLIs of an app.
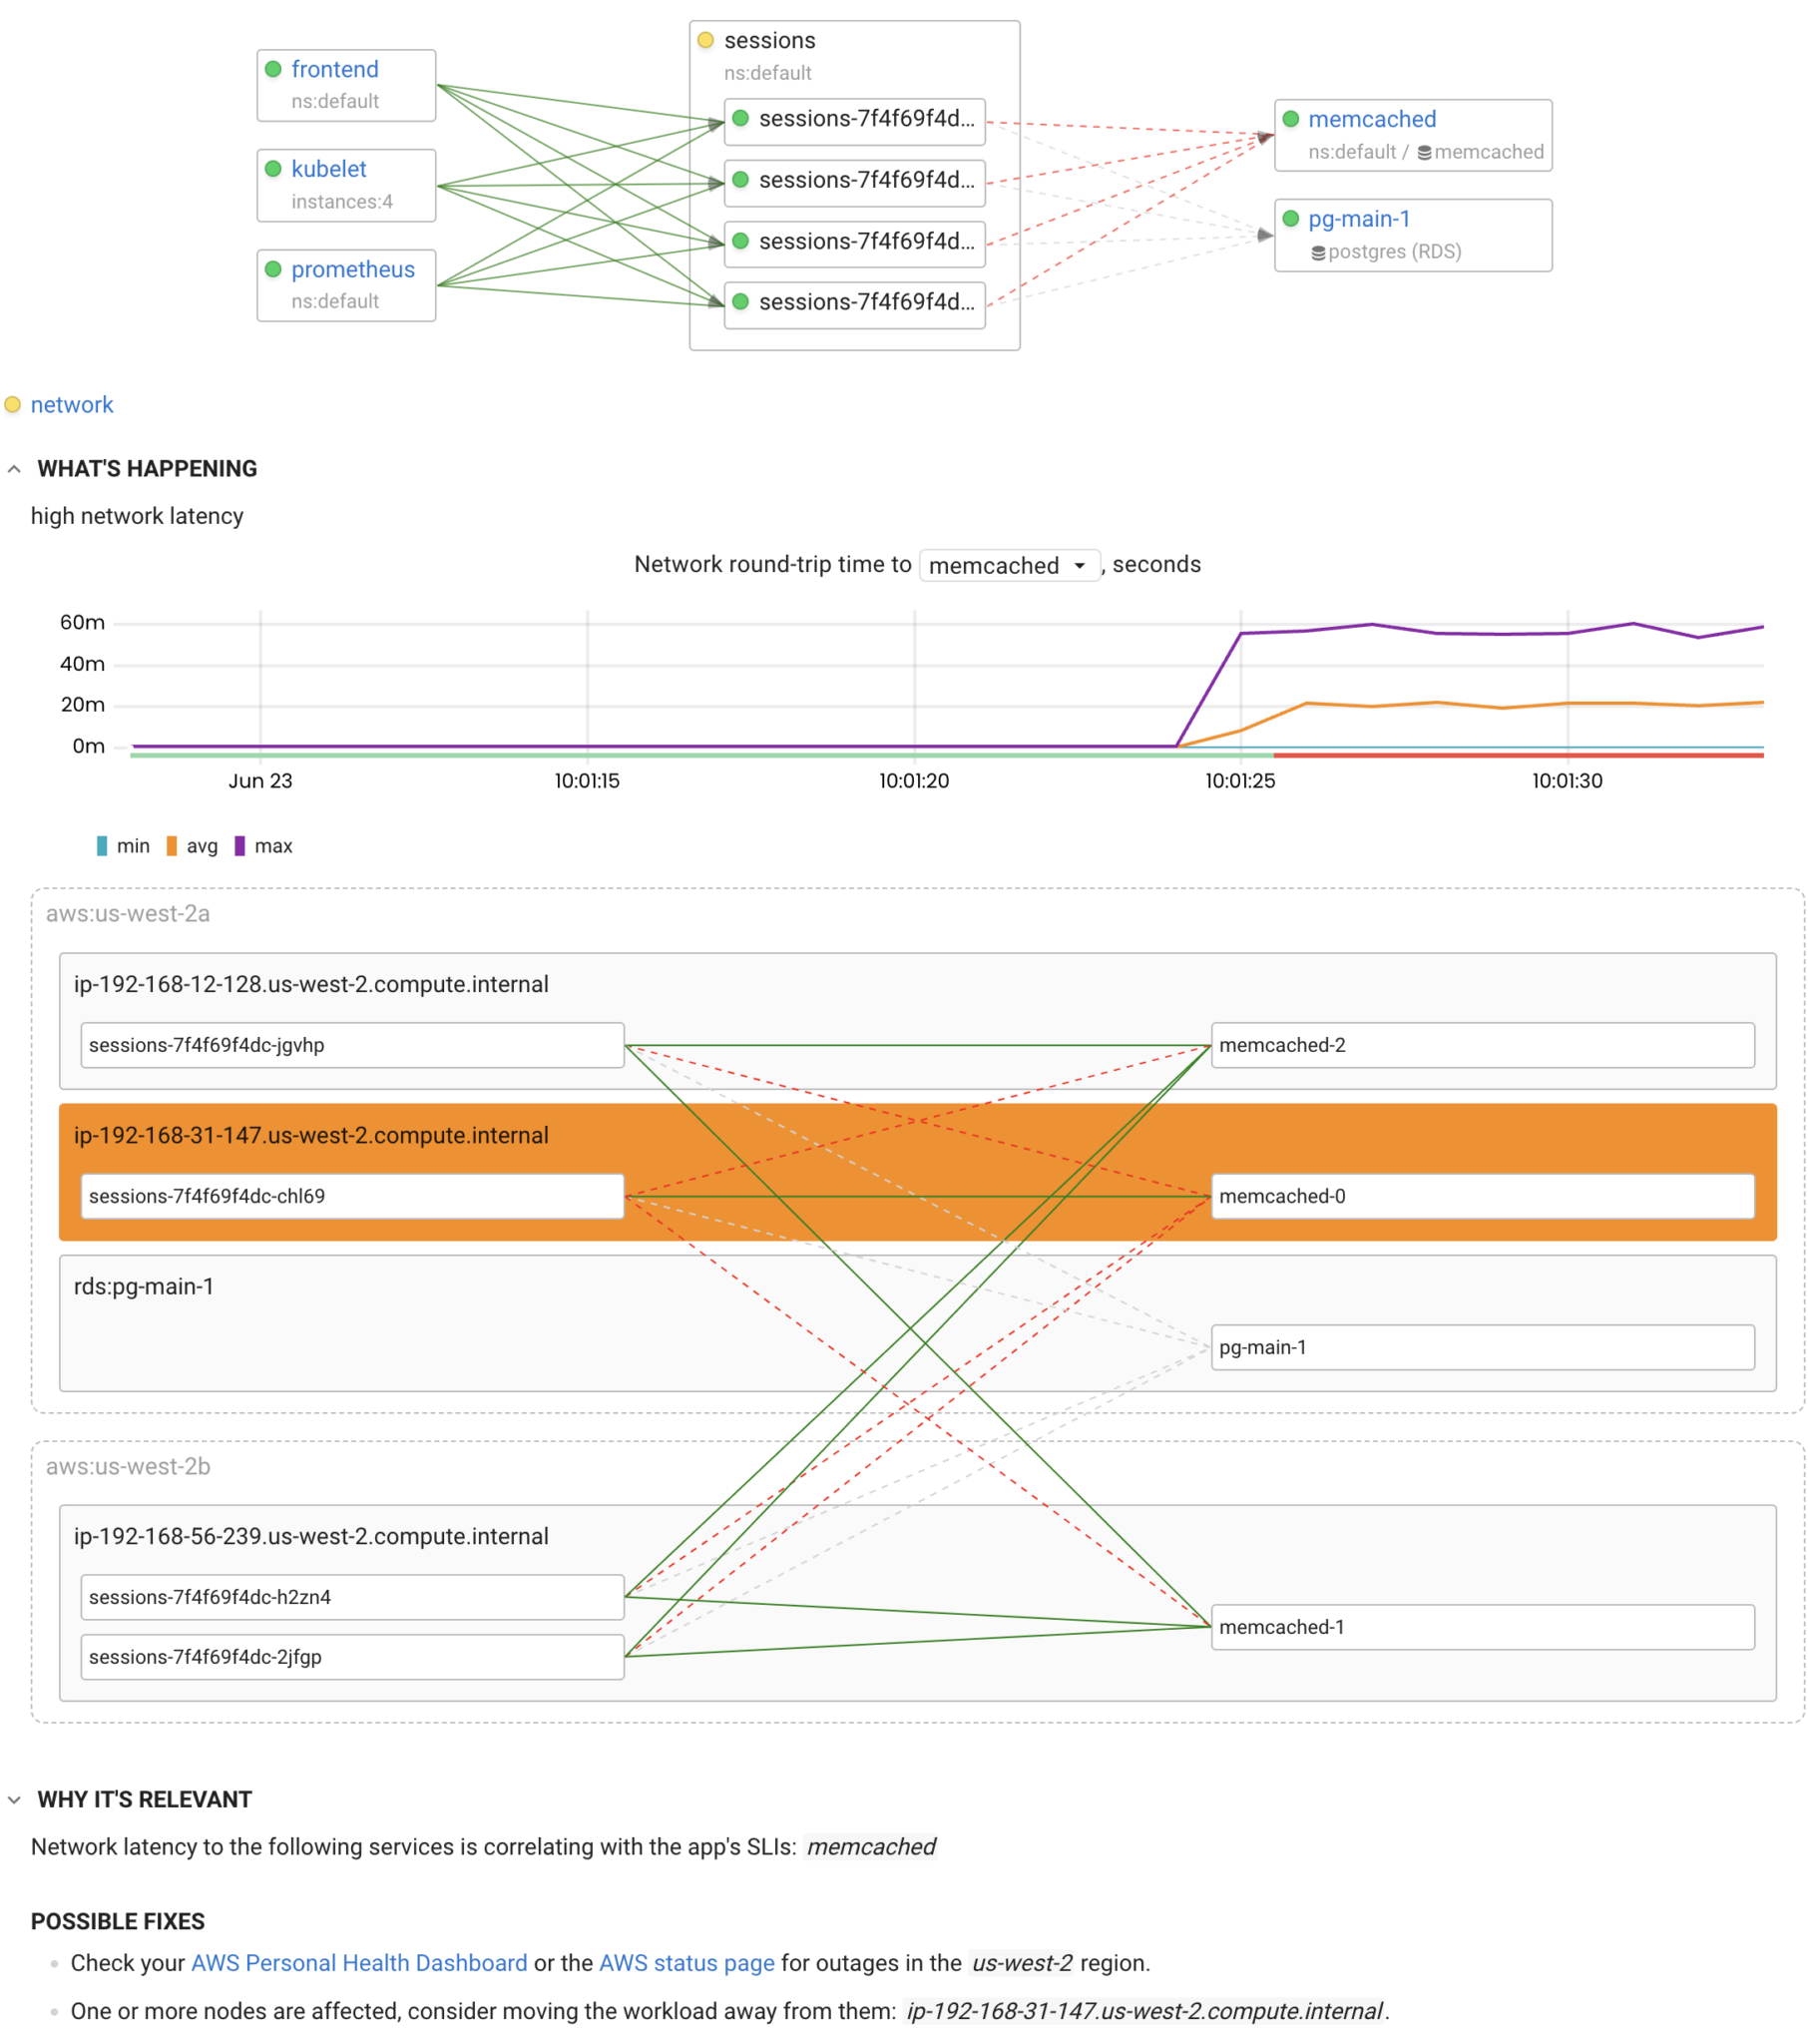
- Network: detects network issues, such as increased latency or packet loss.
- Postgres: identifies issues related to Postgres databases.
As a result, Coroot detects issues related to a particular application and its upstream services and databases.
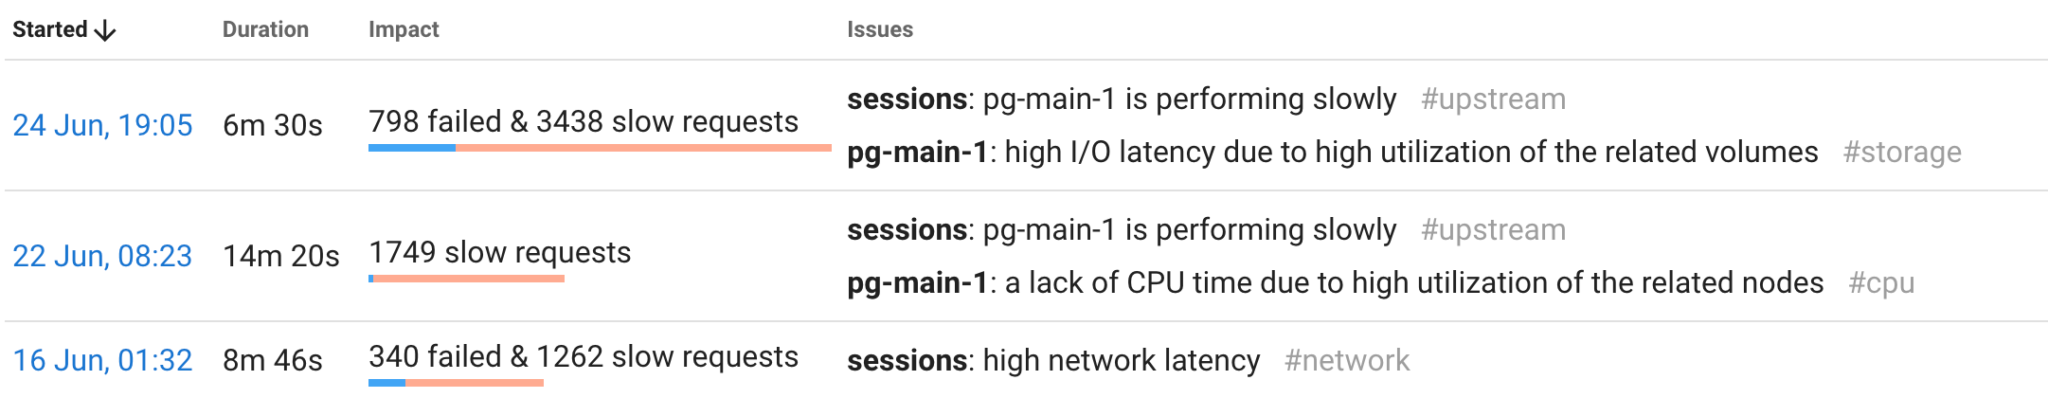
The main advantage of such automation is that it can verify hundreds of hypotheses regarding the root cause of an outage in just one second. So, most likely, by the time you are notified, the root cause of the incident will already have been detected. With the “Outage context” feature, you can drill down to a particular outage to view its details and possible fixes or cross-check with verbose data.
Alerting
The purpose of any alerting system is to notify a team of every significant service outage. However, it can be tricky to construct alert rules to only detect significant events.
No SLO can require 100% availability, because it is impossible to achieve. So, for instance, if we aim to enforce 99% of availability over 30 days, the service can fail 1% of requests without making its users unhappy. This 1% is called Error Budget. In other words, we can say that the main goal is not to overspend the error budget. Therefore, an outage is significant if the budget is being consumed too quickly.
Coroot’s SLO-based alerting uses the predefined multi-window burn rate thresholds:
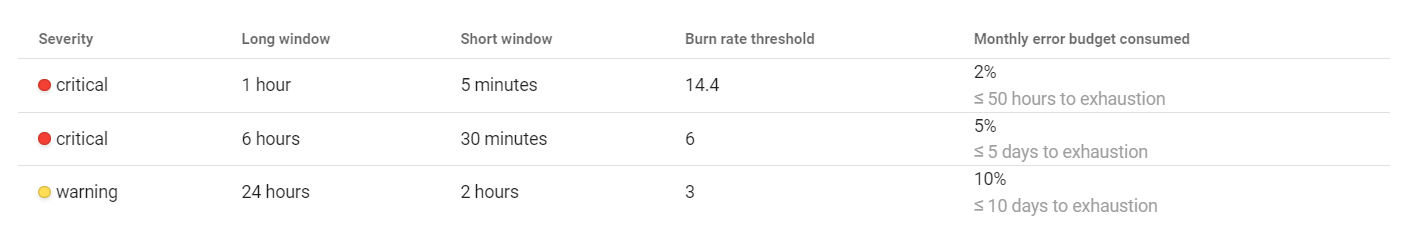
An alert will be fired if the error budget burn rate is greater than the threshold in both long and short windows. Checking in the short window makes sure that the error budget is still being consumed.
Conclusion
Using SLOs is a great way to define user expectations of service reliability for engineering teams. Coroot uses SLOs not only for alerting but also for automating incident intelligence. Accompanying each alert with the incident root cause allows our customers to reduce MTTD (Mean Time To Detect) to almost zero.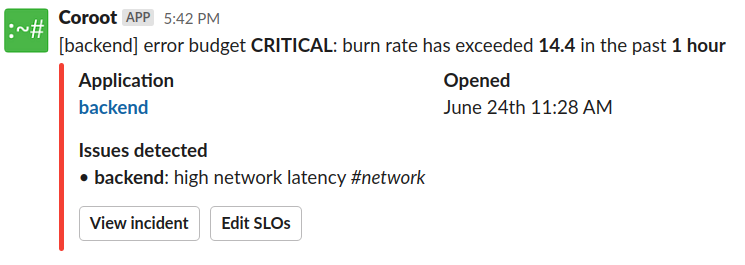
- Get started with Coroot
- Coroot live demo
- The detailed explanation of SLO-based alerting you can find in The SRE Workbook.