Using eBPF and predefined inspections to minimize 'observability tax'
 Nikolay Sivko
TL;DR
The process of making a system observable can be quite time-consuming and costly. To address this, we built Coroot — an open-source observability tool that enables users to get visibility into their systems in just a few minutes without any code changes. Coroot creates a digital model of each system and continuously audits every application using a set of predefined inspections based on industry best practices.
The problem
Observability is a critical aspect of any infrastructure, as it allows teams to identify and troubleshoot issues quickly. However, making a system observable is not without its costs. It’s quite a time- and resource-consuming process since it requires adding instrumentation into every application.
Let’s see what the integration of an APM (Applications Performance Monitoring) tool into a system looks like in practice:
- Integrate the appropriate APM SDK into each service
- Enable request tracing in every ORM, database/queue/http/grpc client that is being used
- Test and re-deploy every service
- Figure out which dashboards can be helpful in troubleshooting and configure them
- Define alerting rules for your metrics and/or traces to be notified when something goes wrong
My optimistic estimate is that it can take over 40 hours for an experienced engineer to instrument a system of 10 services. Keep in mind, however, that you will have to repeat most of these steps every time you run a new service. I think the term “observability tax” is particularly well-suited to describe the costs that companies have to incur in terms of time, resources, and effort if they want to maintain a high level of visibility into their infrastructures.
Additionally, it can be challenging to manually instrument all parts of a system due to the presence of third-party and legacy services. This can result in “blind spots” where certain parts of the system are not observable.
However, there is good news!
eBPF is revolutionizing security, networking, … and 🎉observability🎉
eBPF (extended Berkeley Packet Filter) is a game-changing technology that can eliminate the need to manually instrument application code. It allows users to attach custom programs to various parts of the Linux kernel, such as system calls, network functions, and tracepoints. Such eBPF programs can be used for a wide range of purposes, including networking, security, and observability.
For example, we can create an eBPF program that traces all HTTP requests made by a container, and this will be effective for any app running on the host, whether it is nginx, curl, or a Java application.
Given that the Linux kernel in most of its supported versions now offers at least minimal support for eBPF, we decided to create a real zero-instrumentation observability tool based on it.
Step #1: gathering telemetry data
Coroot-node-agent is a Prometheus exporter that is responsible for gathering metrics about all the containers that are running on a particular node. It uses eBPF for several purposes, such as:
- Container discovery: the agent traces the
task_newtaskandsched_process_exittracepoints to discover the containers that are running on a node - Tracing TCP connections: the
sys_connectandinet_sock_set_statetracepoints allow the agent to discover TCP connections and LISTEN sockets of the container - Tracing application layer protocol requests: the agent follows the
sys_write/writev/sendto andsys_read/readv/recvfrom tracepoints to trace the requests that the containers make to other services using application layer protocols such as HTTP, Postgres, and Redis.

Alongside eBPF-based metrics, node-agent also gathers:
- Log-based metrics: the agent discovers and parses unstructured container logs and extracts repeated patterns from them.
- Network latency: when the agent discovers an outbound TCP connection from a container, it starts to measure network RTT (Round-Trip Time) between this container and the destination IP address.
- Delay accounting metrics
- Cloud instance metadata
- JVM metrics
Step #2: getting a clear picture of a system
While it is important to collect the right metrics, it is equally important to have a way to analyze and interpret the data in order to gain insights.
We decided to build a separate tool because the built-in capabilities of Grafana, a popular open-source data visualization platform, were not sufficient for our needs. I’ll explain this by showing you Coroot in action, so you can evaluate whether or not it could have been implemented with Grafana.
I would like to highlight that only the following three commands were executed to integrate Coroot into the demo project, and no further configuration was required:
helm repo add coroot https://coroot.github.io/helm-charts
helm repo update
helm install --namespace coroot --create-namespace coroot coroot/coroot
… 2 minutes later
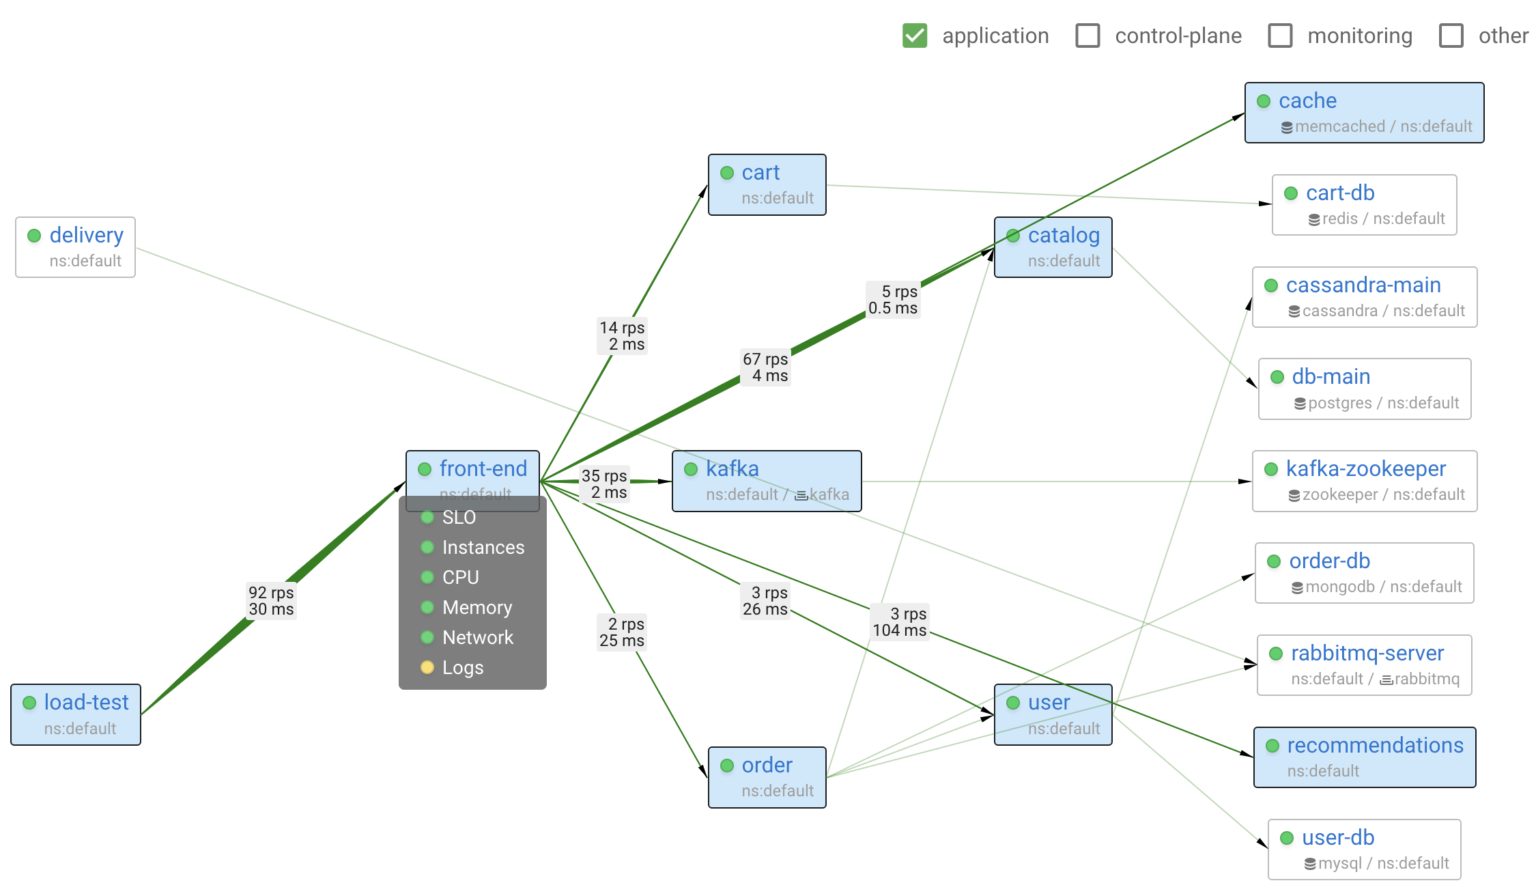
In the screenshot above, you can see a service map of the system. It shows all applications, databases, and how they communicate with each other. Moreover, you can quickly assess the status of each application and the status of their key subsystems.
Coroot comes with a set of predefined inspections which can identify most common issues within a system. These ready-to-use inspections need no additional configuration but can be easily adjusted, if necessary, for any application or an entire project.
- SLOs (Service Level Objectives): tracks the error rate and latency of every application and notifies you of any significant violation of the defined objectives
- Instances: detects when one or more instances of an app are unavailable or have been restarted
- CPU: identifies when an app is experiencing a lack of CPU time due to throttling or high CPU usage on the related nodes
- Memory: detects situations where an app’s containers have been terminated by the OOM (Out Of Memory) killer
- Storage: identifies when the performance of a storage volume is affecting the application
- Network: detects network issues, such as increased latency or connectivity loss
- Logs: audits log-based metrics and highlights the errors
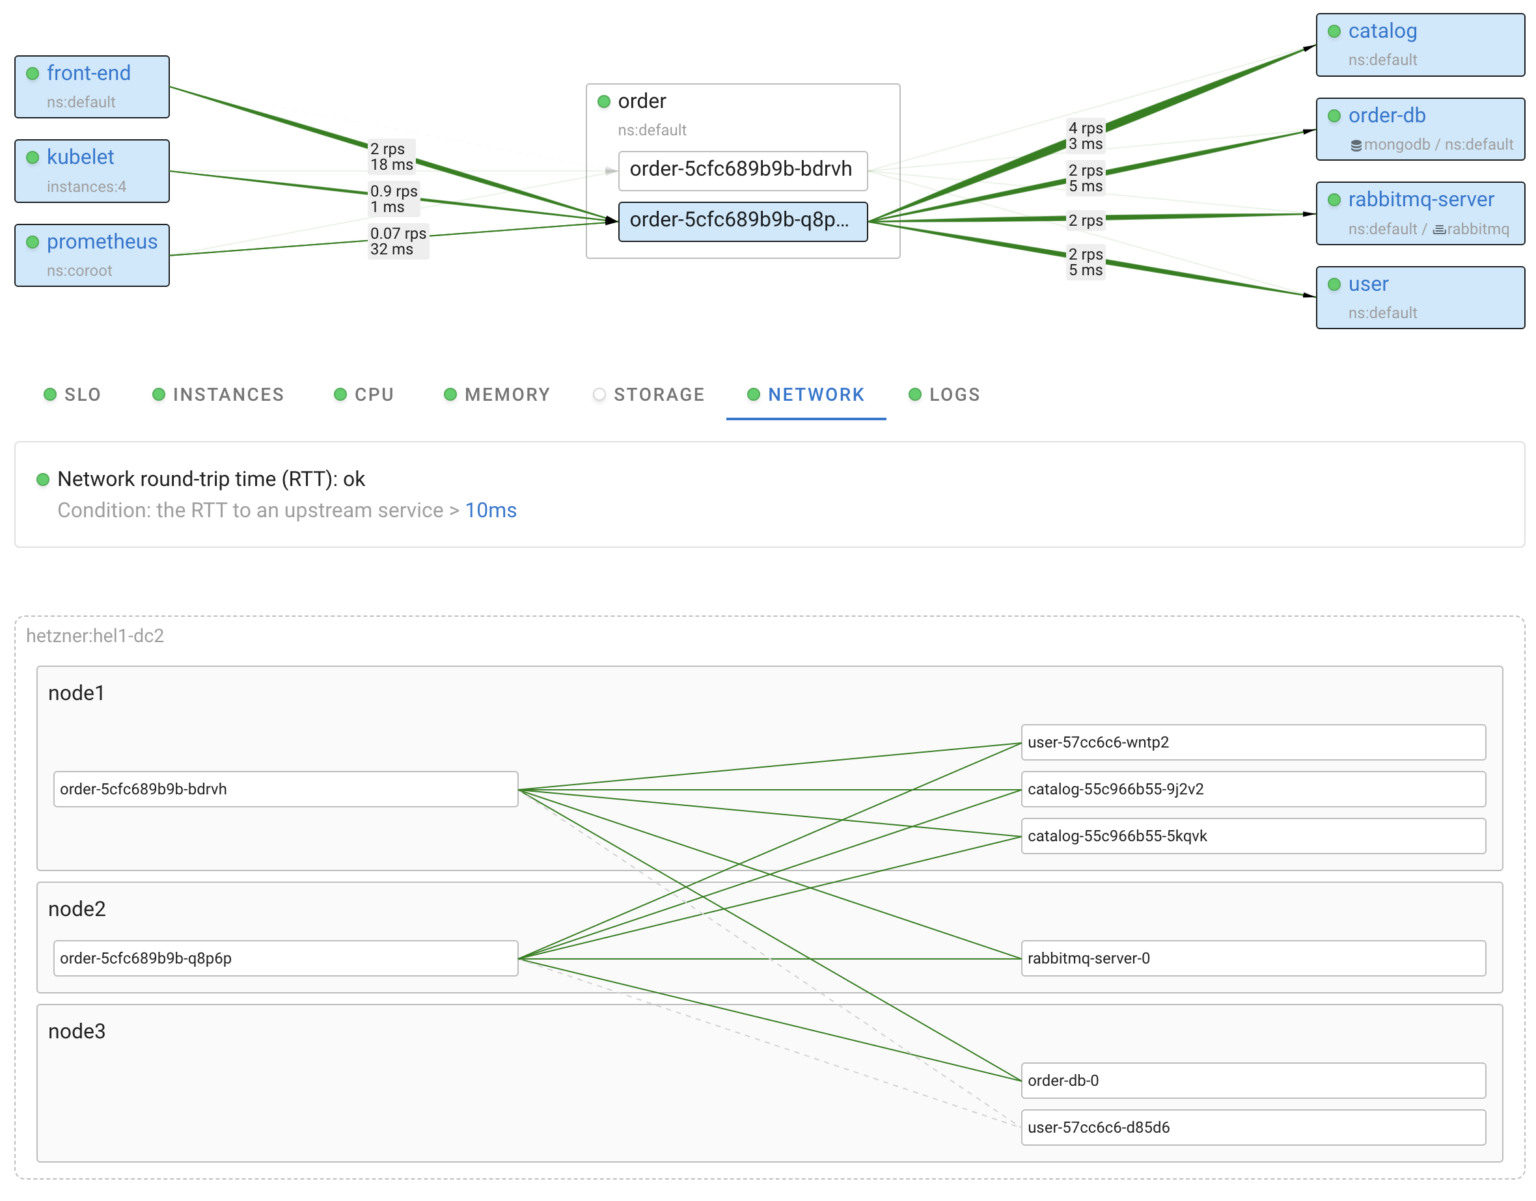
To effectively troubleshoot an issue with a particular service, it is essential to have all relevant information about it in one place. Coroot simplifies this process by providing automatically generated dashboards for each application, allowing you to focus on any given app.
As you can see above, each dashboard has a status, so you can quickly check if there are any issues without having to open them.
Step #3: rethinking alerting
Conventional alerting systems often suffer from a lack of context, as each alerting rule may only consider a single aspect of the system without considering the system as a whole.
There are two main types of alerts:
- Symptom-based alerts identify issues that affect users of a service, such as when an application fails to meet its Service Level Objectives (SLOs)
- Cause-based (auxiliary) alerts help in root cause analysis and detect issues, such as network connectivity issues or high CPU usage on a node
In practice, users often receive both types of alerts at the same time and must manually try to connect symptoms to possible causes. This can be particularly difficult when managing a complex system. Many services attempt to identify correlations between alerts, but most of them can only group alerts that occur around the same time without understanding the nature of these events.
We decided to approach the problem from a different perspective.
Coroot builds a model of each system, including all applications, their instances, related nodes, and links between services. With this model, Coroot is able to perform all inspections in the single context of a specific application. Therefore, if an application is not meeting its service level objectives, Coroot will send a single alert that includes the results of all relevant inspections.
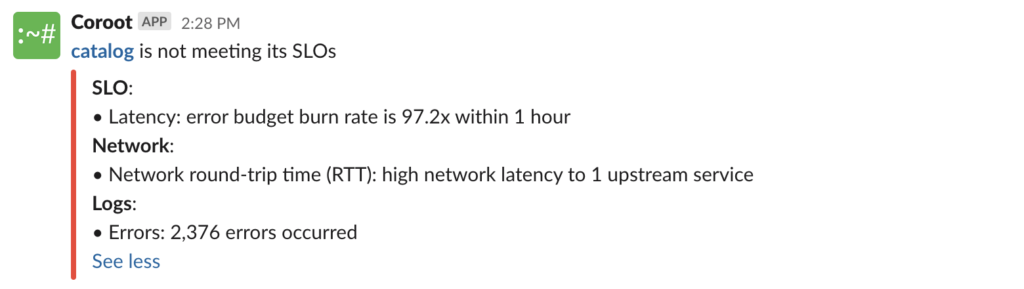
This approach also eliminates false positives, as no alerts are sent when all SLOs are met.
Conclusion
We built Coroot because we believe it is unreasonable that it requires such a significant amount of effort to make systems observable. Our goal is to enable engineers to obtain the visibility they need to understand and troubleshoot their systems without the need to become experts in this area.
Follow the instructions on our Getting started page to try Coroot now. Not ready to Get started with Coroot? Check out our live demo.
If you like Coroot, give us a ⭐ on GitHub️ or share your experience on G2.
Any questions or feedback? Reach out to us on Slack.