OpenTelemetry for Go: measuring the overhead
 Nikolay Sivko
Everything comes at a cost — and observability is no exception. When we add metrics, logging, or distributed tracing to our applications, it helps us understand what’s going on with performance and key UX metrics like success rate and latency. But what’s the cost?
I’m not talking about the price of observability tools here, I mean the instrumentation overhead. If an application logs or traces everything it does, that’s bound to slow it down or at least increase resource consumption. Of course, that doesn’t mean we should give up on observability. But it does mean we should measure the overhead so we can make informed tradeoffs.
These days, when people talk about instrumenting applications, in 99% of cases they mean OpenTelemetry. OpenTelemetry is a vendor-neutral open source framework for collecting telemetry data from your app such as metrics, logs, and traces. It’s quickly become the industry standard.
In this post, I want to measure the overhead of using OpenTelemetry in a Go application. To do that, I’ll use a super simple Go HTTP server that increments a counter in an in-memory database Valkey (a Redis fork) on every request. The idea behind the benchmark is straightforward:
- First, we’ll run the app under load without any instrumentation and measure its performance and resource usage.
- Then, using the exact same workload, we’ll repeat the test with OpenTelemetry SDK for Go enabled and compare the results.
Test setup
For this benchmark, I’ll use four Linux nodes, each with 4 vCPUs and 8GB of RAM. One will run the application, another will host Valkey, a third will be used for the load generator, and the fourth for observability (using Coroot Community Edition).

I want to make sure the components involved in the test don’t interfere with each other, so I’m running them on separate nodes. This time, I’m not using Kubernetes, instead, I’ll run everything in plain Docker containers. I’m also using the host network mode for all containers, to avoid docker-proxy introducing any additional latency into the network path.
Now, let’s take a look at the application code:
package main

import (
	"context"
	"log"
	"net/http"
	"os"
	"strconv"

	"github.com/go-redis/redis/extra/redisotel"
	"github.com/go-redis/redis/v8"

	"go.opentelemetry.io/contrib/instrumentation/net/http/otelhttp"
	"go.opentelemetry.io/otel"
	"go.opentelemetry.io/otel/exporters/otlp/otlptrace"
	"go.opentelemetry.io/otel/exporters/otlp/otlptrace/otlptracehttp"
	"go.opentelemetry.io/otel/propagation"
	"go.opentelemetry.io/otel/sdk/trace"
)

var (
	rdb *redis.Client
)

func initTracing() {
	rdb.AddHook(redisotel.TracingHook{})
	client := otlptracehttp.NewClient()
	exporter, err := otlptrace.New(context.Background(), client)
	if err != nil {
		log.Fatal(err)
	}
	tracerProvider := trace.NewTracerProvider(trace.WithBatcher(exporter))
	otel.SetTracerProvider(tracerProvider)
	otel.SetTextMapPropagator(propagation.NewCompositeTextMapPropagator(
		propagation.TraceContext{},
		propagation.Baggage{},
	))
}

func handler(w http.ResponseWriter, r *http.Request) {
	cmd := rdb.Incr(r.Context(), "counter")
	if err := cmd.Err(); err != nil {
		http.Error(w, err.Error(), http.StatusInternalServerError)
		return
	}
	_, _ = w.Write([]byte(strconv.FormatInt(cmd.Val(), 10)))
}

func main() {
	rdb = redis.NewClient(&redis.Options{Addr: os.Getenv("REDIS_SERVER")})
	h := http.Handler(http.HandlerFunc(handler))
	if os.Getenv("ENABLE_OTEL") != "" {
		log.Println("enabling opentelemetry")
		initTracing()
		h = otelhttp.NewHandler(http.HandlerFunc(handler), "GET /")
	}
	log.Fatal(http.ListenAndServe(":8080", h))
}
By default, the application runs without instrumentation. Only if the environment variable ENABLE_OTEL is set, the OpenTelemetry SDK will be initialized. So runs without this variable will serve as the baseline for comparison.
Running the Benchmark
Now let’s start all the components and begin testing.
First, we launch Valkey using the following command:
docker run --name valkey -d --net=host valkey/valkey
Next, we start the Go app and point it to the Valkey instance by IP:
docker run -d --name app -e REDIS_SERVER="192.168.1.2:6379" --net=host failurepedia/redis-app:0.5
To generate load, I’ll use wrk2, which allows precise control over request rate. In this test, I’m setting it to 10,000 requests per second using 100 connections and 8 threads. Each run will last 20 minutes:
docker run --rm --name load-generator -ti cylab/wrk2 \
   -t8 -c100 -d1200s -R10000 --u_latency http://192.168.1.3:8080/
Results
Let’s take a look at the results.
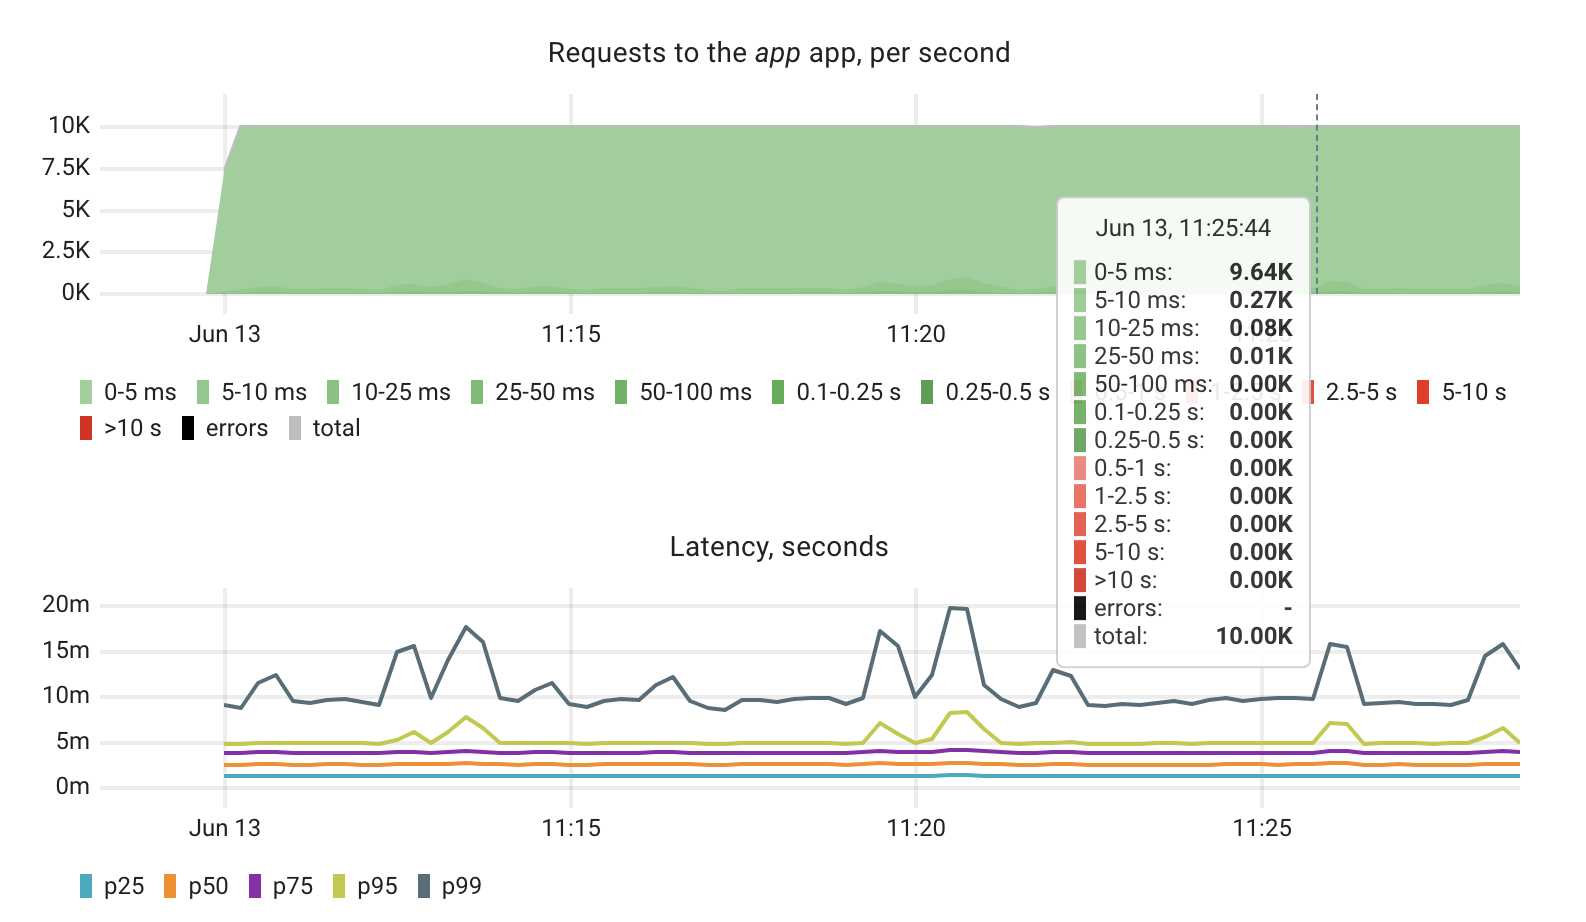
We started by running the app without any instrumentation. This serves as our baseline for performance and resource usage. Based on metrics gathered by Coroot using eBPF, the app successfully handled 10,000 requests per second. The majority of requests were served in under 5 milliseconds. The 95th percentile (p95) latency was around 5ms, the 99th percentile (p99) was about 10ms, with occasional spikes reaching up to 20ms.
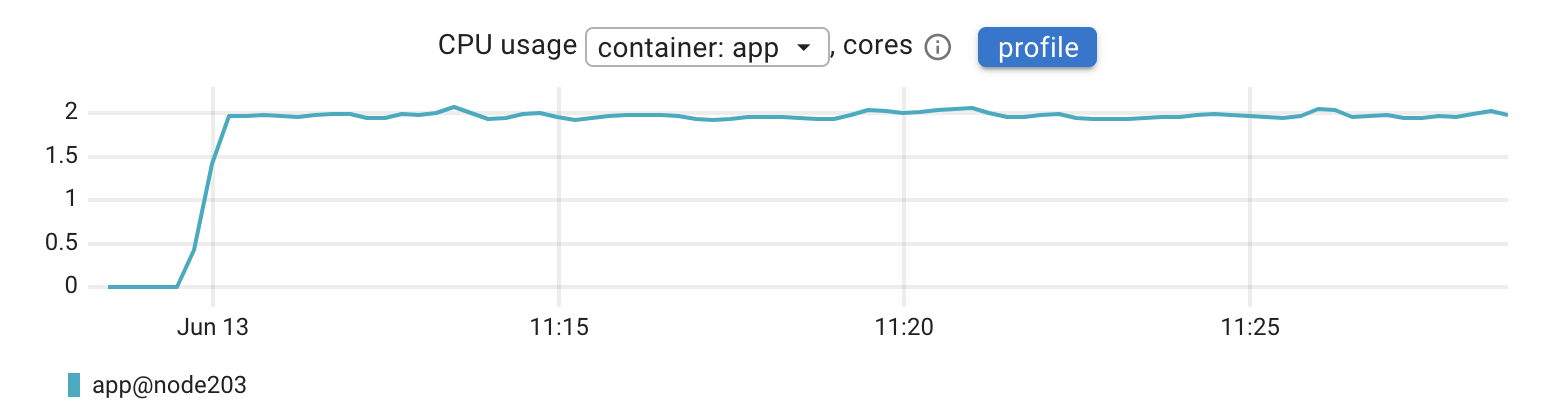
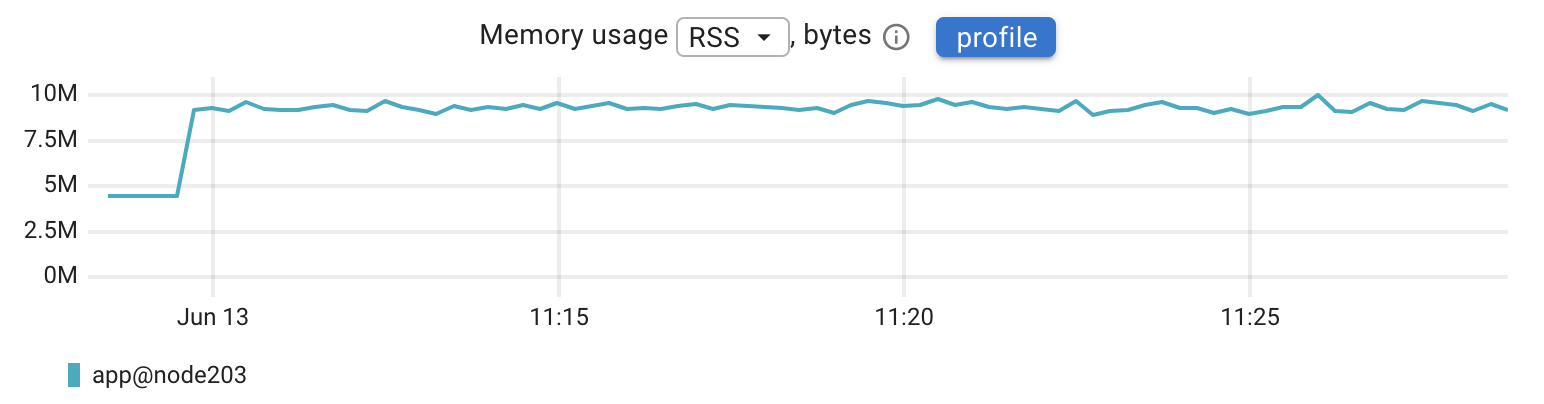
CPU usage was steady at around 2 CPU cores (or 2 CPU seconds per second), and memory consumption stayed low at roughly 10 MB.
So that’s our baseline. Now, let’s restart the app container with the OpenTelemetry SDK enabled and see how things change:
docker run -d --name app \
  -e REDIS_SERVER="192.168.1.2:6379" \
  -e ENABLE_OTEL=1 \
  -e OTEL_SERVICE_NAME="app" \
  -e OTEL_EXPORTER_OTLP_TRACES_ENDPOINT="http://192.168.1.4:8080/v1/traces" \
  --net=host failurepedia/redis-app:0.5
Everything else stayed the same – the infrastructure, the workload, and the duration of the test.
Now let’s break down what changed.
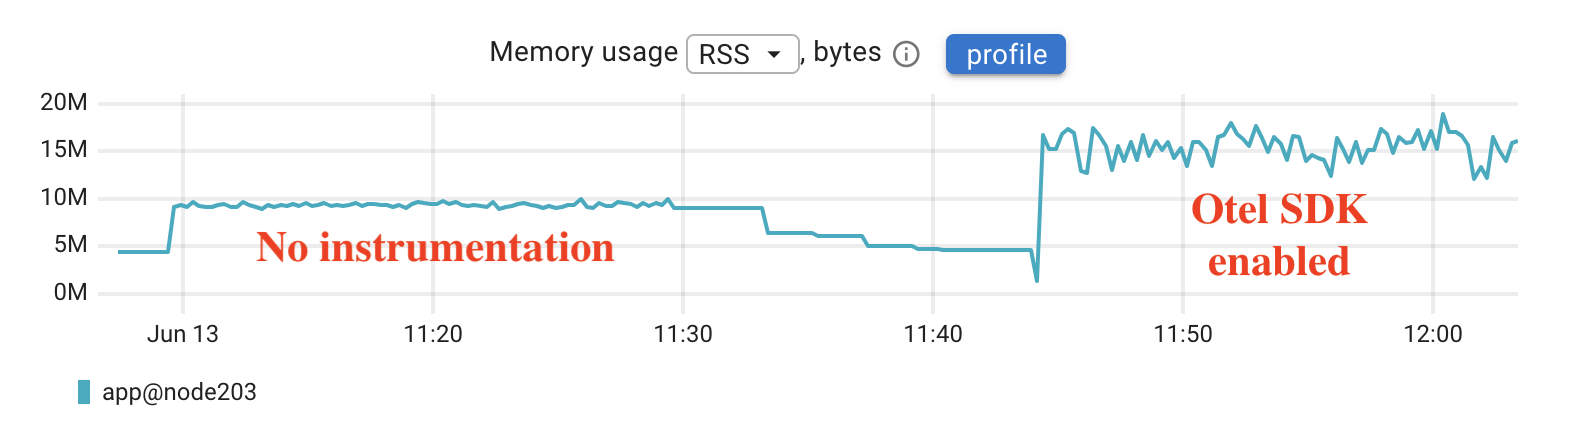
Memory usage increased from around 10 megabytes to somewhere between 15 and 18 megabytes. This additional overhead comes from the SDK and its background processes for handling telemetry data. While there is a clear difference, it doesn’t look like a significant increase in absolute terms, especially for modern applications where memory budgets are typically much larger.
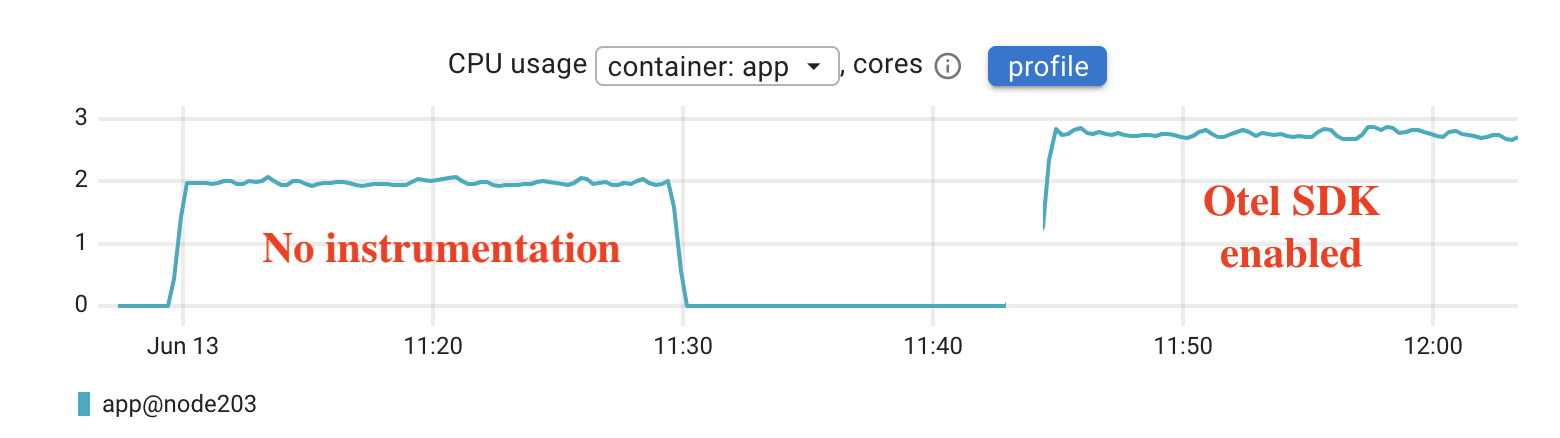
CPU usage jumped from 2 cores to roughly 2.7 cores. That’s about a 35 percent increase. This is expected since the app is now tracing every request, preparing and exporting spans, and doing more work in the background.
To understand exactly where this additional CPU usage was coming from, I used Coroot’s built-in eBPF-based CPU profiler to capture and compare profiles before and after enabling OpenTelemetry.
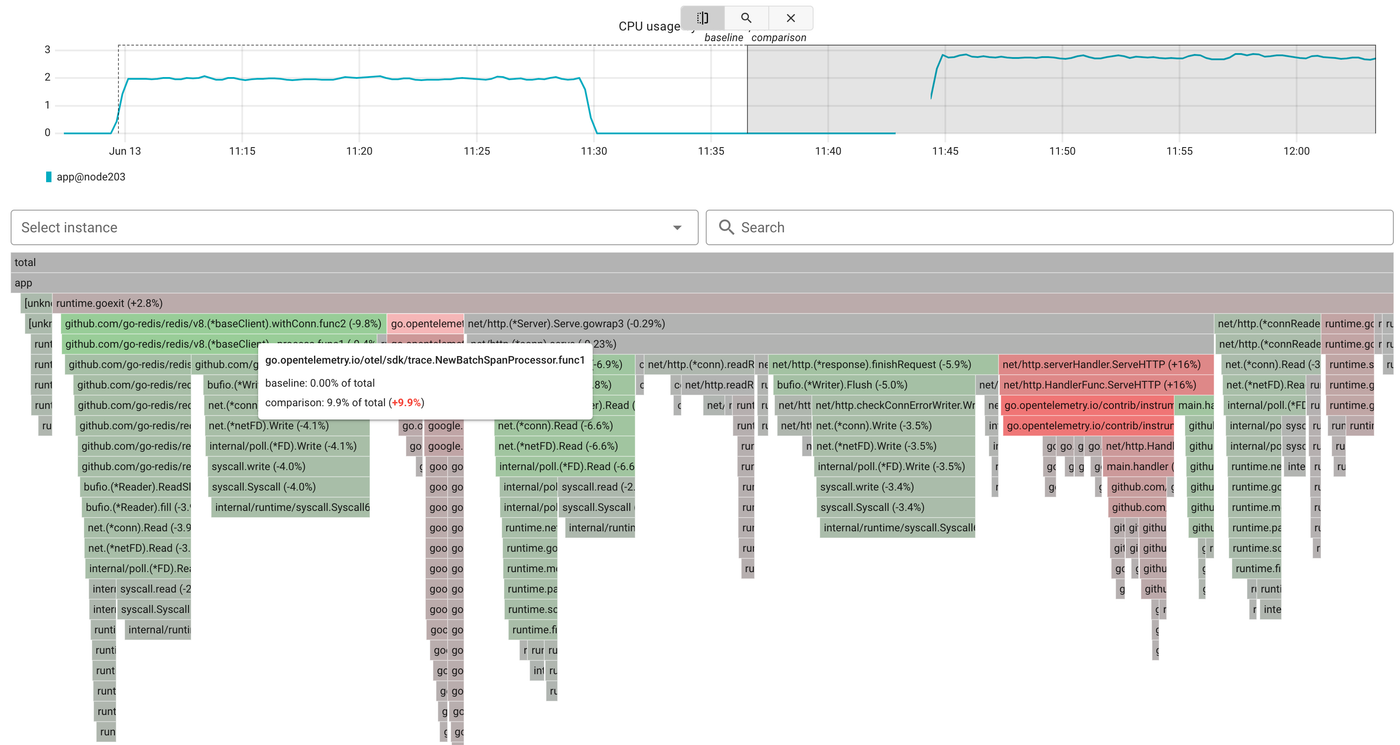
The profiler showed that about 10 percent of total CPU time was spent in go.opentelemetry.io/otel/sdk/trace.NewBatchSpanProcessor, which handles span batching and export. Redis calls also got slightly more expensive — tracing added around 7 percent CPU overhead to go-redis operations. The rest of the increase came from instrumented HTTP handlers and middleware.
In short, the overhead comes from OpenTelemetry’s span processing pipeline, not from the app’s core logic.
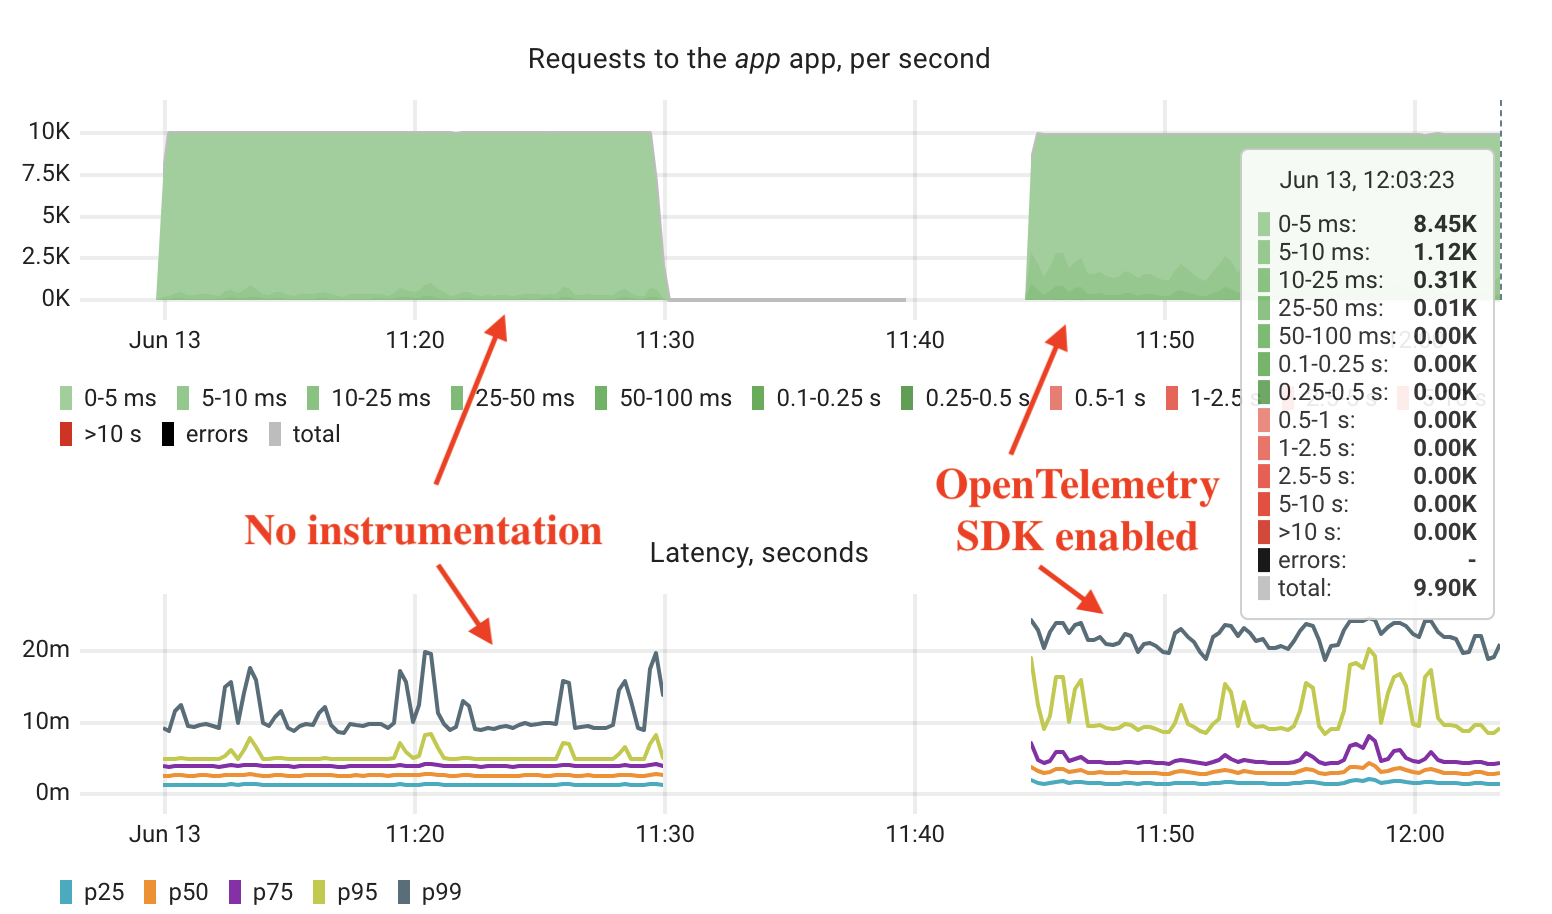
Latency also changed, though not dramatically. With OpenTelemetry enabled, more requests fell into the 5 to 10 millisecond range. The 99th percentile latency went from 10 to about 15 milliseconds. Throughput remained stable at around 10,000 requests per second. We didn’t see any errors or timeouts.
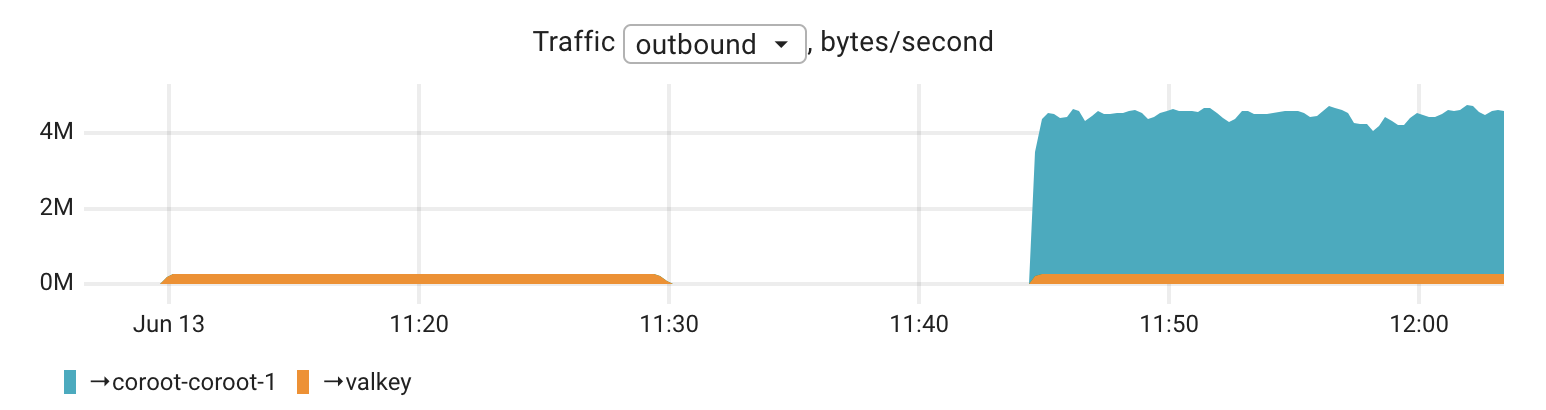
Network traffic also increased. With tracing enabled, the app started exporting telemetry data to Coroot, which resulted in an outbound traffic volume of about 4 megabytes per second, or roughly 32 megabits per second. For high-throughput services or environments with strict network constraints, this is something to keep in mind when enabling full request-level tracing.
Overall, enabling OpenTelemetry introduced a noticeable but controlled overhead. These numbers aren’t negligible, especially at scale — but they’re also not a dealbreaker. For most teams, the visibility gained through distributed tracing and the ability to troubleshoot issues faster will justify the tradeoff.
eBPF-based instrumentation
I often hear from engineers, especially in ad tech and other high-throughput environments, that they simply can’t afford the overhead of distributed tracing. At the same time, observability is absolutely critical for them. This is exactly the kind of scenario where eBPF-based instrumentation fits well.
Instead of modifying application code or adding SDKs, an agent can observe application behavior at the kernel level using eBPF. Coroot’s agent supports this approach and is capable of collecting both metrics and traces using eBPF, without requiring any changes to the application itself.
However, in high-load environments like the one used in this benchmark, we generally recommend disabling eBPF-based tracing and working with metrics only. Metrics still allow us to clearly see how services interact with each other, without storing data about every single request. They’re also much more efficient in terms of storage and runtime overhead.
Throughout both runs of our test, Coroot’s agent was running on each node. Here’s what its CPU usage looked like:
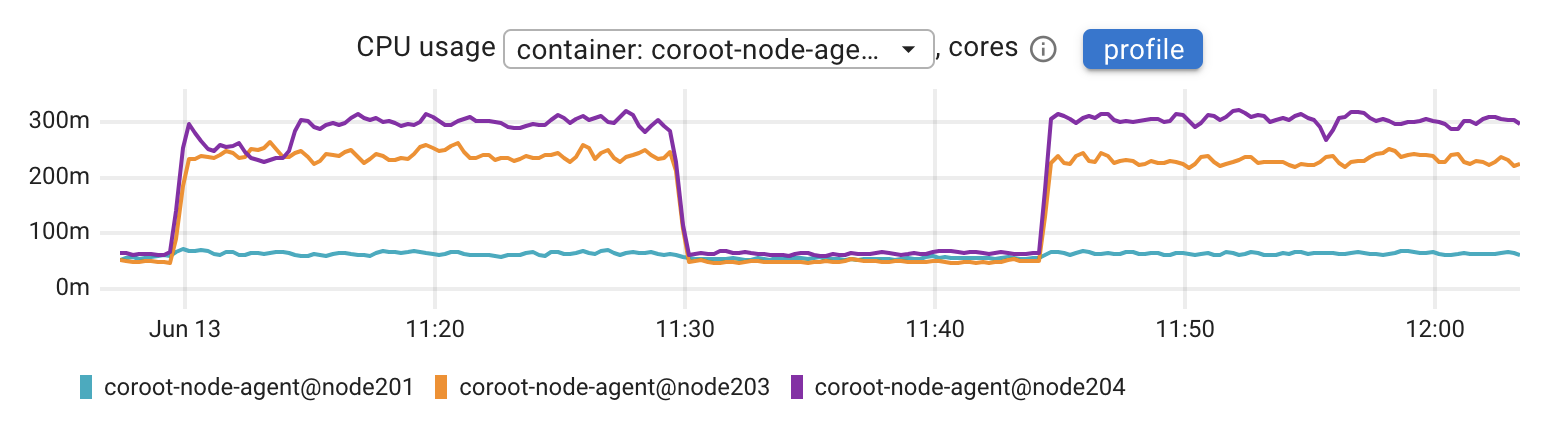
Node201 was running Valkey, node203 was running the app, and node204 was the load generator. As the chart shows, even under consistent load, the agent’s CPU usage stayed under 0.3 cores. That makes it lightweight enough for production use, especially when working in metrics-only mode.
This approach offers a practical balance: good visibility with minimal cost.
Final Thoughts
Observability comes at a cost, but as this experiment shows, that cost depends heavily on how you choose to implement it.
OpenTelemetry SDKs provide detailed traces and deep visibility, but they also introduce measurable overhead in terms of CPU, memory, and network traffic. For many teams, especially when fast incident resolution is a priority, that tradeoff is entirely justified.
At the same time, eBPF-based instrumentation offers a more lightweight option. It allows you to collect meaningful metrics without modifying application code and keeps resource usage minimal, especially when tracing is disabled and only metrics are collected.
The right choice depends on your goals. If you need full traceability and detailed diagnostics, SDK-based tracing is a strong option. If your priority is low overhead and broad system visibility, eBPF-based metrics might be the better fit.
Observability isn’t free, but with the right approach, it can be both effective and efficient.