We’re excited to announce the release of Coroot v1.4!
Along with various UI improvements, this update brings a new feature: network traffic monitoring. Now, you can easily see how much data is being transferred between your applications and, more importantly, how much it costs.
Let’s dive into the details. In this post, we’ll explore the enhancements and new features included in this release.
Application traffic
Most of Coroot’s features start with gathering telemetry data, and this new feature is no exception. Before this release, Coroot already had extensive knowledge about application communications:
- DNS: status, latency
- TCP connections: status, connection time, TCP retransmissions
- Network latency: round-trip time (RTT)
- Application-level protocols: statuses, latency
However, it lacked information on the amount of data transferred between applications. There were two main reasons for this. Firstly, bandwidth-related issues typically only arise in extremely high-load systems, so we initially focused on detecting more common network failure scenarios. Secondly, collecting such data at the eBPF level is quite challenging.
In the end, we discovered a reliable method to count both inbound and outbound traffic for each TCP connection without adding significant overhead using eBPF. But our approach has a number of limitations that will be useful to be aware of:
- Coroot’s agent counts only traffic within TCP connections, so UDP traffic is not taken into account
- The metrics reflect only the TCP payload size and don’t include TCP and IP headers. This may lead to a 2-4% underestimation of actual traffic
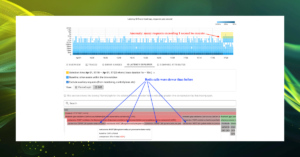
Now using the gathered metrics, Coroot can show traffic between any services on the Service Map:
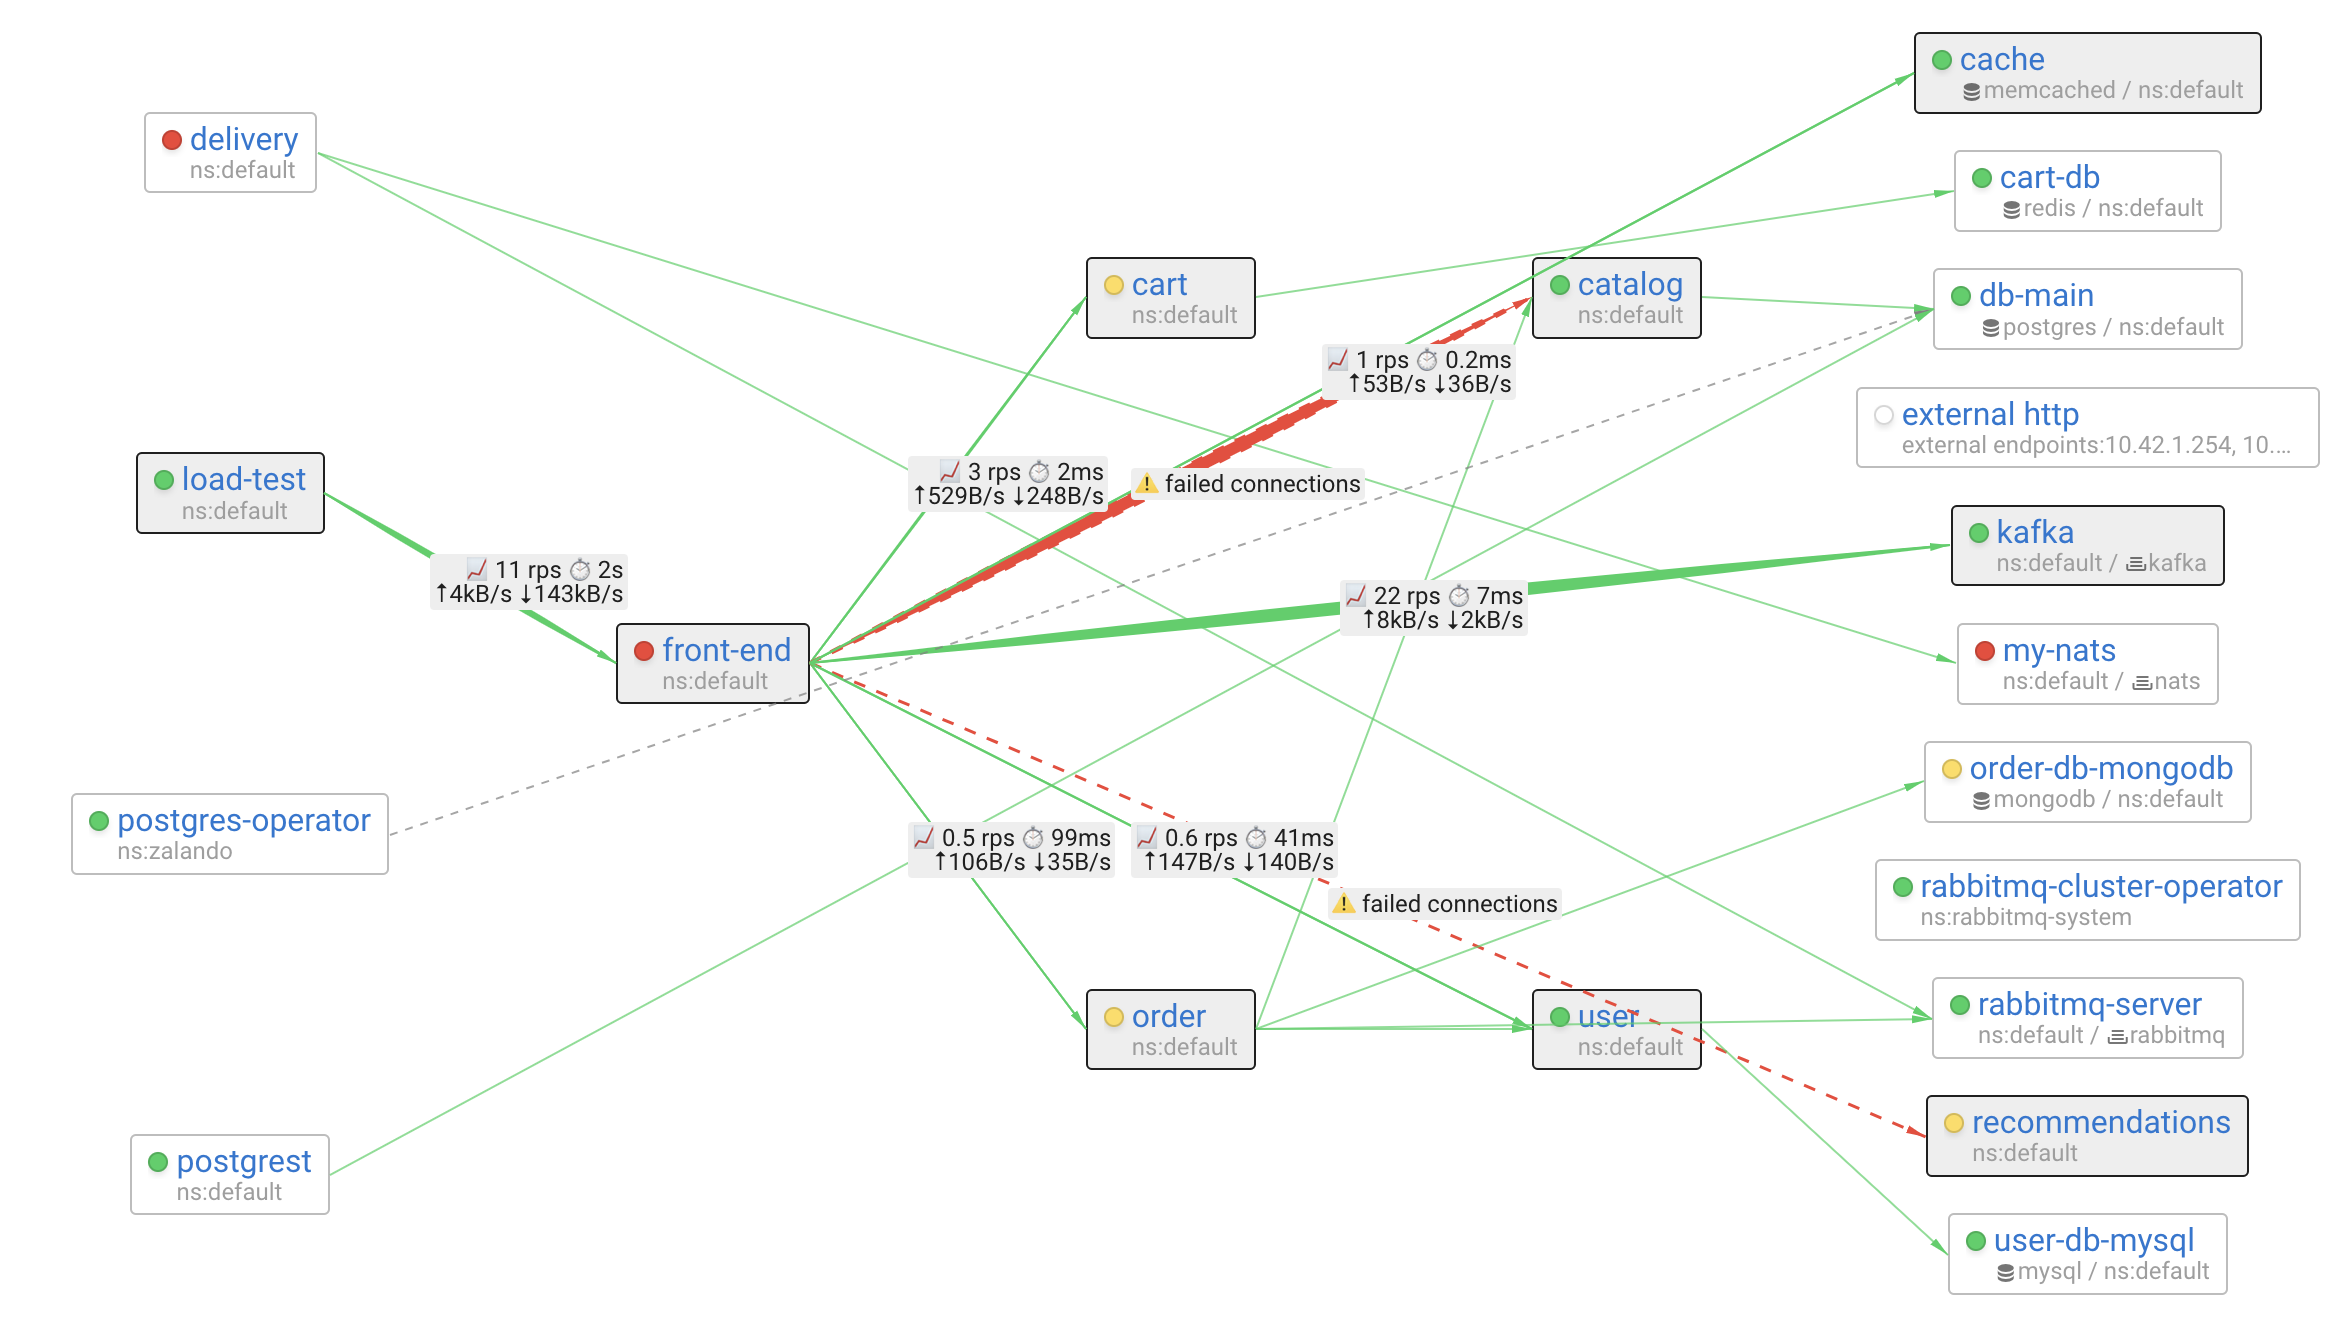
The network metrics on the Service Map are aggregated by application pairs. However, when you look at a specific application, you can see detailed instance-to-instance metrics:
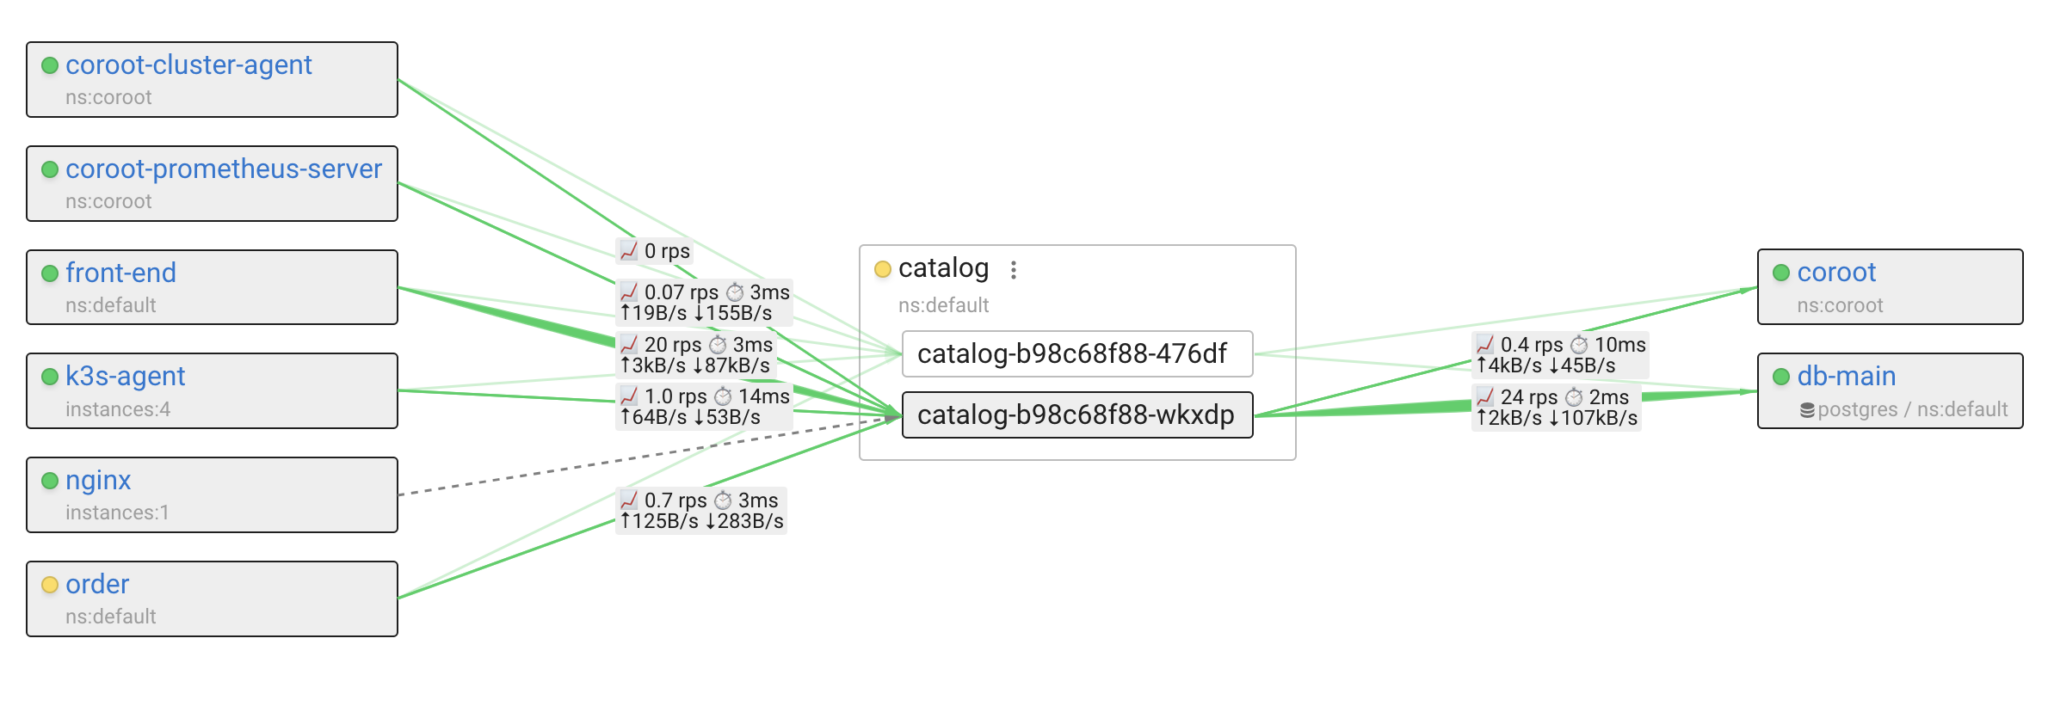
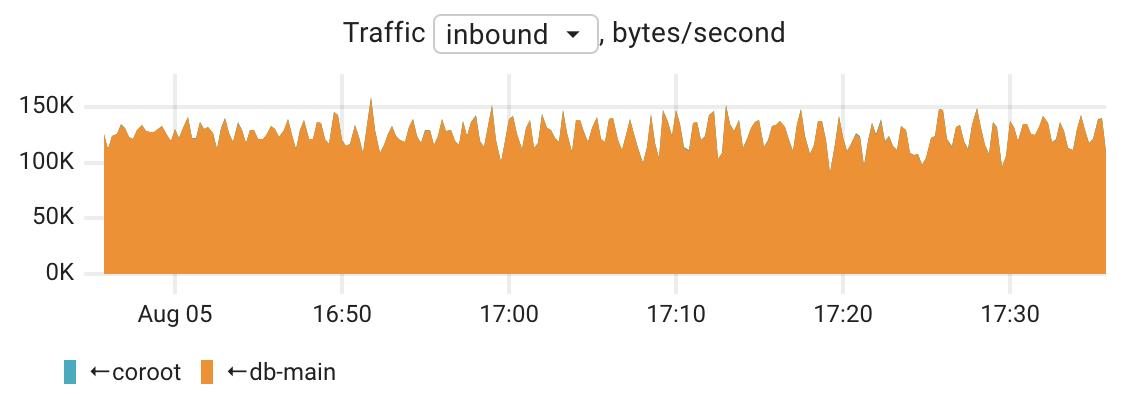
To track application-to-application traffic over time, we added a chart to the Network inspection report:
Data transfer costs
Anyone who runs applications in the cloud knows that computing (VM) costs are just the tip of the iceberg. For instance, if you operate a highly available application across multiple availability zones and replicate data between them, you’ll incur charges for data transfers even within the same region. In fact, data transfer costs between applications and to the internet can easily make up more than 30% of your cloud bill.
At Coroot, we believe that FinOps is an essential part of observability. To truly understand your cloud costs, you need to analyze application-level metrics. However, cloud providers typically only offer IP-to-IP breakdowns for data transfer costs. Coroot overcomes this by building a comprehensive model of your system, translating low-level statistics into application-to-application metrics, making them more understandable for engineers.
Let me explain, how Coroot uses models of distributed systems with an example:
- Coroot knows that the container catalog-123 on node1 communicates with 192.168.1.1:5432.
- It also knows that the container pg-main-1 on node2 is listening on 192.168.1.1:5432
- Using cloud metadata, Coroot identifies that node1 is in us-east-1a and node2 is in us-east-1c in AWS.
- AWS charges $0.01 per GB for data transfer between these zones in both directions, so 1GB sent from one zone to another will cost $0.02 (half for sending and half for receiving)
- So, if catalog-123 sent 1TB and received 10TB from pg-main-1, the cost would be (1 * 1000 * 0.02) + (10 * 1000 * 0.02) = $220.
Having all that data allows Coroot to show you the costs of communication between any specific services.
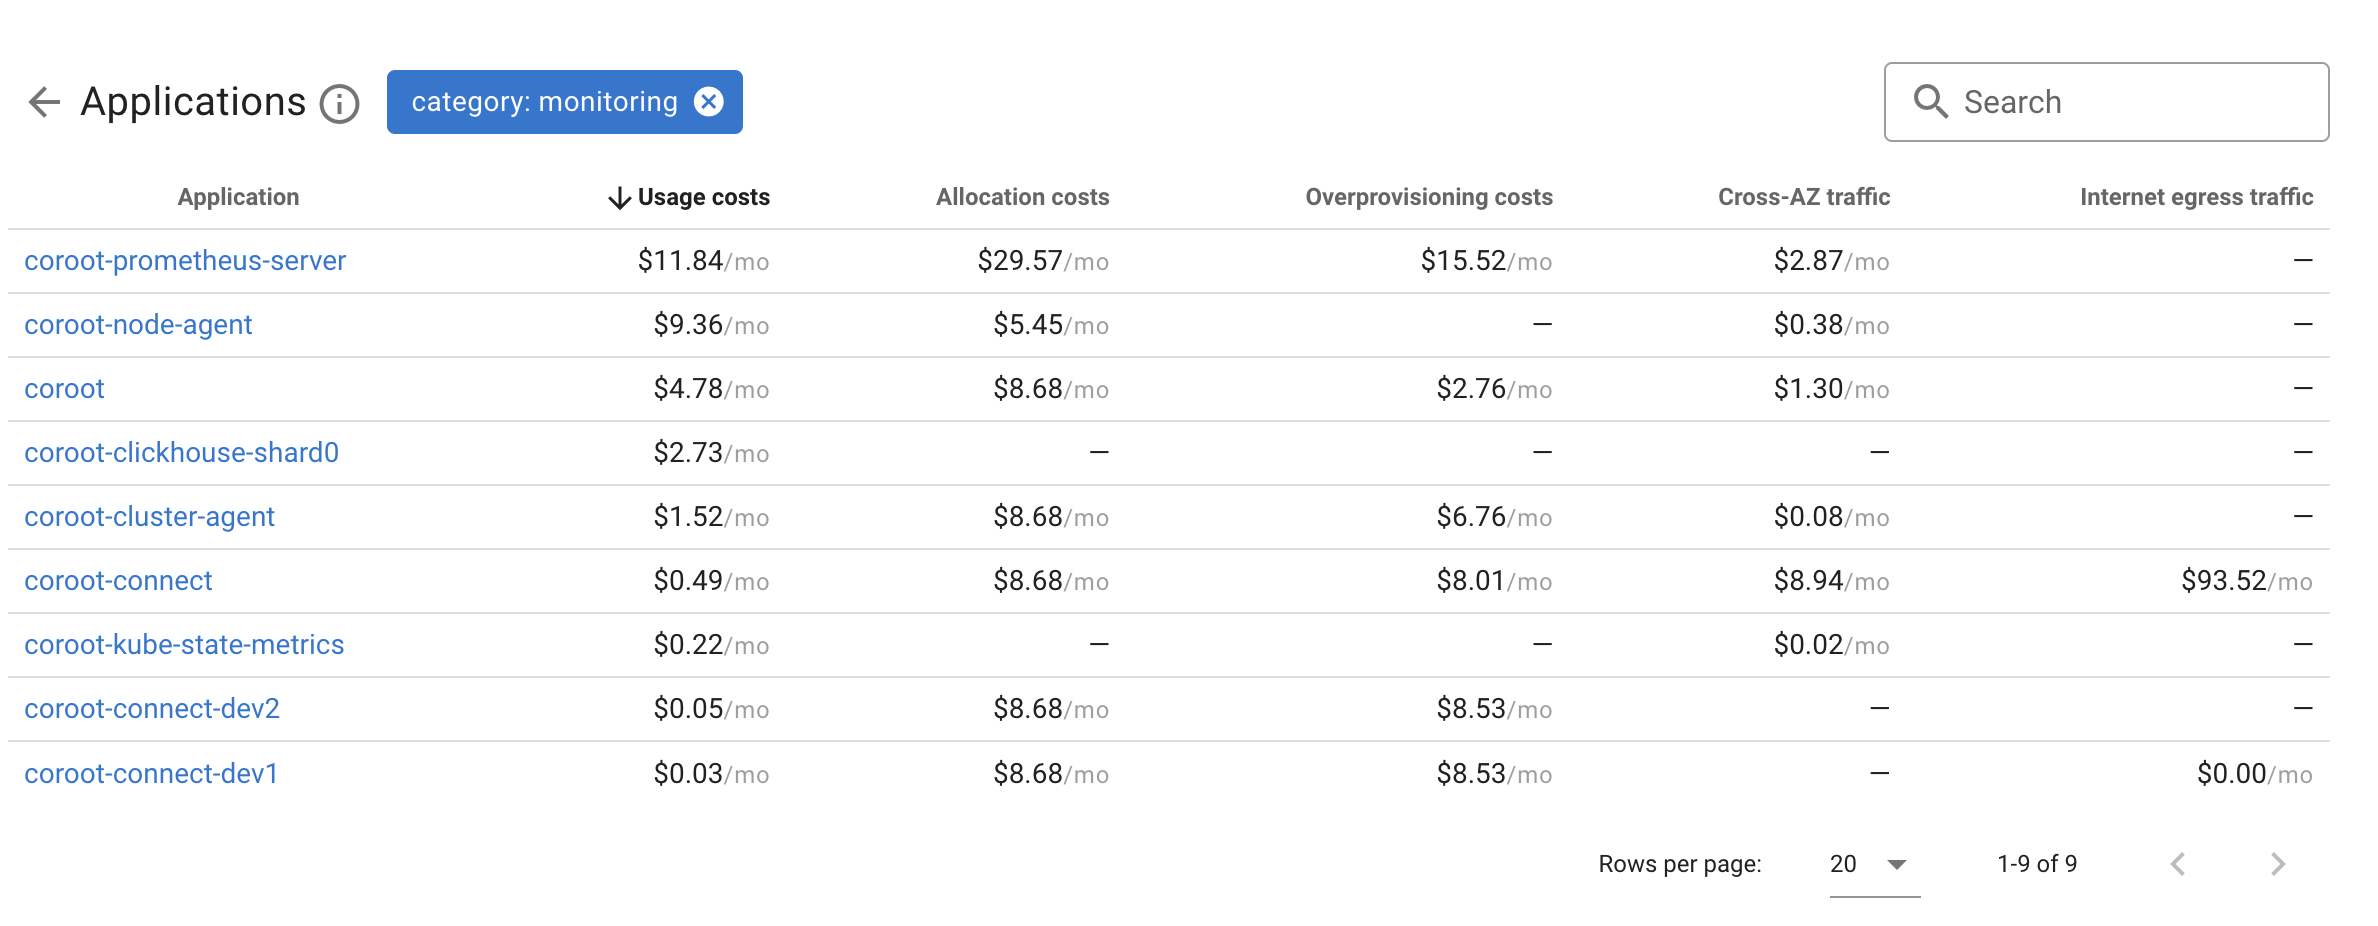
The most exciting thing about this approach is that it’s not just for Kubernetes! If your app on an EC2 instance communicates with an RDS cluster in a different AZ, you’ll see the associated costs as well.
As an engineer, I believe that it’s impossible to optimize anything without measuring it. Now, with Coroot, you can start optimizing your data transfer costs with all the necessary data.
Custom Applications
Coroot groups individual containers into applications using the following approach:
- Kubernetes metadata: Pods are grouped into Deployments, StatefulSets, etc.
- Non-Kubernetes containers: Containers such as Docker containers or Systemd units are grouped into applications by their names. For example, Systemd services named mysql on different hosts are grouped into a single application called mysql.
This default approach works well in most cases. However, since no one knows your system better than you do, Coroot allows you to manually adjust application groupings to better fit your specific needs. You can regroup any non-Kubernetes applications:
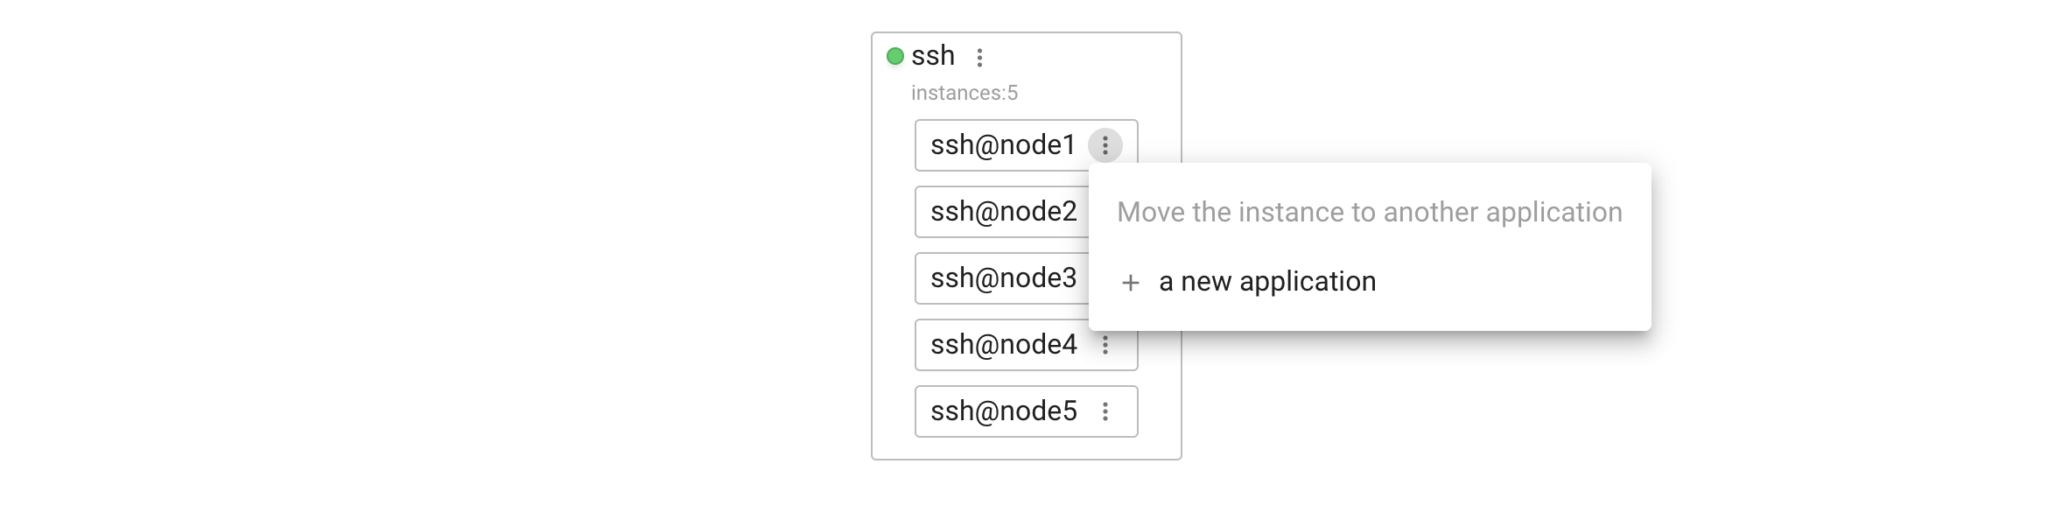
A custom application in Coroot is a name and a set of patterns for application instances.
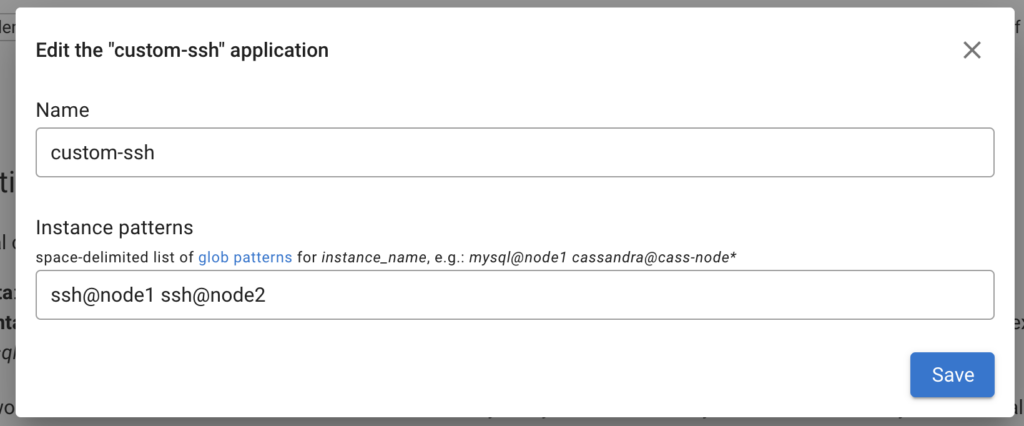
That’s it. Now, these two instances are part of our custom application, custom-ssh. It appears as a dedicated app on the Service Map, Application Health Summary, and other related views.
New approach for I/O monitoring
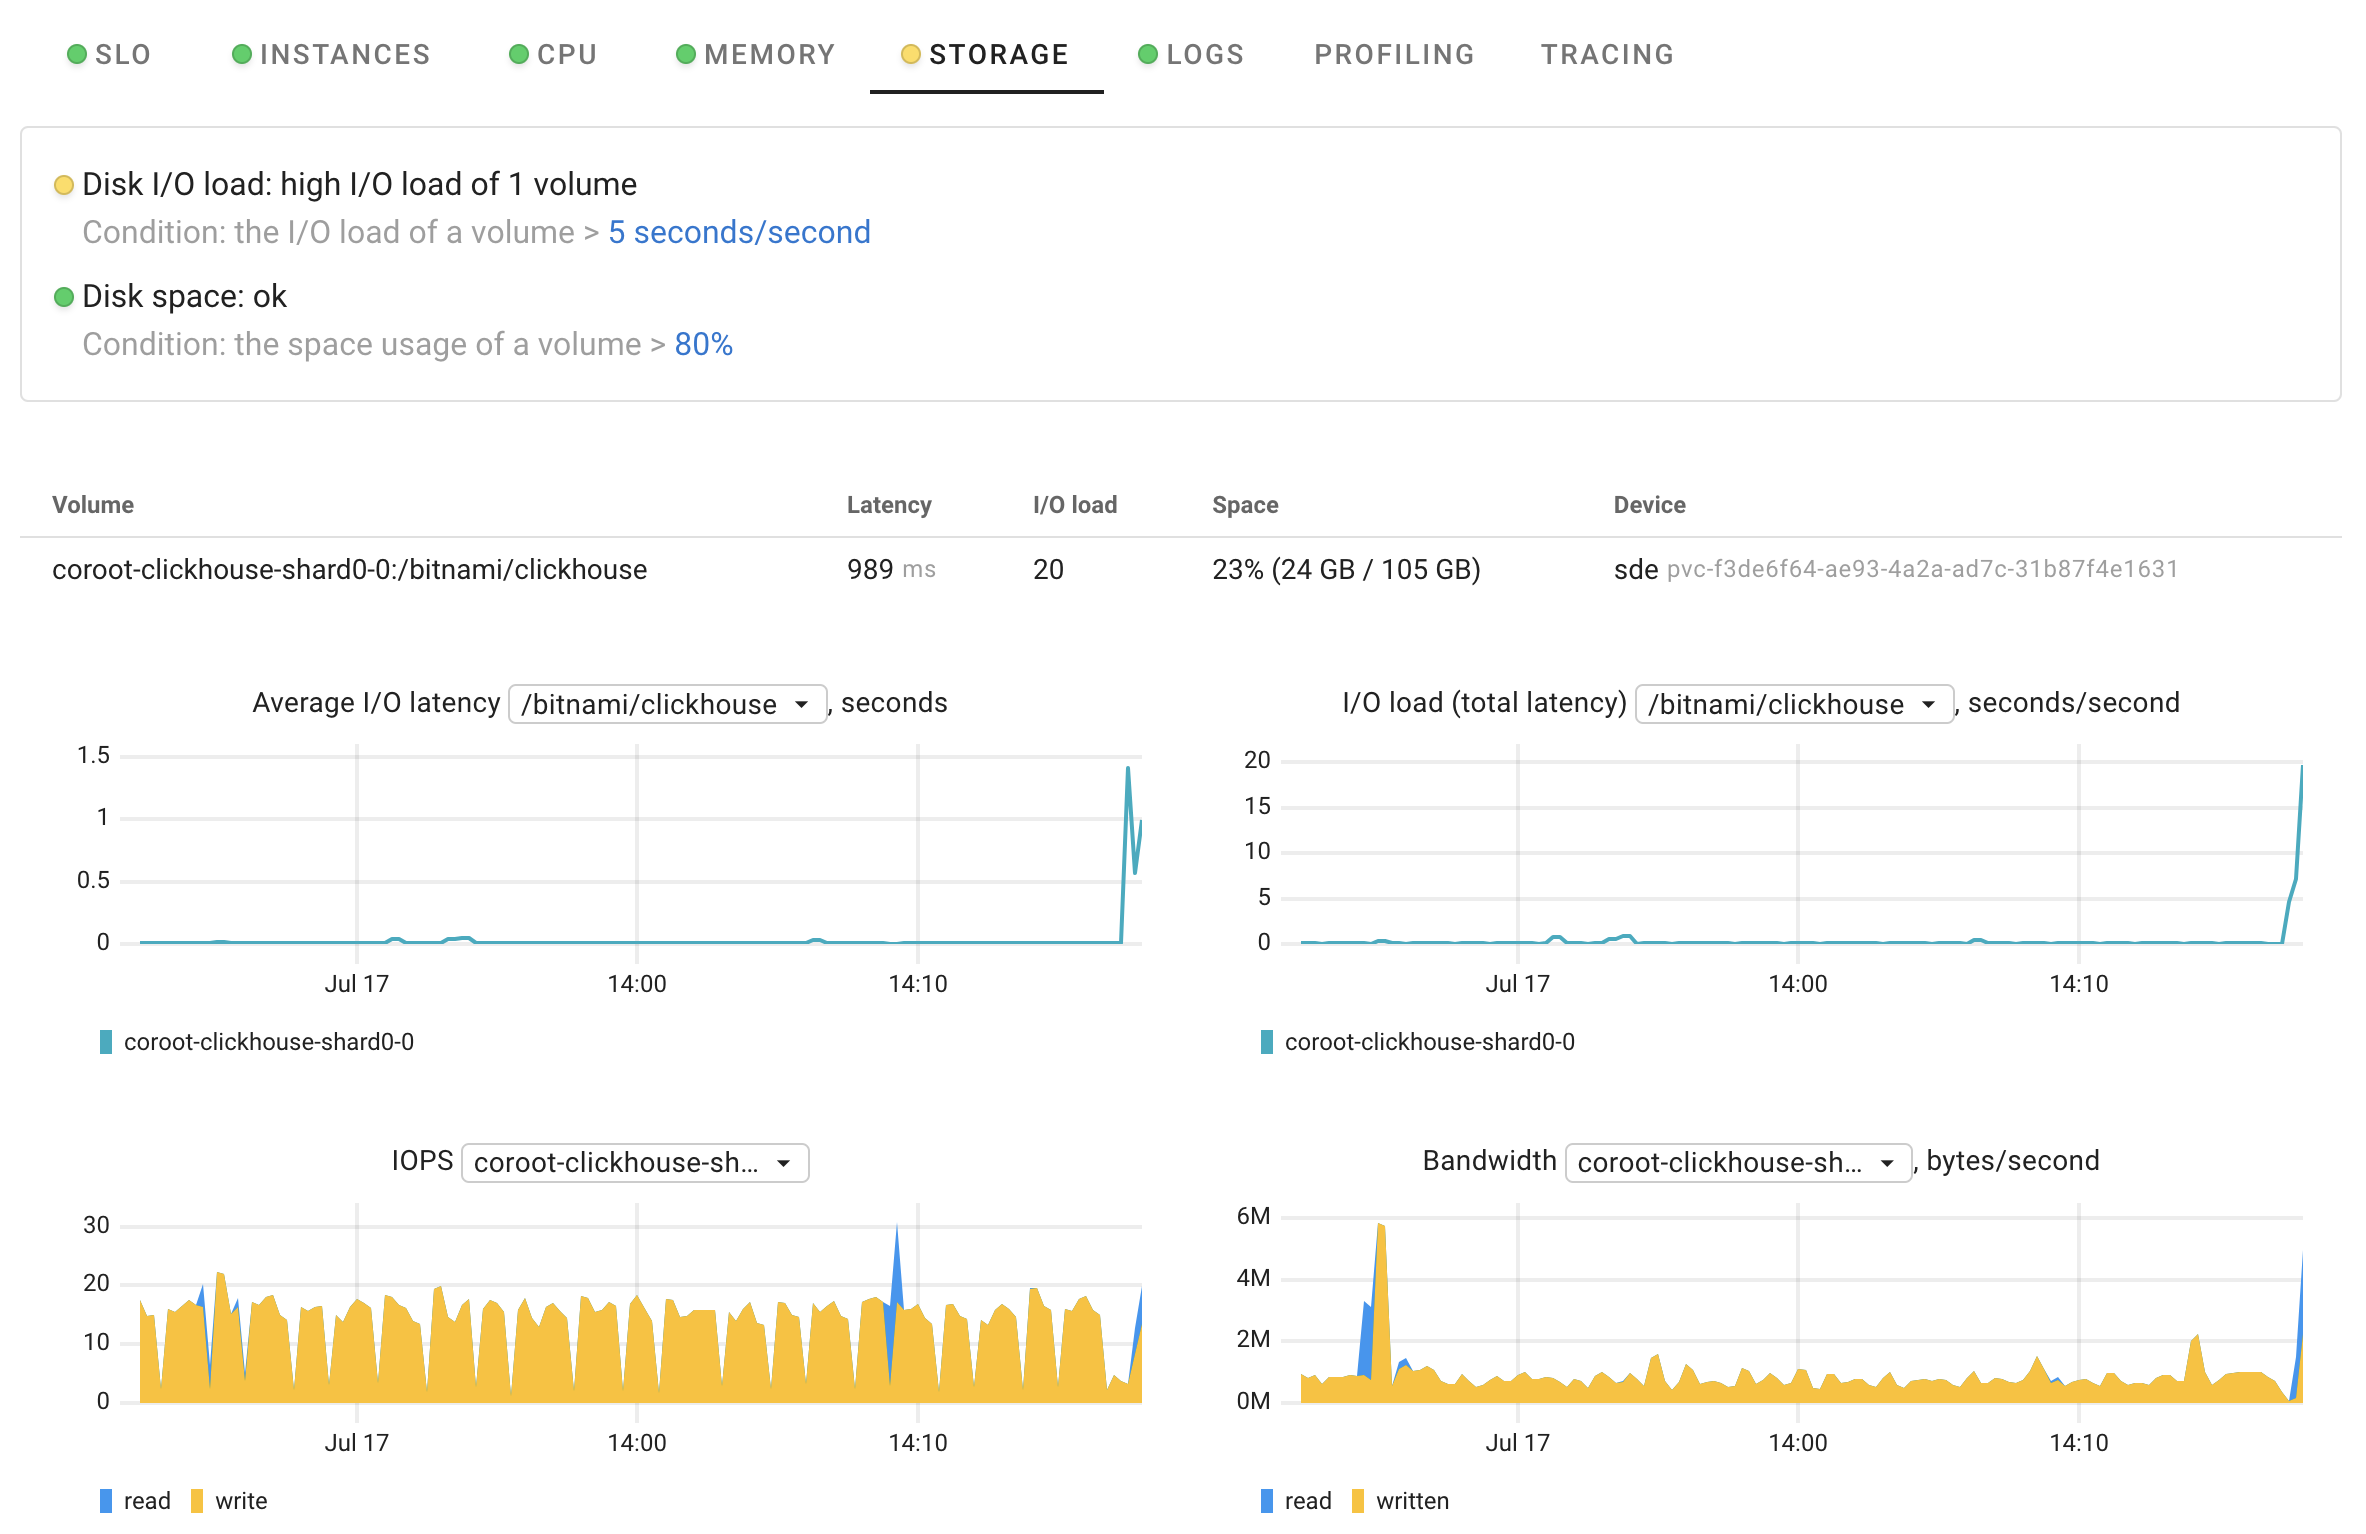
Coroot now uses the I/O load metric (total I/O latency) to identify storage performance issues. Previously, we relied on I/O utilization, which measures the time the disk performs at least one query. This method was accurate for spinning HDDs but is less effective for modern SSDs, which can handle multiple queries simultaneously.
To address this, Coroot sets a default threshold of 5 seconds/second for I/O load. If a disk performs more than 5 I/O requests in parallel, it is flagged as having high I/O load. This threshold is optimal for most average SSDs on the market. However, if you use higher-performance storage, you can easily adjust this threshold for specific applications, databases, or entire projects.
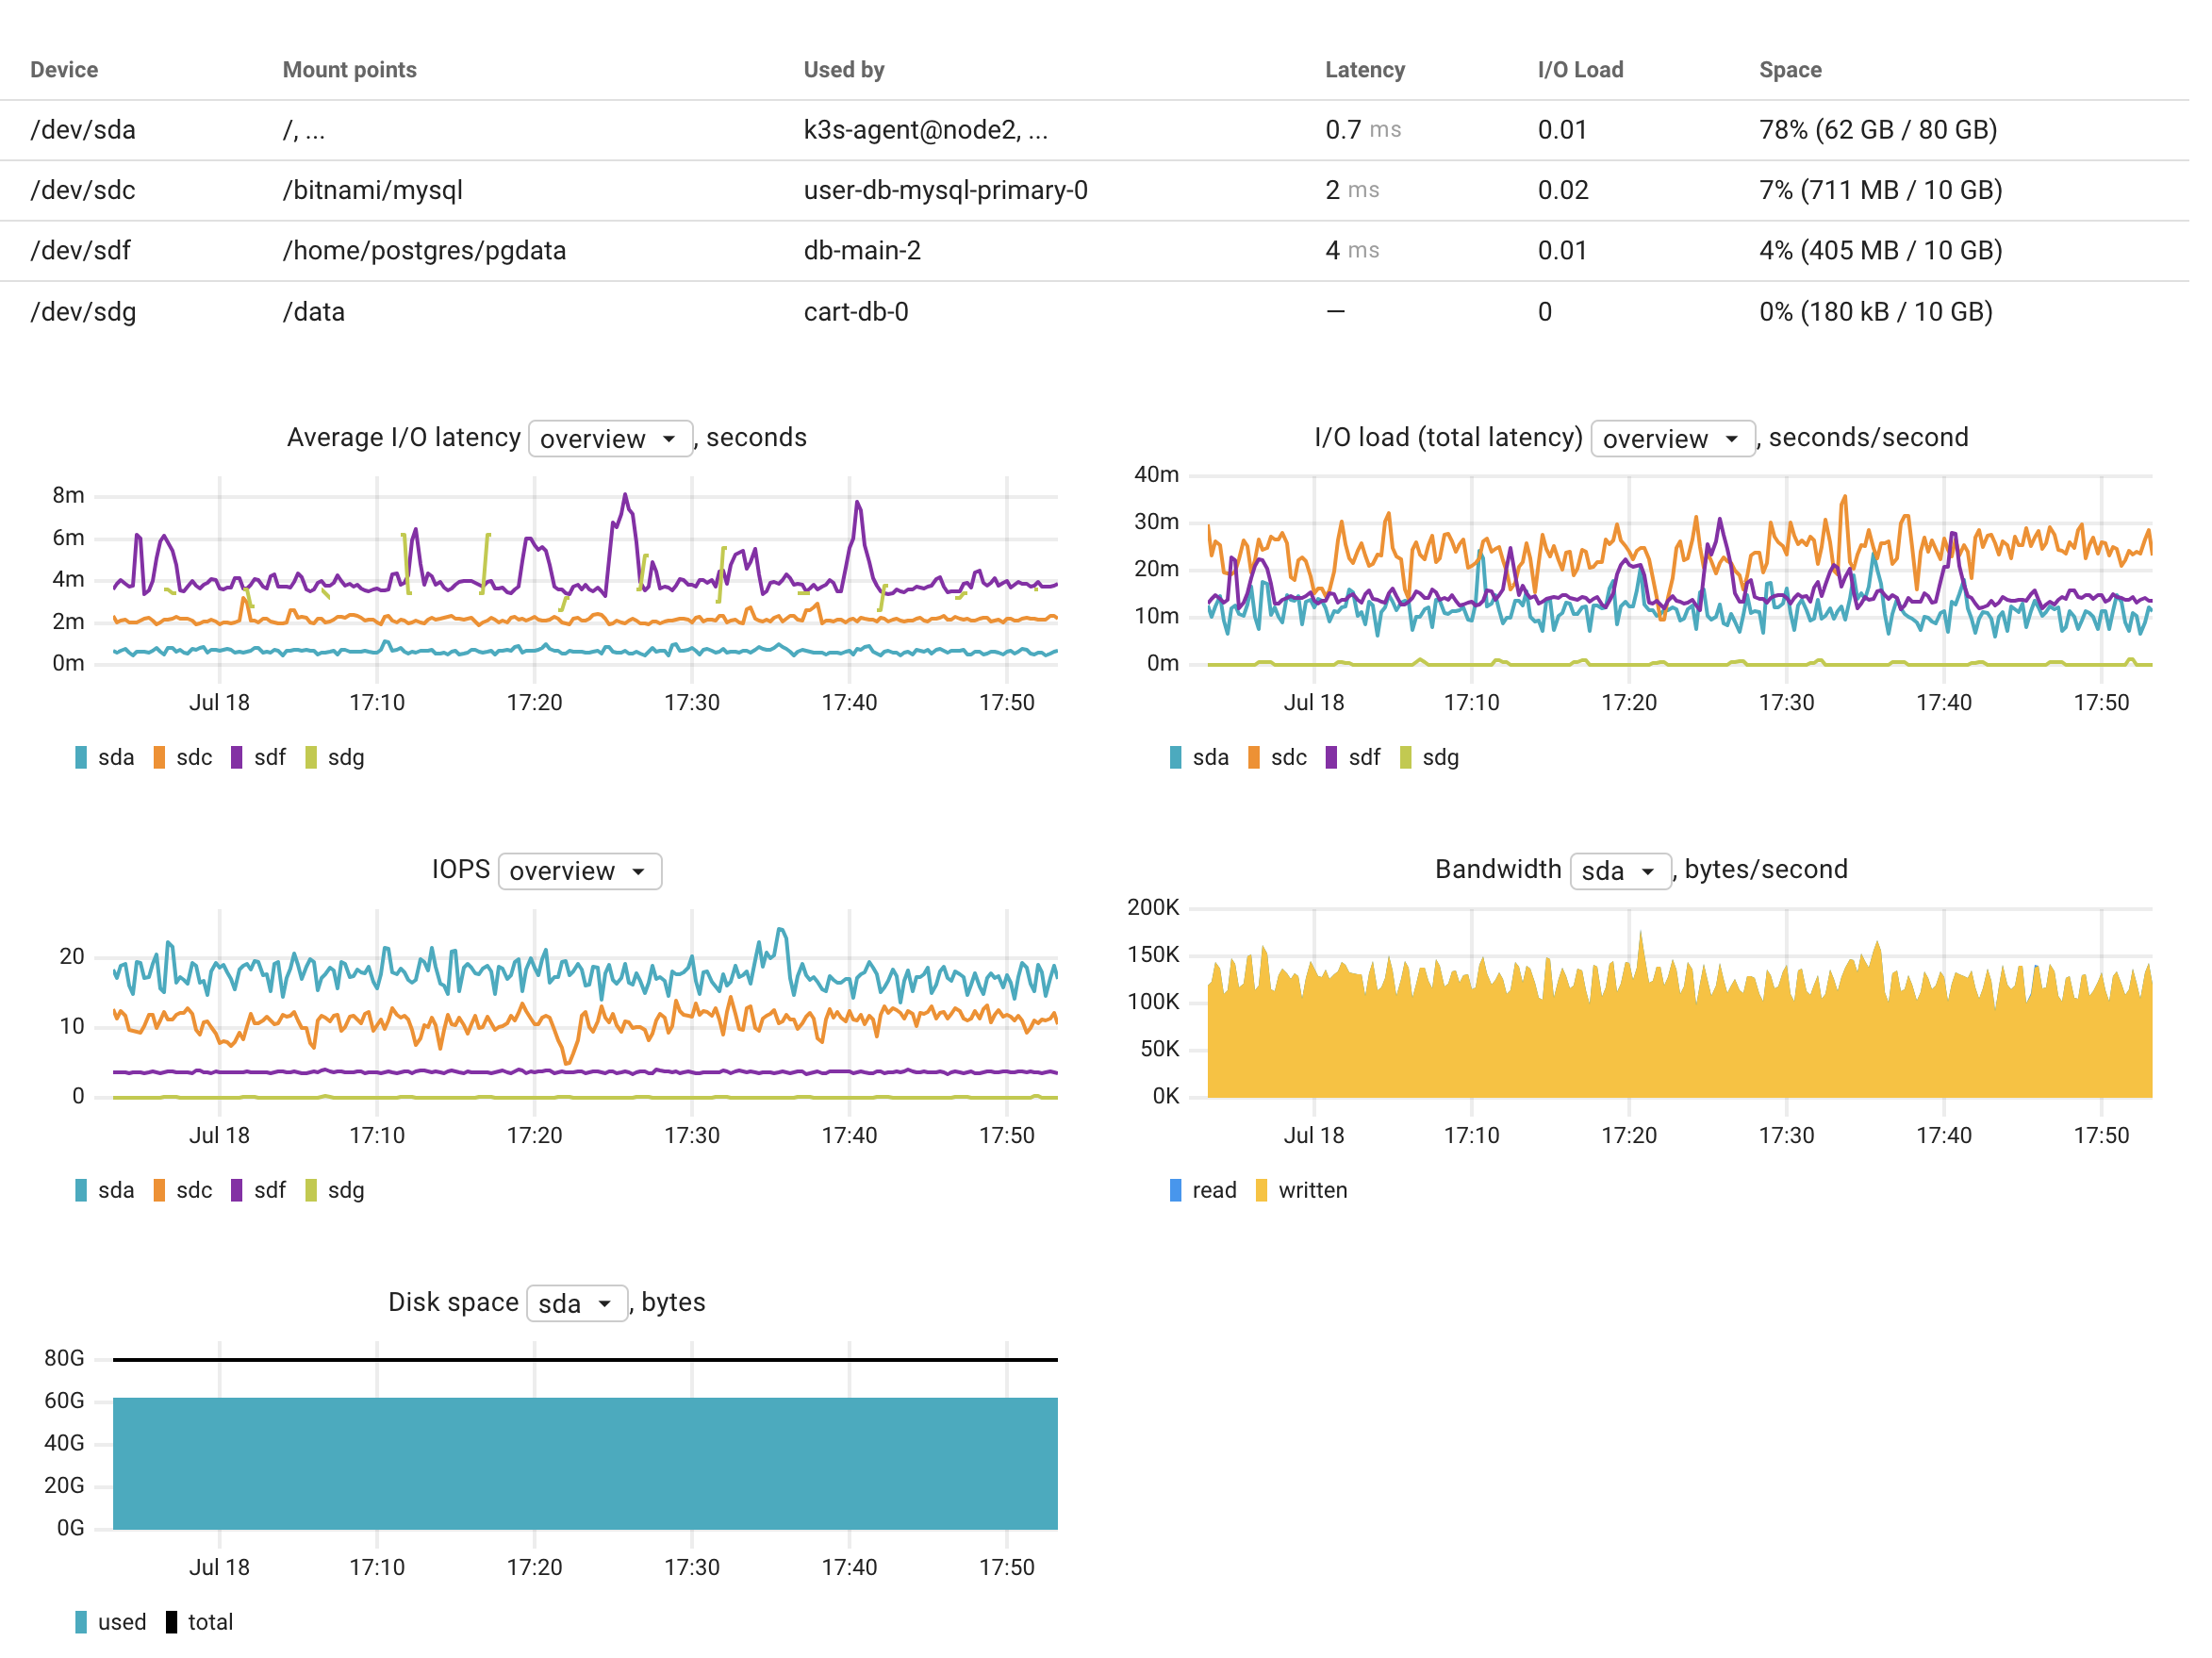
Storage volumes on the node page
Before v1.4 Coroot didn’t show storage volumes attached to a node on its page. In Kubernetes, most applications use dedicated Persistent Volumes (PVs), which are usually network-attached rather than physical node disks. From the first release, Coroot has shown these PVs in the context of the application, not the node.
As we added support for VMs and bare-metal servers, more users began using Coroot in non-Kubernetes or hybrid environments. So, we decided to add disk performance statistics to the node page, whether the disk is local or network-attached.
Network inspection is now even more precise
Even before v1.4, Coroot’s network monitoring capabilities were significantly better than other observability tools on the market. However, there were some missing statistics that can be extremely useful in certain cases.
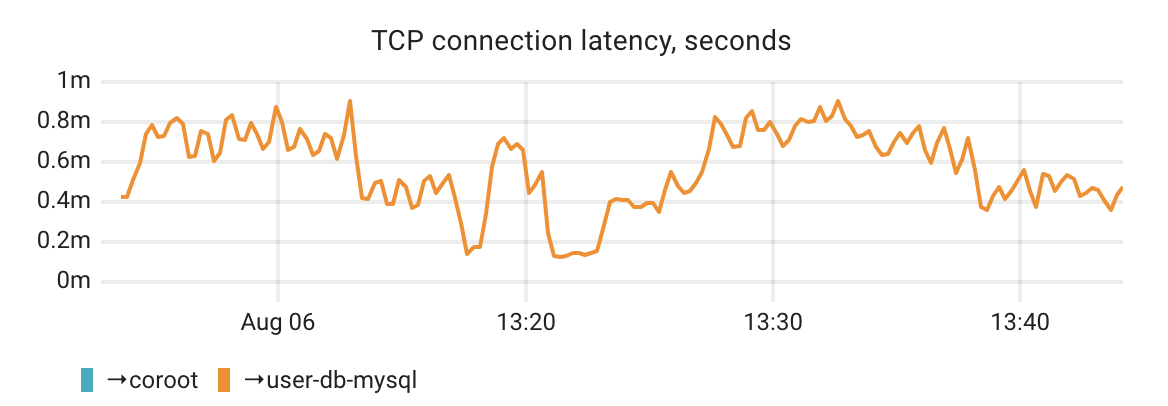
One key metric is TCP connection latency. Before v1.4, you could easily detect if connections to a particular service failed to establish or if the network round-trip time between a service and its database was higher than usual. However, these two metrics could miss scenarios where a service or database is slow to accept connections. To address this, we added the TCP connection latency chart.
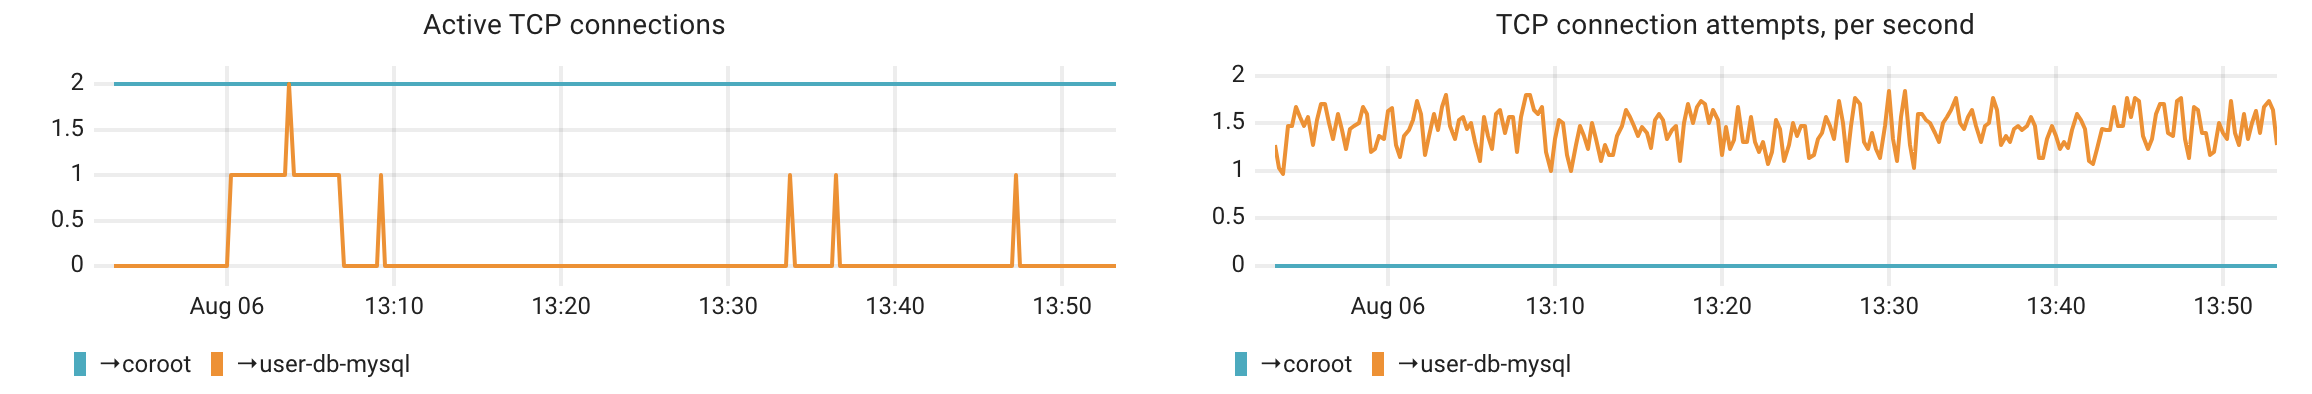
Re-establishing a TCP connection for each HTTP request or Postgres query is usually inefficient, as it adds latency and consumes compute resources. That’s why most applications use connection pools of long-lived TCP connections. With Coroot, you can now easily see how many active connections your apps use to communicate with each service or database, and how often they open new connections.
Improvements in application categories
We know that in every environment, some applications are more important than others. Engineers and teams often want to focus on specific applications while giving less attention to others. For example, the platform team needs to monitor the control plane, while DBAs focus on the databases.
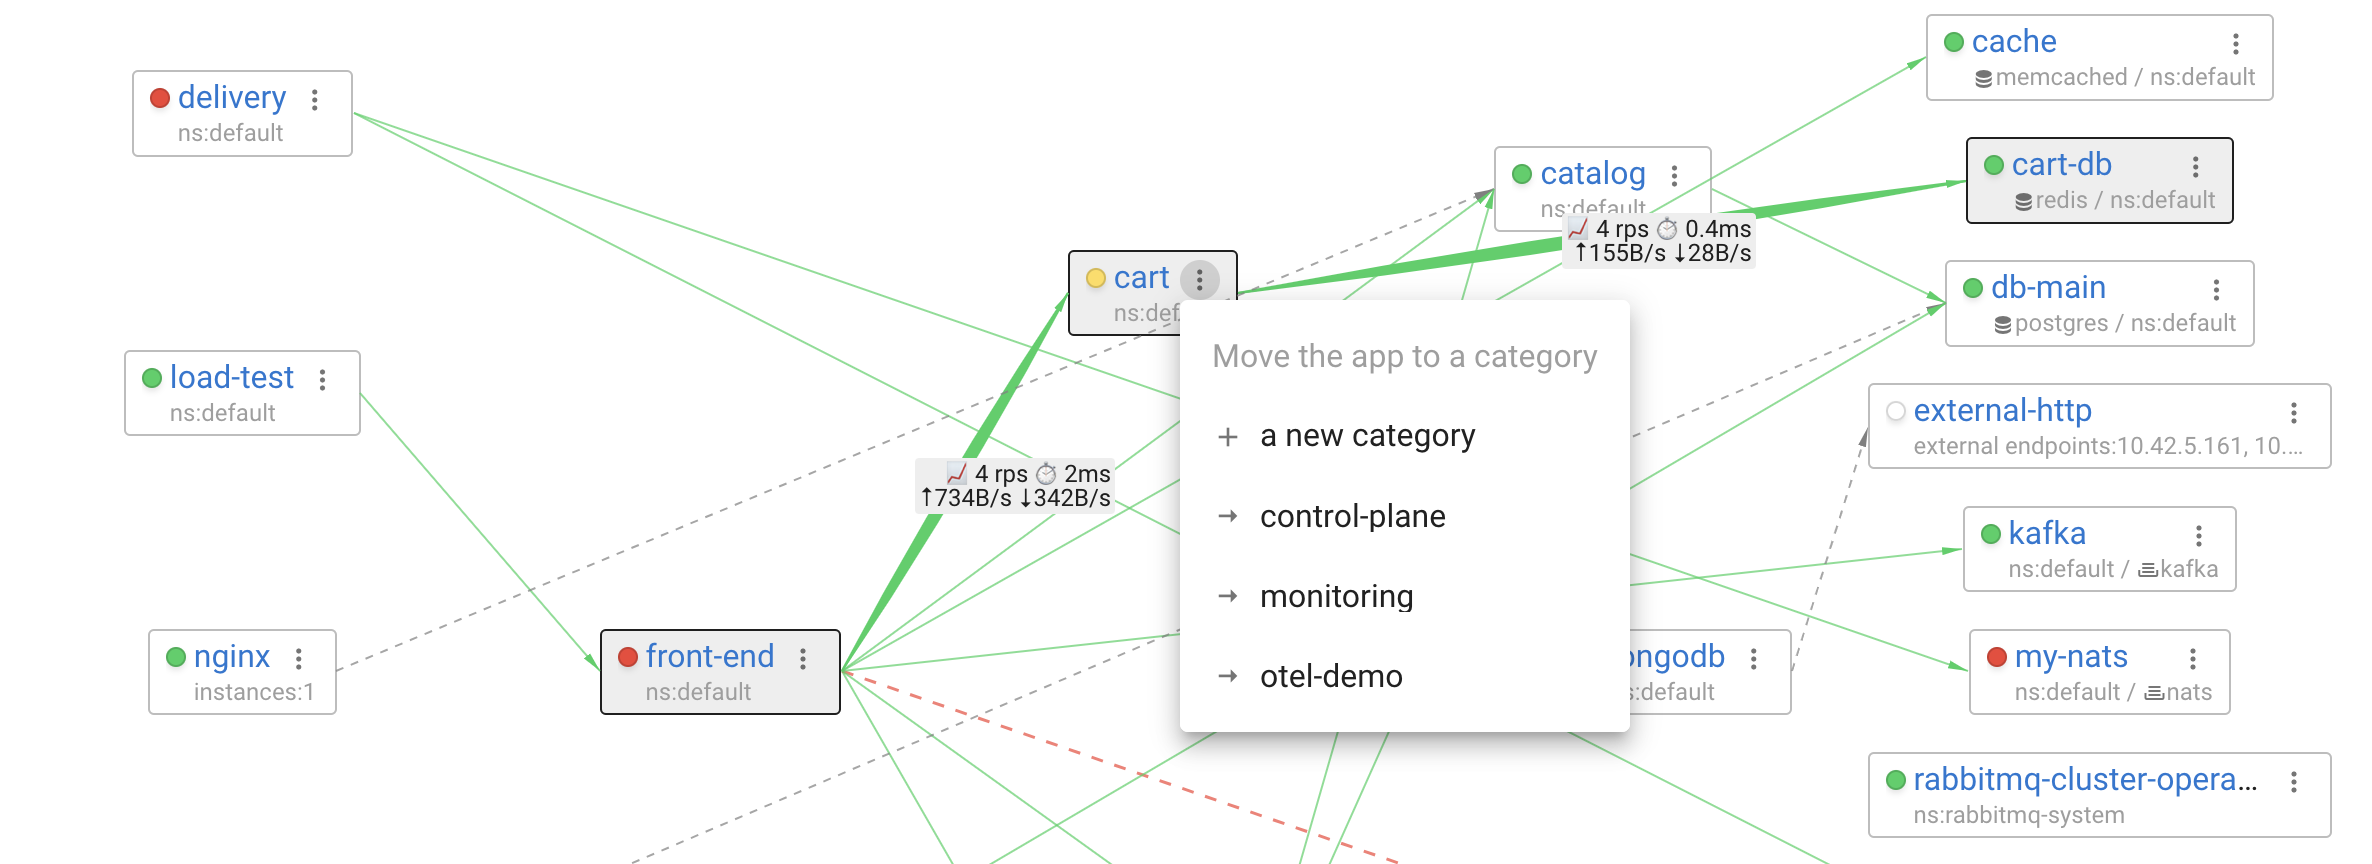
Coroot has always allowed users to define ‘Categories’ for applications, enabling them to group and manage these applications separately on the Service Map or Application Health Summary. Our anonymous usage statistics show this feature is popular. In v1.4, we’ve made customizing categories even easier. Now, you can set up a new category or add an application to an existing one directly from the Service Map.
Conclusion
With Coroot v1.4, we’ve taken significant steps to enhance your observability and cost management capabilities. By introducing network traffic monitoring, you can now better understand and optimize your data transfer costs. Our improvements in TCP connection latency monitoring and I/O performance analysis ensure that you have precise and actionable insights into your system’s performance.
We’ve also made it easier to manage and focus on the applications that matter most to you, whether you’re using Kubernetes, VMs, or a hybrid environment. The enhanced customization of application categories ensures that you can tailor Coroot to your specific needs.
Start exploring Coroot v1.4 today and take full control of your application’s performance and costs. We look forward to continuing to support your observability needs.