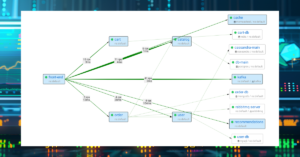
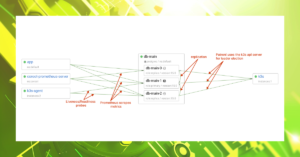
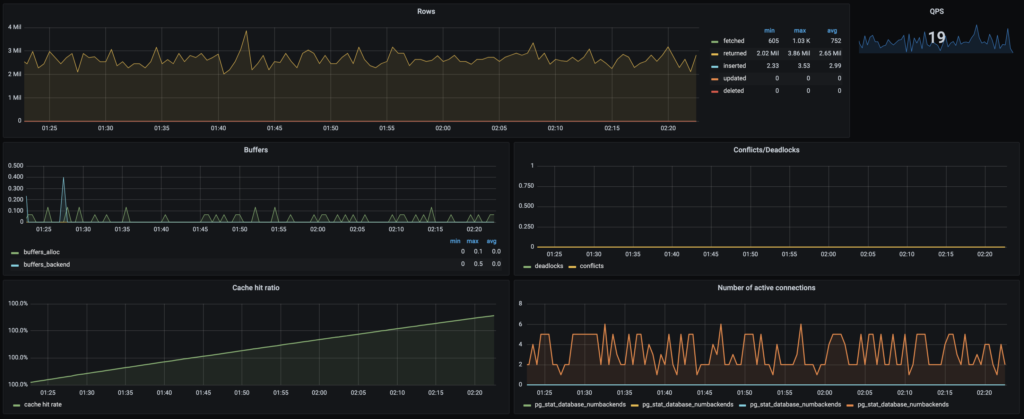
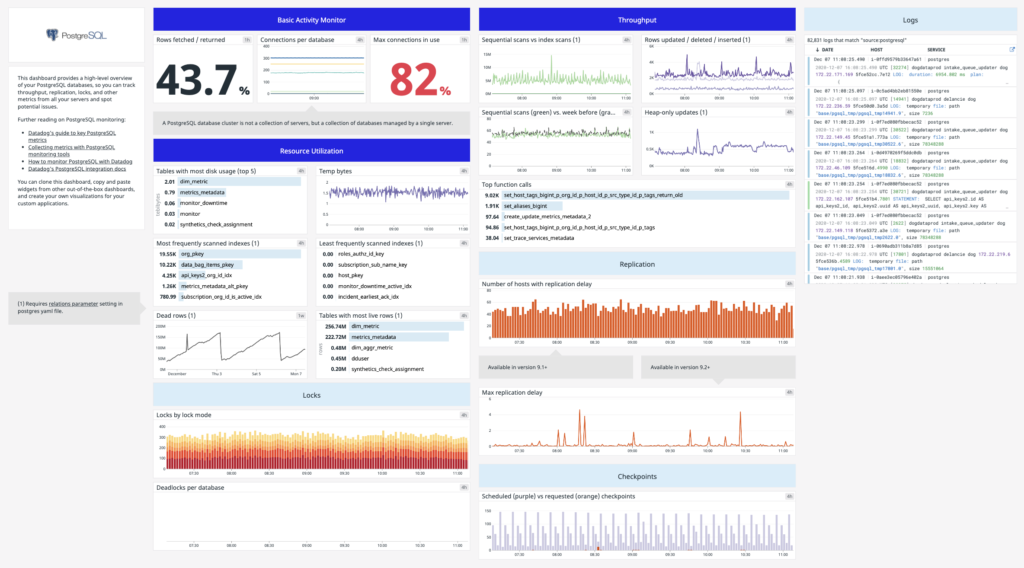
When I look at Postgres dashboards provided by popular observability tools, I struggle to comprehend how they can be used to understand what’s happening with a Postgres server. While they present numerous Postgres metrics, these metrics, unfortunately, prove useless when trying to troubleshoot the most common Postgres performance issues, such as high query latency and connection errors.
From my perspective, the best way to ensure that your dashboards and alerts can actually help you spot real-world problems is by deliberately introducing those issues into a testing environment. At Coroot, we consistently use this approach across all stages of product development – starting from gathering the right metrics to validating issue-detection algorithms built upon the collected metrics.
Let’s reproduce various Postgres failure scenarios and see how they can be identified with Coroot.
Setting up the environment
Given that troubleshooting usually begins not from the database itself, but rather from an application that is not performing as expected, my testing environment will include both the database and the application using it.

My testing environment is a K3S cluster with 3 worker nodes (4xCPU/8Gb).
As a database, I will use a Postgres cluster managed by the Postgres Operator. Each Postgres instance is instrumented by coroot-pg-agent deployed as a side-car container.
apiVersion: "acid.zalan.do/v1"
kind: postgresql
metadata:
  name: db-main
  namespace: default
spec:
  ...
  volume:
    size: 30Gi
  numberOfInstances: 3
  users:
    coroot: [superuser]
    demo: []
  databases:
    demo: demo
  resources:
    limits:
      cpu: "2"
      memory: 4Gi
    requests:
      cpu: "2"
      memory: 4Gi
  postgresql:
    version: "14"
    parameters:
      track_io_timing: "on"
      log_destination: "stderr"
      logging_collector: "off"
      log_line_prefix: "%m [%p] "
  sidecars:
    - name: coroot-pg-agent
      image: ghcr.io/coroot/coroot-pg-agent:1.2.4
      env:
        - name: LISTEN
          value: ":9090"
        - name: PGPASSWORD
          valueFrom: { secretKeyRef: { name: coroot.db-main.credentials.postgresql.acid.zalan.do, key: password } }
        - name: DSN
          value: "host=127.0.0.1 port=5432 user=coroot password=$(PGPASSWORD) dbname=postgres connect_timeout=1 statement_timeout=10000"
  podAnnotations:
    prometheus.io/scrape: 'true'
    prometheus.io/port: '9090'
The database contains only the products table with 25 million rows (15Gb):
demo=# d products
                              Table "public.products"
   Column    |  Type  | Collation | Nullable |               Default
-------------+--------+-----------+----------+--------------------------------------
 id          | bigint |           | not null | nextval('products_id_seq'::regclass)
 brand       | text   |           | not null |
 name        | text   |           | not null |
 model       | text   |           | not null |
 description | text   |           | not null |
 price       | bigint |           | not null |
Indexes:
    "products_pkey" PRIMARY KEY, btree (id)
    "idx_products_brand" btree (brand)
The catalog service handles requests from loadgenerator and retrieves 100 products from this table per request:
SELECT * FROM "products" WHERE "products"."id" IN (<random IDs>)
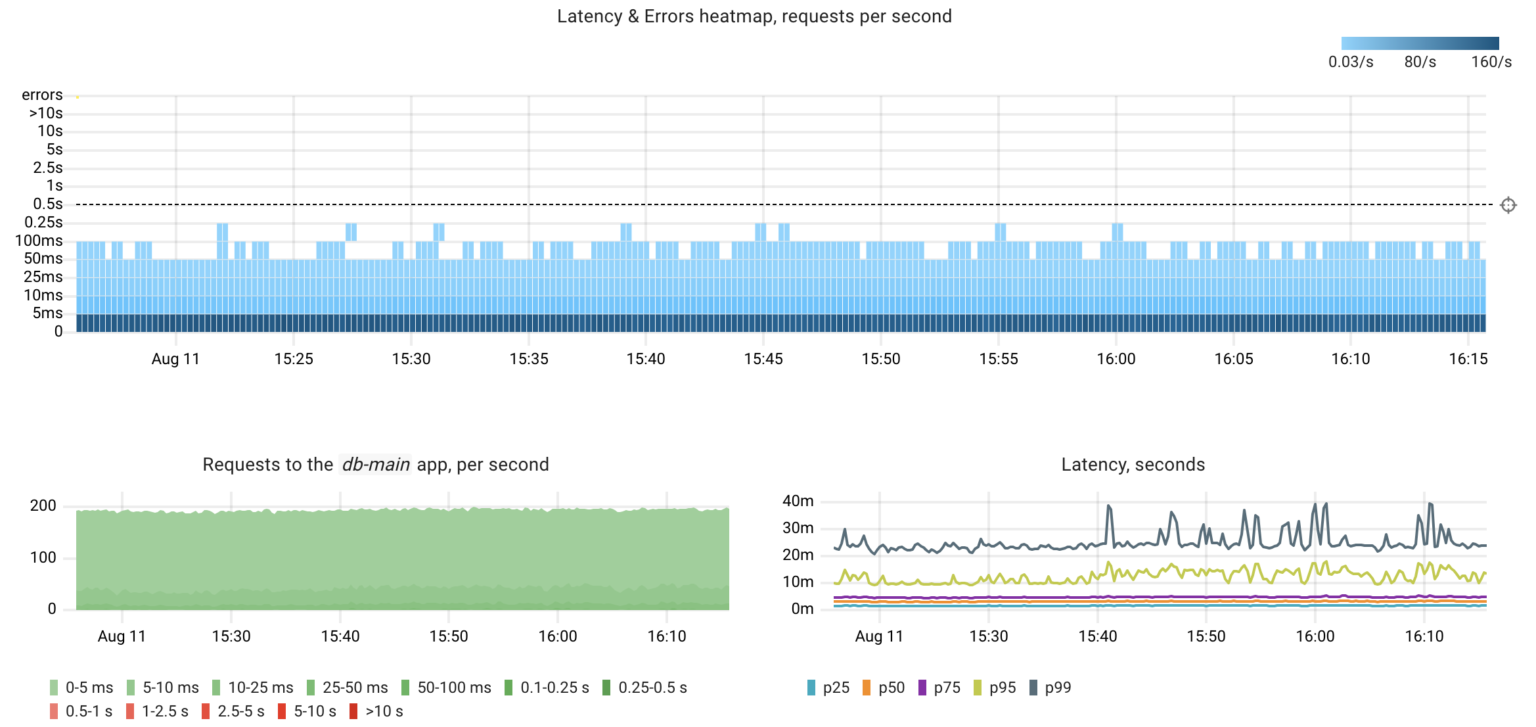
Under typical conditions, the database handles 200 queries per second, with a 99th percentile response time of 40 milliseconds.
Failure #1
Let’s execute a “heavy” query that will put a significant load on the CPU and disk of the Postgres instance:
select count(1) from products where description like '%LK-99%'
Now let’s check how this impacted catalog‘s performance and try to find the root cause, as if we’re completely new to the problem.
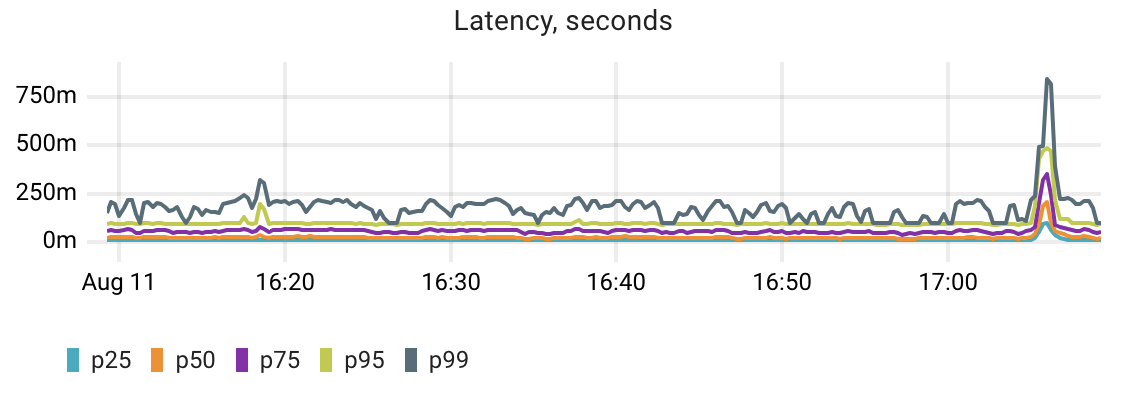
We spot a spike in the catalog‘s latency. To determine whether this anomaly is caused by a Postgres performance issue, we need to somehow compare the app latency with the DB latency. If these metrics correlate we can go deeper to find the reason for the degraded database performance.
That’s exactly how Coroot’s automated root cause analysis works. Here’s its report for this scenario.
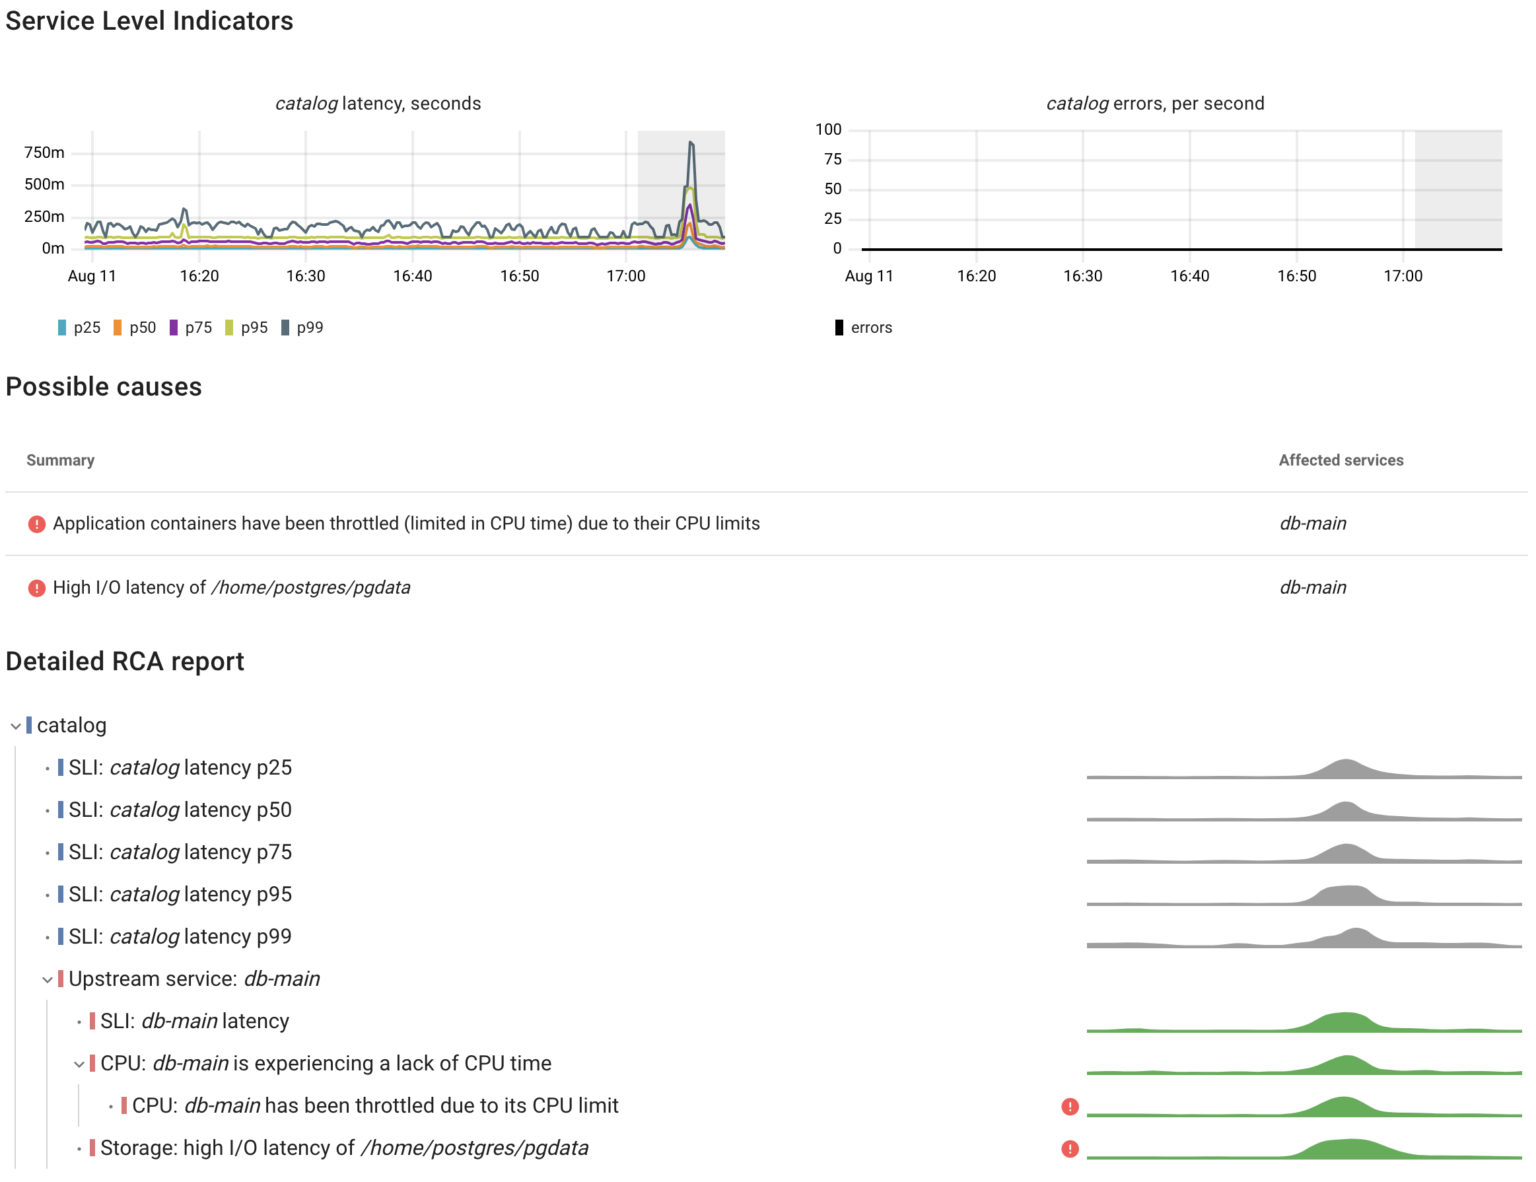
As we can see, the catalog service responded slower because the database handled queries slower. Now Let’s take a closer look at the metrics used for such analysis.
The most effective method for evaluating an observability tool is to introduce a failure intentionally into a fairly complex system, and then observe how quickly the tool detects the root cause.
We’ve built Coroot based on the belief that having high-quality telemetry data enables us to automatically pinpoint the root causes for over 80% of outages with precision. But you don’t have to take our word for it—put it to the test yourself!
To simplify this task for you, we created a Helm chart that deploys:
- OpenTelemetry Demo: a web store application built as a set of microservices that communicate with each other over gRPC or HTTP.
- Coroot: an eBPF-based observability platform that automatically analyzes telemetry data such as metrics, logs, traces, and profiles to help you quickly identify the root causes of outages.
- Chaos Mesh: a chaos engineering tool for Kubernetes that allows you to simulate various fault scenarios.
Postgres latency
Coroot’s node-agent uses eBPF to capture requests made by one application to another. It exposes metrics describing their status and latency without the need to change any application code. The agent seamlessly works with common protocols like HTTP, Postgres, MySQL, Redis, Cassandra, MongoDB, and others.
By capturing every Postgres query on the client side, Coroot is able to accurately measure the latency of queries just as the client experiences them. As a result, the agent provides query statistics for every client app, whether it works with a Postgres instance within the same cluster or an AWS RDS instance.
- container_postgres_queries_total – total number of outbound Postgres queries made by the container
- container_postgres_queries duration_seconds_total – histogram of the response time for each outbound Postgres query
Another advantage of leveraging eBPF to gather these metrics is that it doesn’t require specific support from Postgres and stays compatible with all versions of Postgres. This compatibility is maintained because the Postgres Wire Protocol has remained unchanged since PostgreSQL 7.4.
A lack of CPU time and its reasons
Let’s imagine a basic outline of what Postgres is doing when executing a query:
- Getting data from memory (buffer cache) or disk (using the page cache).
- Doing calculations on a CPU, like filtering and sorting.
- Waiting for locks.
That’s about it! There’s not much else happening!
Returning to our failure, according to the Coroot RCA report, the first reason for the Postgres latency increase is a lack of CPU time. Let’s go deeper and look at the metrics behind this inspection:
- container_resources_cpu_delay_seconds_total – total time duration the container has been waiting for a CPU (while being runnable). It provides a precise indication of whether a container faced CPU time shortages, regardless of the underlying cause — be it CPU throttling or insufficient CPU capacity on the node.
- container_resources_cpu_throttled_seconds_total – total time duration the container has been throttled for (limited in CPU time).
- pg_top_query_time_per_second – time spent executing the Postgres query. This metric gathered from pg_stat_activity and pg_stat_statement and can explain anomalies in Postgres CPU consumption precise to particular queries.
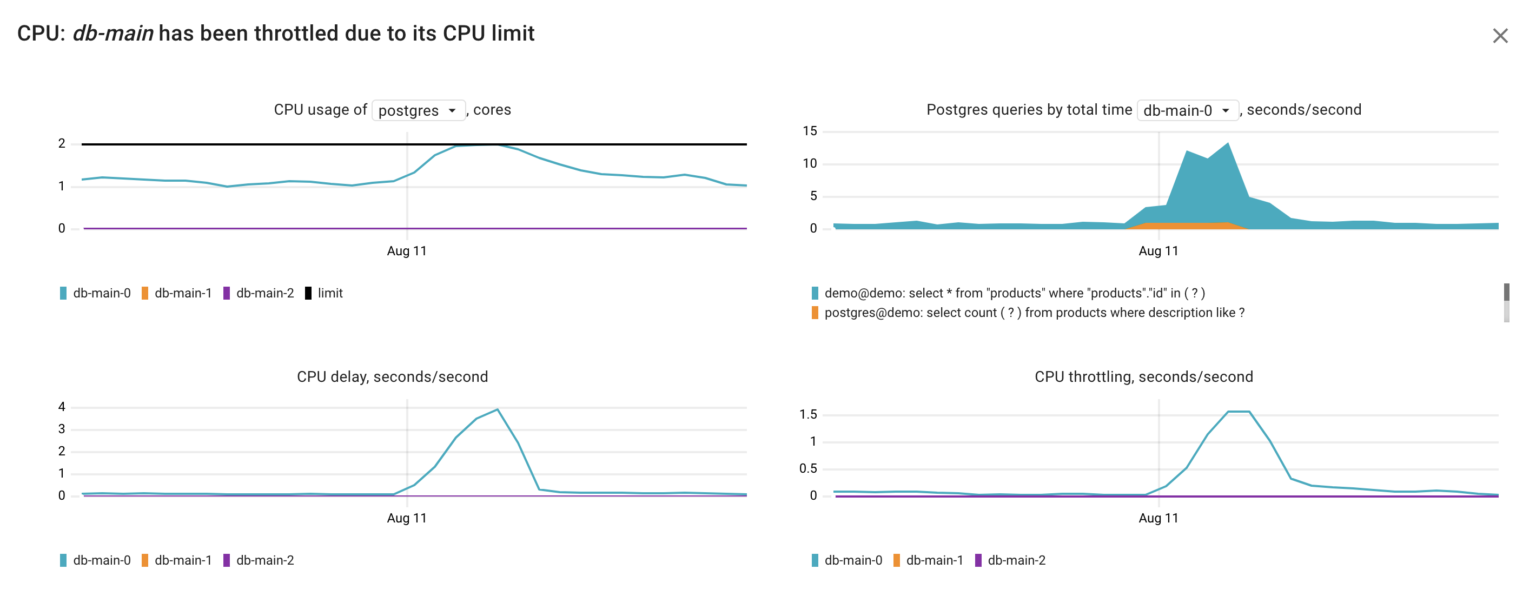
Using these metrics, we can infer that in our situation, the Postgres container faced a shortage of CPU time due to CPU throttling. This throttling seems to have been triggered by the increased CPU consumption, most probably originating from the following query executed by the user postgres on the demo database:
select count(?) from products where description like ?
This is the query we ran, but without specific arguments. The reason behind this is that Postgres doesn’t include arguments in the query text when saving statistics to pg_stat statements. Additionally, coroot-pg-agent adds another layer of security by obfuscating queries received from pg_stat_activity and pg_stat_statements.
I/O
The Coroot RCA report also highlighted that there’s a second factor contributing to the raised database latency: elevated I/O latency. Now, let’s dig deeper into this and examine the relevant metrics.
- node_resources_disk_(read|write)_time_seconds_total – total number of seconds spent reading and writing, including queue wait. To get the average I/O latency, the sum of these two should be normalized by the number of the executed I/O requests.
- node_resources_disk_(reads|writes)_total – total number of reads or writes completed successfully.
- node_resources_disk_io_time_seconds_total – total number of seconds the disk spent doing I/O. It doesn’t include queue wait, only service time. E.g., if the derivative of this metric for a minute interval is 60s, this means that the disk was busy 100% of that interval.
- pg_top_query_io_time_per_second – time the Postgres query spent awaiting I/O.
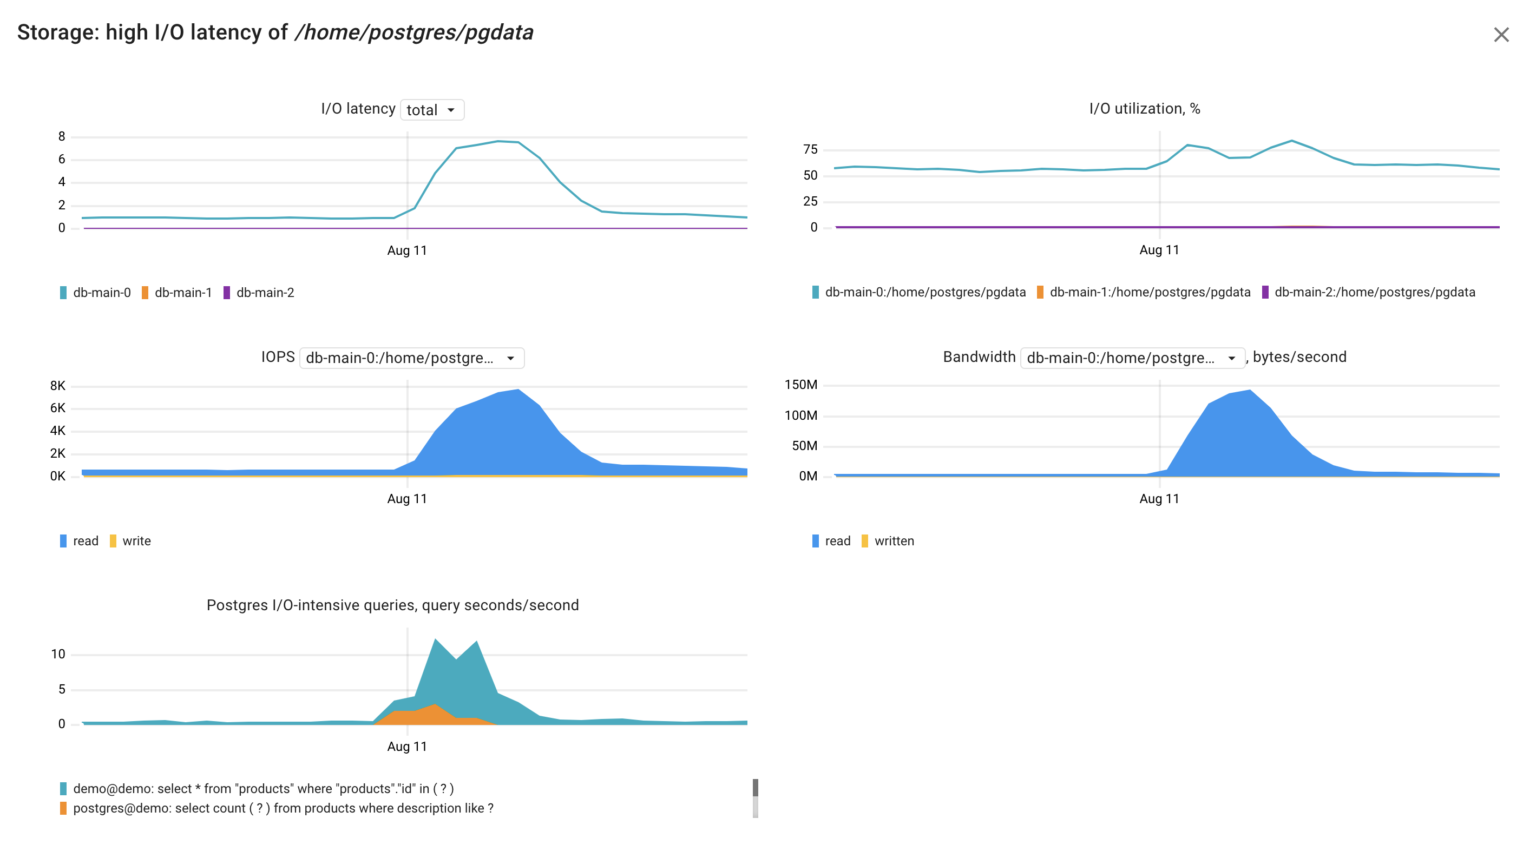
Interpreting these metrics, we can grasp the situation: the Postgres server dedicated considerable time waiting for I/O requests to complete due to a high volume of read requests to its disk. This spike in read requests likely originated by the query:
select count(?) from products where description like ?
Bingo! We’ve identified the cause of the short Postgres latency spike without having to read its logs or dig into system views.
Failure #2
We’ve talked about two out of three possible reasons why a Postgres server could be handling queries more slowly than usual. Now, let’s explore the scenario where a query is holding a lock, which in turn blocks other queries:
vacuum full products
In this case, it resulted in both higher latency and errors in processing requests by the catalog service.

As expected, Coroot identified issues with the database, including errors and increased latency. The errors occur because the catalog sets the statement_timeout when establishing a connection to Postgres. Additionally, Coroot recognized both I/O latency and blocked Postgres queries as potential causes.
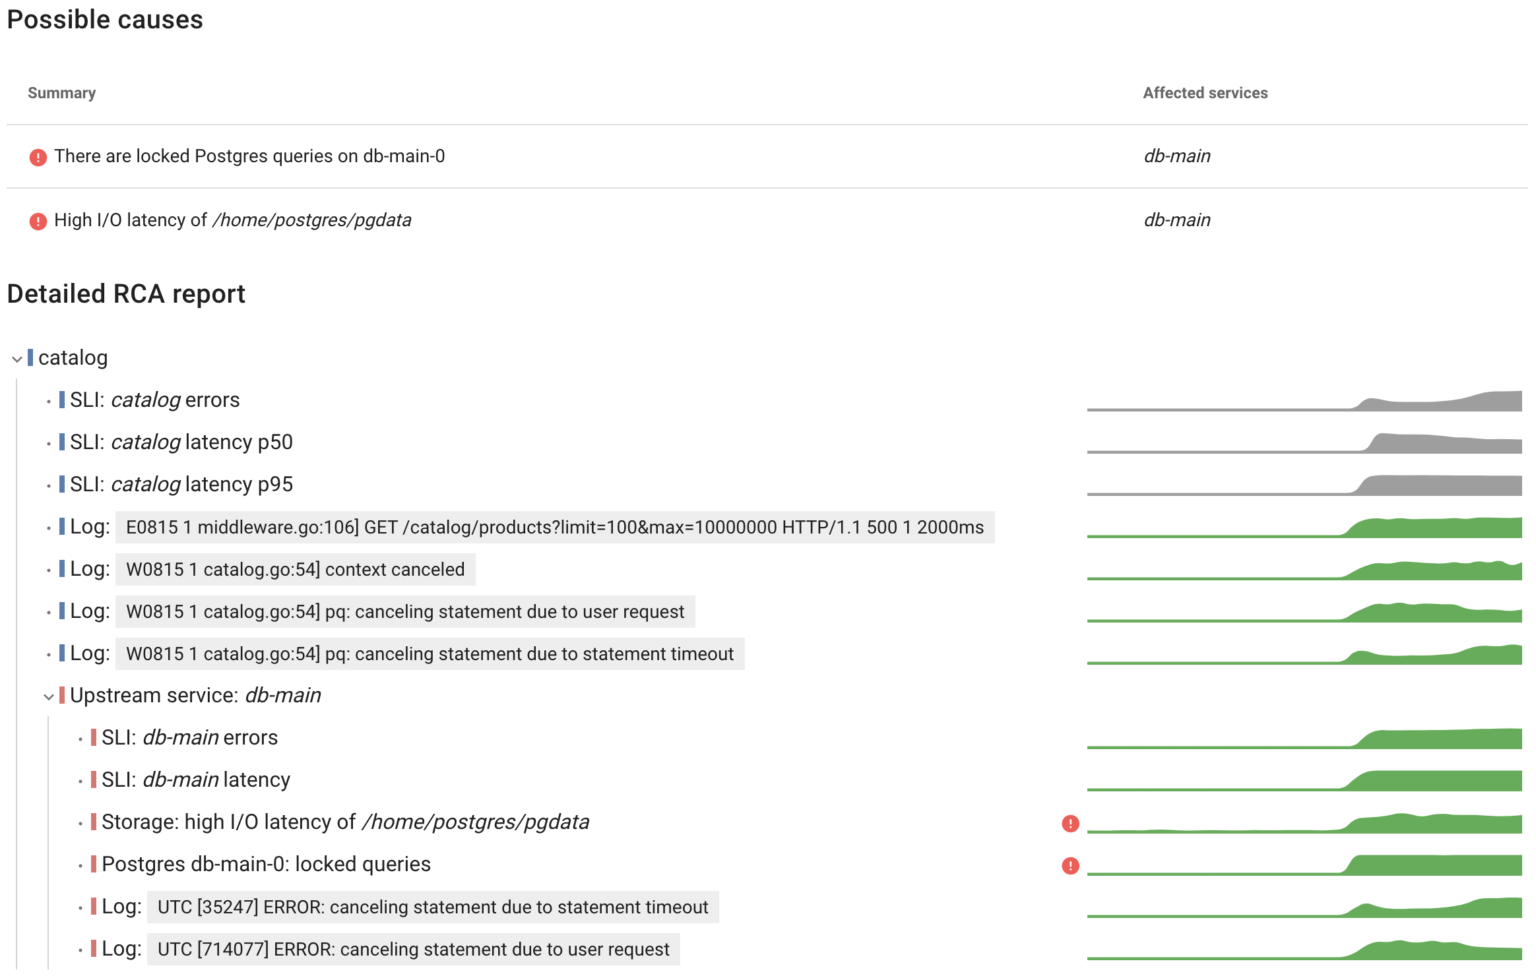
In the previous example we’ve learned how to identify the causes behind I/O issues. Now, let’s talk about Postgres errors and locks.
Postgres errors
It might seem a bit odd, but Postgres doesn’t provide error statistics in its system views. At Coroot, we’ve discovered two methods to gather error counts, and we use both approaches simultaneously.
The first method involves capturing queries and responses at the eBPF level. By parsing the Postgres Wire Protocol, the agent can determine if a specific query was successful or unsuccessful. As a result the container_postgres_queries_total metric is broken down by the status label.
container_postgres_queries_total{
    container_id="/k8s/default/catalog-68878b5bfd-rnvt4/catalog", // the container initiated the query
    destination="10.43.101.67:5432", // initial connection destination, e.g. Kubernetes ClusterIP
    actual_destination="10.42.2.80:5432", // actual destination after NAT (iptables, IPVS, Cilium LB)
    status="failed", // or "ok"
}
Another method to gather error statistics involves parsing Postgres logs. This approach not only helps you identify specific errors but also enables tracking errors in Postgres background processes. Coroot automatically parses logs of every container on the node, extracts recurring patterns, and exposes the container_log_messages_total metric.
container_log_messages_total{
    container_id="/k8s/default/db-main-0/postgres",
    level="error",
    pattern_hash="e05043527d1e64109f71edc1dc3a817d",
    sample="UTC [35247] ERROR: canceling statement due to statement timeout",
    source="stdout/stderr",
}
This works seamlessly for containerized applications as well as for systemd services and AWS RDS instances.
Postgres locks
Interestingly enough, when it comes to monitoring locks in Postgres, most tools suggest examining the count of locks obtained from the pg_locks view. However, Postgres DBAs often rely on their black magic SQL queries to identify the specific query causing a lock.
To effectively troubleshoot locking-related issues, we only need to gather metrics that address two key questions:
- Are there queries awaiting locks?
Using the pg_connections metric enables Coroot to pinpoint the specific queries that are waiting for locks:
pg_connections{
    namespace="default",
    pod="db-main-0",
    user="demo",
    db="demo",
    query="select * from products where id = any ( ? )",
    state="active",
    wait_event_type="Lock",
}
- Which query is holding the lock?
The pg_lock_awaiting_queries metric displays the number of queries waiting for the lock held by a specific query:
pg_lock_awaiting_queries{
    namespace="default",
    pod="db-main-0",
    user="postgres",
    db="demo",
    blocking_query="vacuum full products",
}
Getting back to our failure scenario, let’s look at these metrics:

Voilà! No need for guesswork or manual SQL queries – it’s clear that the vacuum full products query is causing our application’s queries to be blocked.
Failure #3
Another problem with most existing Postgres dashboards is that they show metrics for just one Postgres instance. If you use an HA cluster for fault tolerance or scalability, you’d want to monitor the entire cluster, not each instance separately. In my case, I’m using an HA Postgres cluster with three instances managed by Patroni which handles failover and replication for all instances in the cluster.
Let’s simulate a failure of the primary Postgres instance to see the failover mechanism in action, and how it affects our client app. To achieve this, I’ll use the following Chaos Mesh specification:
kind: PodChaos
apiVersion: chaos-mesh.org/v1alpha1
metadata:
  namespace: default
  name: primary-pg-failure
spec:
  selector:
    namespaces:
      - default
    labelSelectors:
      spilo-role: master
  mode: all
  action: pod-failure
Given the time required to detect the unavailability of the primary instance, the failover took only 30 seconds. However, this short interruption inevitably affected the catalog service that was executing queries on the primary Postgres instance.
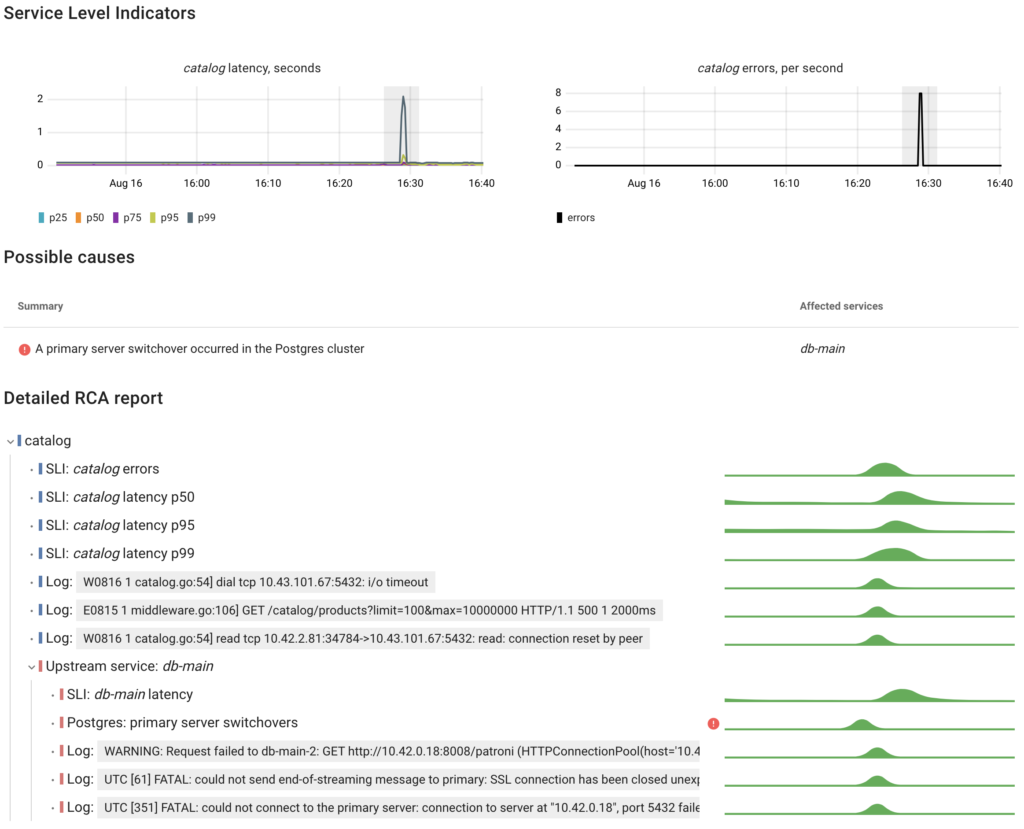
To determine the current cluster role of each Postgres instance, Coroot utilizes metadata provided by the Postgres Operator through Pod labels:
kube_pod_labels{
    label_cluster_name="db-main",
    label_spilo_role="master",
    namespace="default",
    pod="db-main-2",
}
As a result, every change in the cluster’s topology can be detected:

Now we understand that the original primary instance db-main-2 became unavailable. Patroni detected this and promoted db-main-0 to the role of the new primary.
On another note, I want to emphasize how valuable log-based metrics are when dealing with previously unknown types of issues. Having a summary of the most relevant errors simplifies troubleshooting greatly.
Conclusion
The main takeaway from this post is that only the right “telling” metrics can help pinpoint the causes of problems over those that are easy to gather. The best way to tell them apart is by battle-testing them on real failure scenarios.
The great news is that you don’t have to go through this process on your own. We consistently apply this approach to develop Coroot, ensuring that any engineer using it can troubleshoot effectively.
Try Coroot Enterprise now (14-day free trial is available) or follow the instructions on our Getting started page to install Coroot Community Edition.
If you like Coroot, give us a ⭐ on GitHub️ or share your experience on G2.
Any questions or feedback? Reach out to us on Slack.

