Arie van den Heuvel is an engineer, a System and Application Management Specialist, and a valued member of our community. Below he has shared his journey using Coroot, and how it has helped improve observability for his team. You can read more of Arie’s writing and support the resource articles he has created for open source on his blog.
Discovering Coroot
A year ago, with a new application architecture coming our way, I was assigned with a task to investigate the future monitoring possibilities for our team. We are a small group keeping roughly 600 non-standard servers up and running that are responsible for safe and fast vessel voyage handling and communications with key partners.
Currently, we use CheckMK and Graylog to get a grip on our environment, which consists of more or less monolithic, SOA Linux and windows architectures running in VMware, with some on remote sites. The new upcoming system is replacing a 20-year-old ERP application, which is a microservices architecture in a docker k8s containerized environment. This is something that is going to happen with a lot of our applications in the future.
The developers delivering the new system are working in a modern DevOps style, so logically things like Istio, Grafana and Prometheus are already in place. Researching online to compare monitoring and observability systems, we soon found out that all of them require a lot of work to set up and get a visible working oversight of the coming system.
—And then, there was Coroot. I don’t even know how I bumped into it, but as someone liking things simple that can be managed by large teams, I immediately loved it.
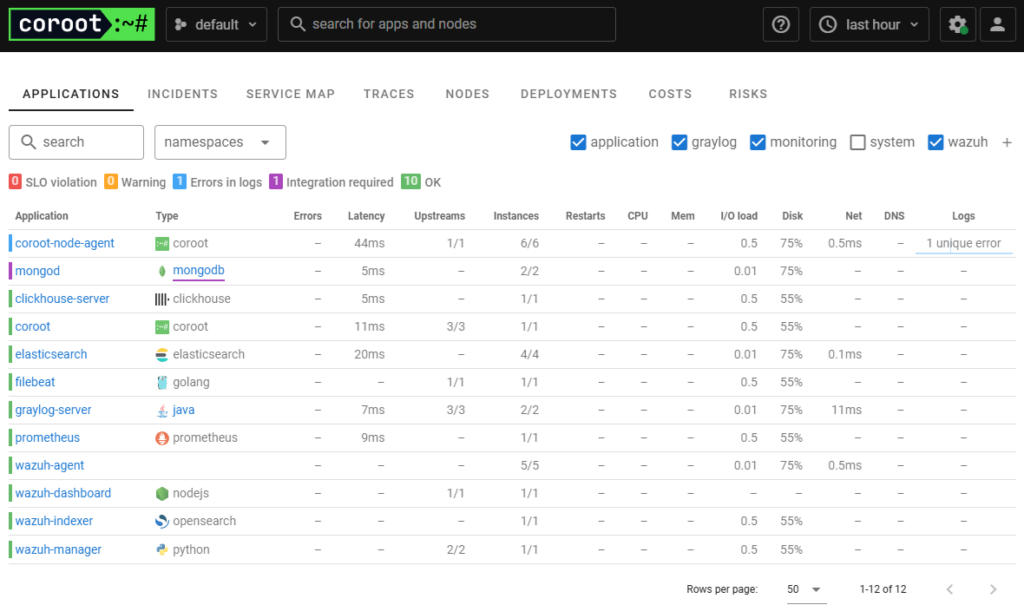
Coroot’s Application Level View
I set up a small proof-of-concept on a Ubuntu Linux laptop that has some docker containers running with a Coroot version that did not had RBAC in it at the time. I did the docker setup – and only had struggles with some ports already in use. After that, I gave a demonstration to my team so they could get a grip to what is coming. Coroot even shows local services like Redis and ntopNG running on the laptop. Recently I gave my team a microservices architecture training to get them acquainted with this new architecture, and why we need this kind of observability.
Instant out-of-the-box insights
It’s an amazing experience to set something up in less then thirty minutes and almost immediately attain a visual knowledge of containerized applications. I recommend anyone using a containerized landscape or running services locally to use Coroot because of the insights it shows for your IT services.
Things that are immediately available after starting Coroot up are:
- Automatic service discovery
- Pre-built dashboards
- CPU, Memory, and Disk storage insights
- DNS information (if applicable)
- Network I/O metrics
- Application logs and patterns
- Continuous profiling heatmaps
- Traces
- JVM behavior insights
- Deployment statuses
- Database response times
- Customizable SLOs
- The cost of running your setup on AWS, Azure or GCP
With minimal additional set-up, there are also metrics and state information available for different databases like Redis, mongodb, MySQL and PostgreSQL.
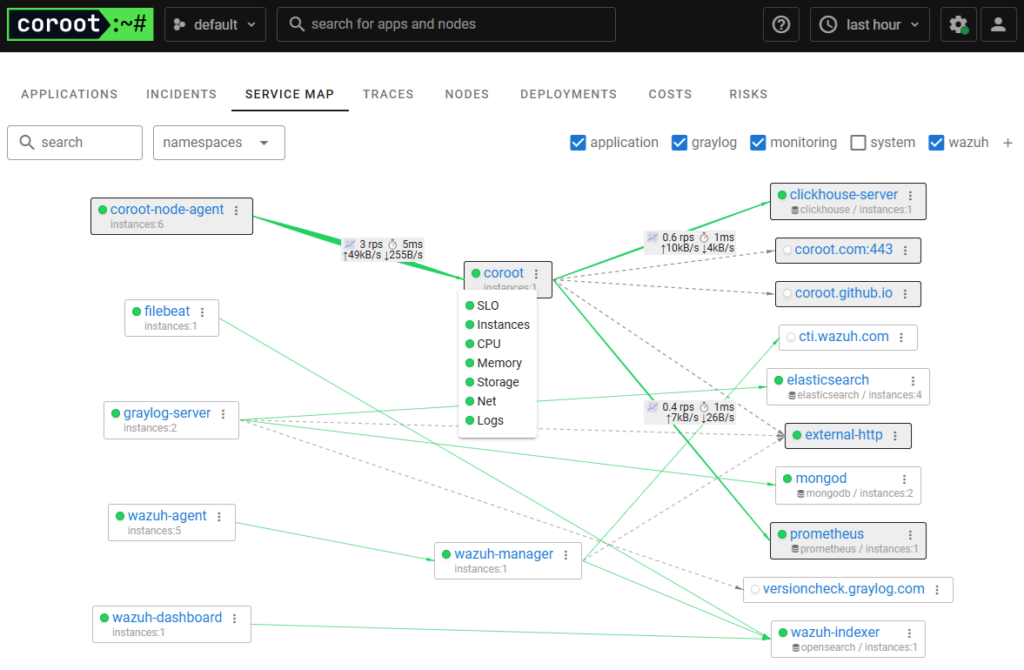
Servicemap View
To boost things up, we are now examining a bare metal setup as shown in the pictures above and monitor some servers running Graylog, Elasticsearch and Wazuh on bare metal. It just works and gives us application level observability right out of the box that helps. Because Coroot is based on observing containers it puts every application running as the same service name together.
We really like that Coroot has modern-quality observability covering all aspects of applications. In addition, notifications are possible to configure with commonly used team messaging software such as Pagerduty, Slack, Microsoft Teams, and others. RBAC has now also been reliably added to its set of features.
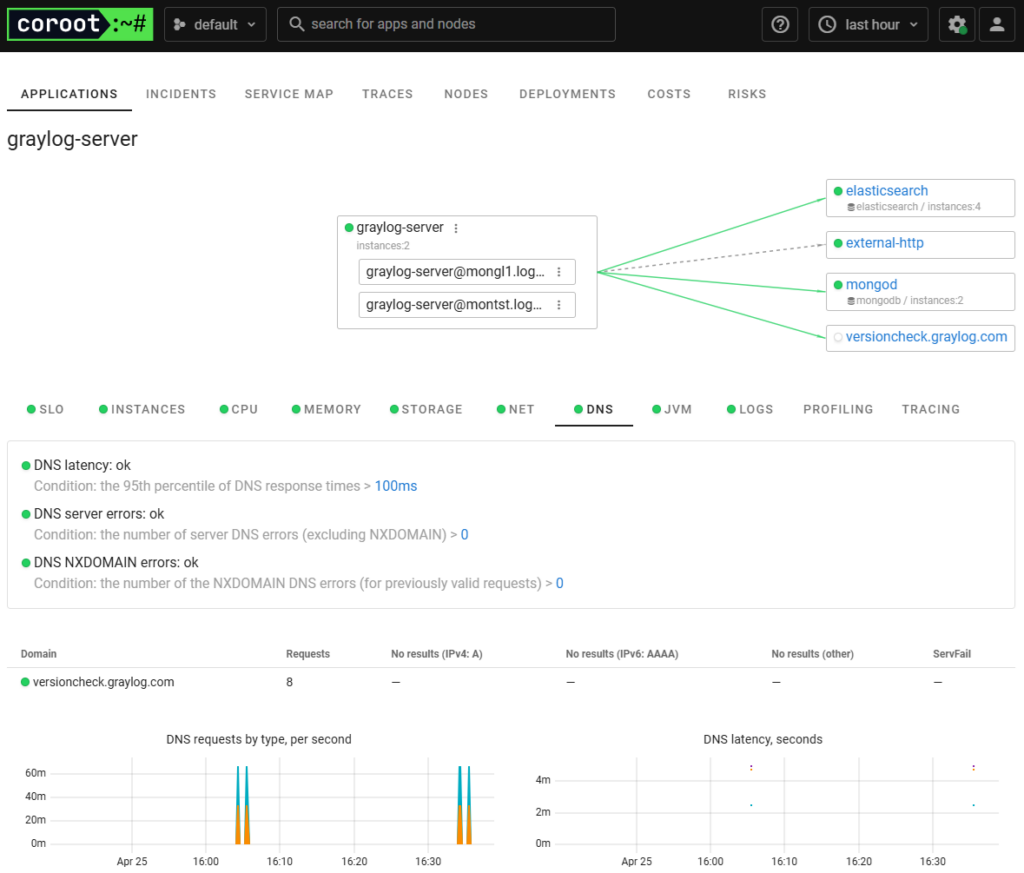
DNS QOS for Graylog and other insights
Observability for everyone
Coroot uses eBPF to gather your telemetry data with a node-agent that sends the data to Coroot and is stored in Prometheus and Clickhouse. Next to that, there is keen intelligence in Coroot to visualize the data it collects. Because of eBPF, Coroot works in Linux with a minimum kernel version of 5.1 or later. In the paid version there is AI in place that can examine a problem and point to the place that causes that problem with suggestions on how to fix it. There is good thinking on using AI for this.
The people behind Coroot are smart and know what they are doing. Development is an ongoing thing for Coroot, making deployment more easy every day. There is an open source Community and paid Enterprise edition, and with being open source they are fully present on Github. Documentation is well in place on their website. When there was a problem like the one we experienced with a new node-agent, they react quickly on Github, solving our problem in under 30 minutes. Good work!