Troubleshooting Java Applications with Coroot
 Nikolay Sivko
Java applications run on top of the JVM — a powerful but complex runtime environment that re-implements many OS features. It has its own memory management, garbage collector, and dynamic code compiler (JIT). While these features help with performance and portability, they often make troubleshooting a real challenge.
At Coroot, we recently improved our support for continuous profiling in JVM-based applications. And whenever we test something new, we stick to our favourite approach: failure-driven observability. So, let’s introduce a few JVM-level issues on purpose and see how profiling helps catch them in action.
This time, I’ll use the otel-demo — a web application simulating an online telescope shop. It consists of multiple microservices implemented in various programming languages, making it a great playground for testing observability tools in realistic conditions.
Here’s how the service map looks in Coroot:
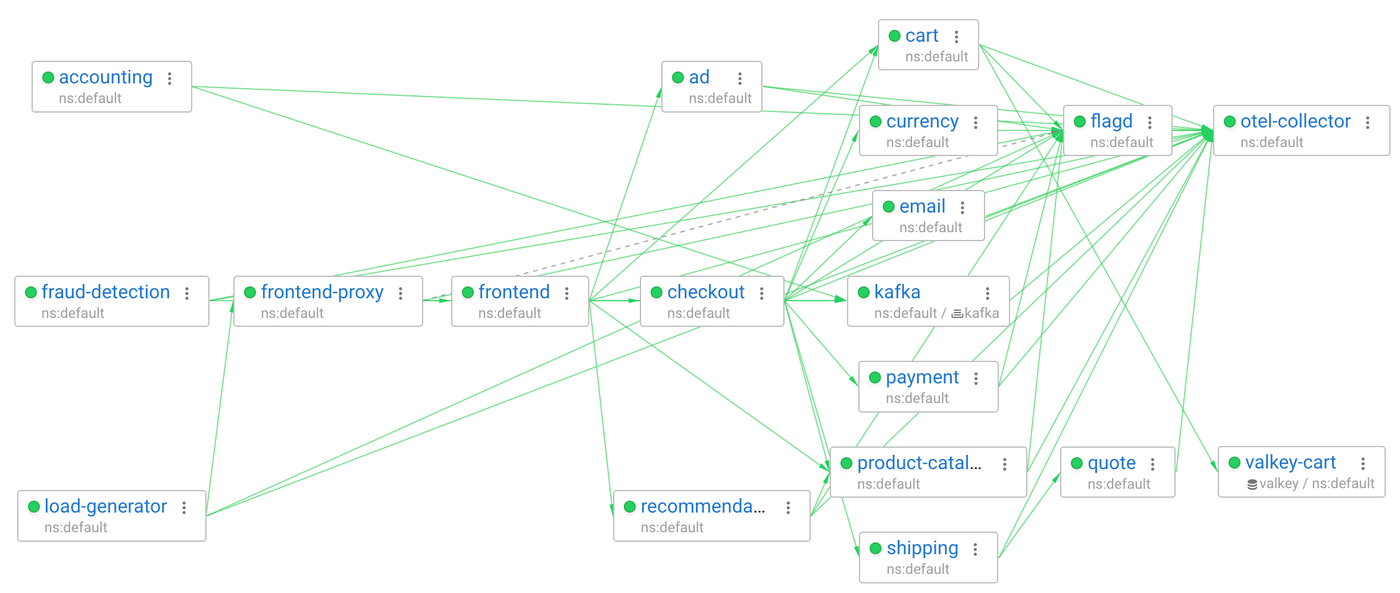
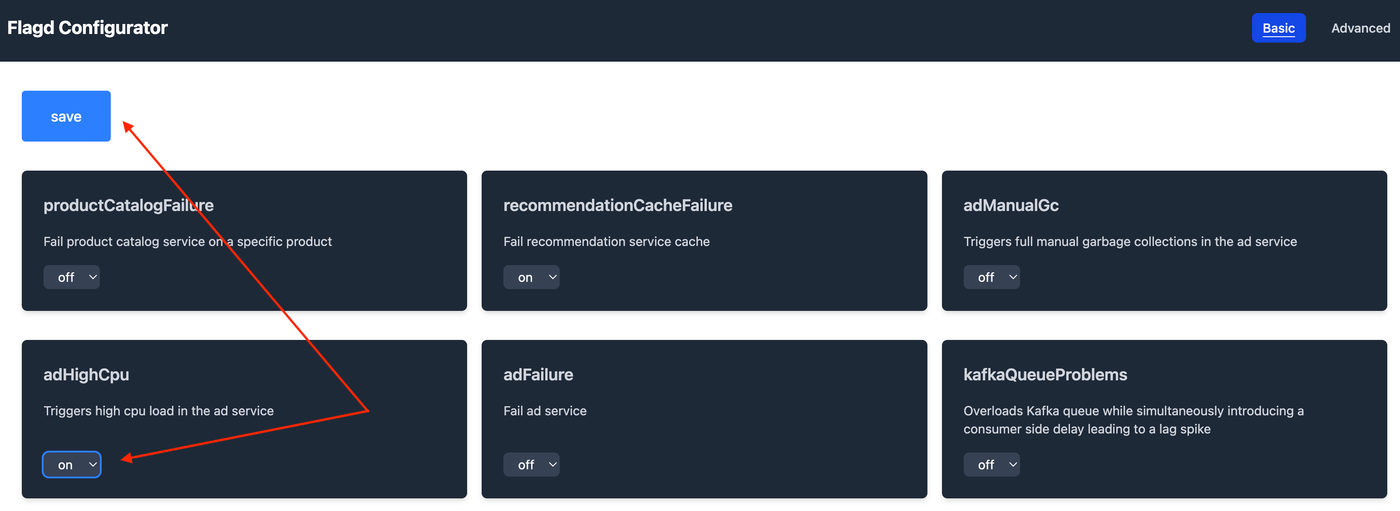
The ad service is written in Java. Conveniently, otel-demo comes with a set of built-in failure scenarios that can be toggled via feature flags. In this post, I’ll focus on two of them:
- adHighCPU – triggers high CPU load in the ad service
- adManualGC – forces full manual garbage collections in the ad service
But since we’re dealing with a distributed system, it would be unfair (and no fun) to start with the known failing service. Instead, let’s go through a more realistic flow and begin troubleshooting from frontend, the service that handles all incoming traffic.
High CPU usage
Let’s enable the adHighCPU feature flag and see how it affects the SLIs (Service Level Indicators) of the frontend service.
Almost immediately, we can spot an anomaly in the frontend’s latency. Coroot automatically detects a strong correlation between this latency spike and increased response times from the ad service.
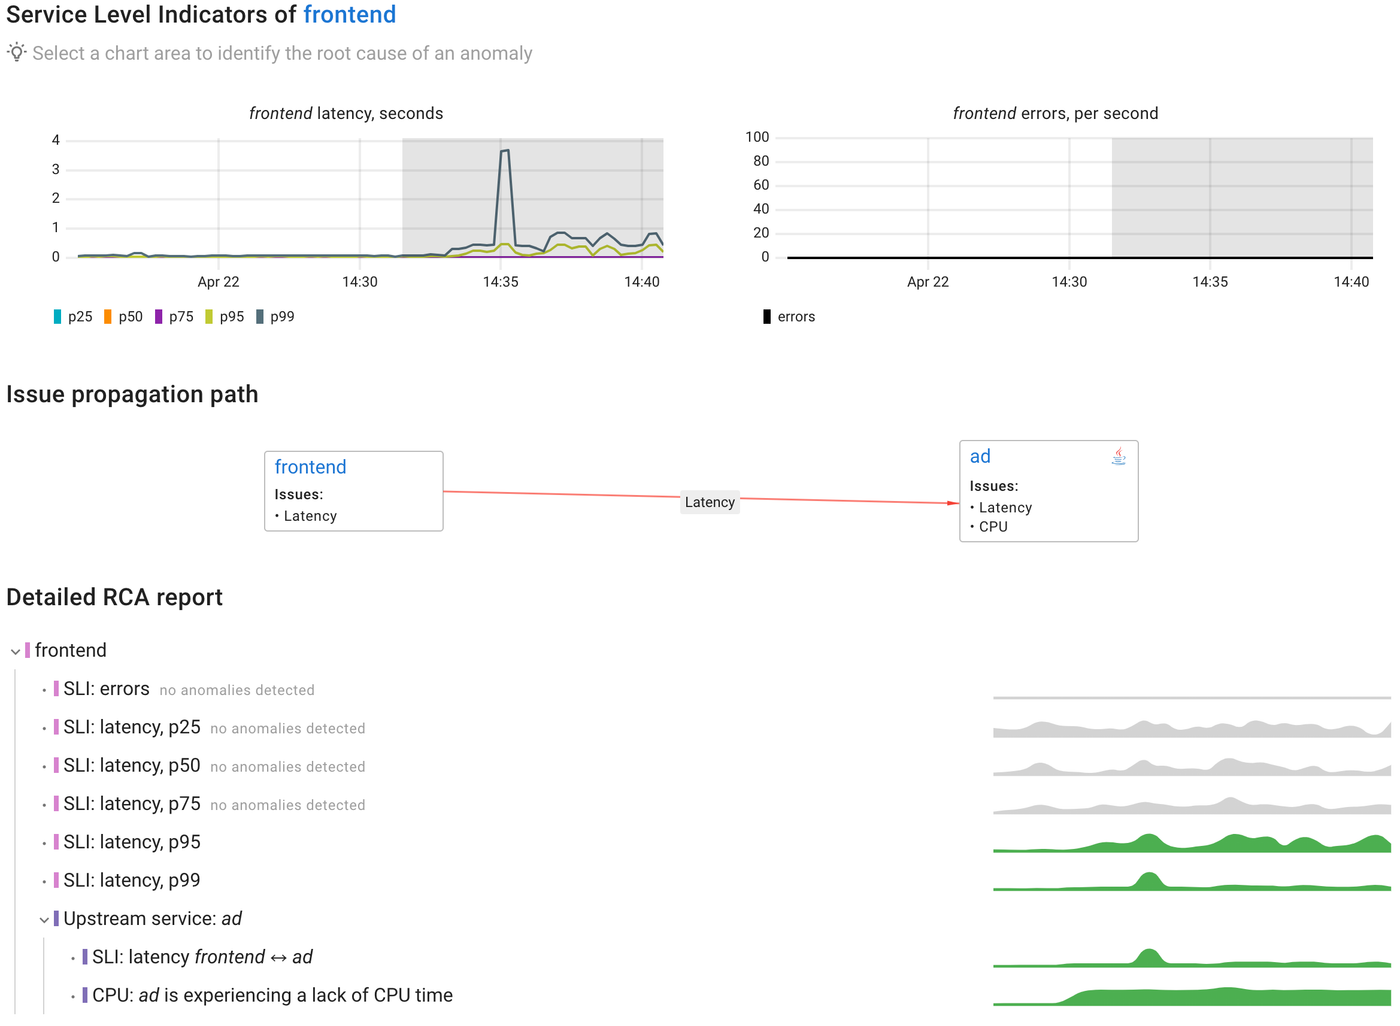
Digging deeper, Coroot also highlights that the slowdown in the ad service is related to CPU delay, meaning the service is struggling to get enough CPU time.
That’s cool, but this isn’t an actionable answer yet.
We know something’s wrong with the ad service’s CPU usage, but what exactly is eating the CPU? Let’s dig into its CPU profiling. In Coroot, you can select the anomaly in CPU usage and compare the current profile with the previous period. This helps spot what changed and which functions are suddenly consuming more resources.
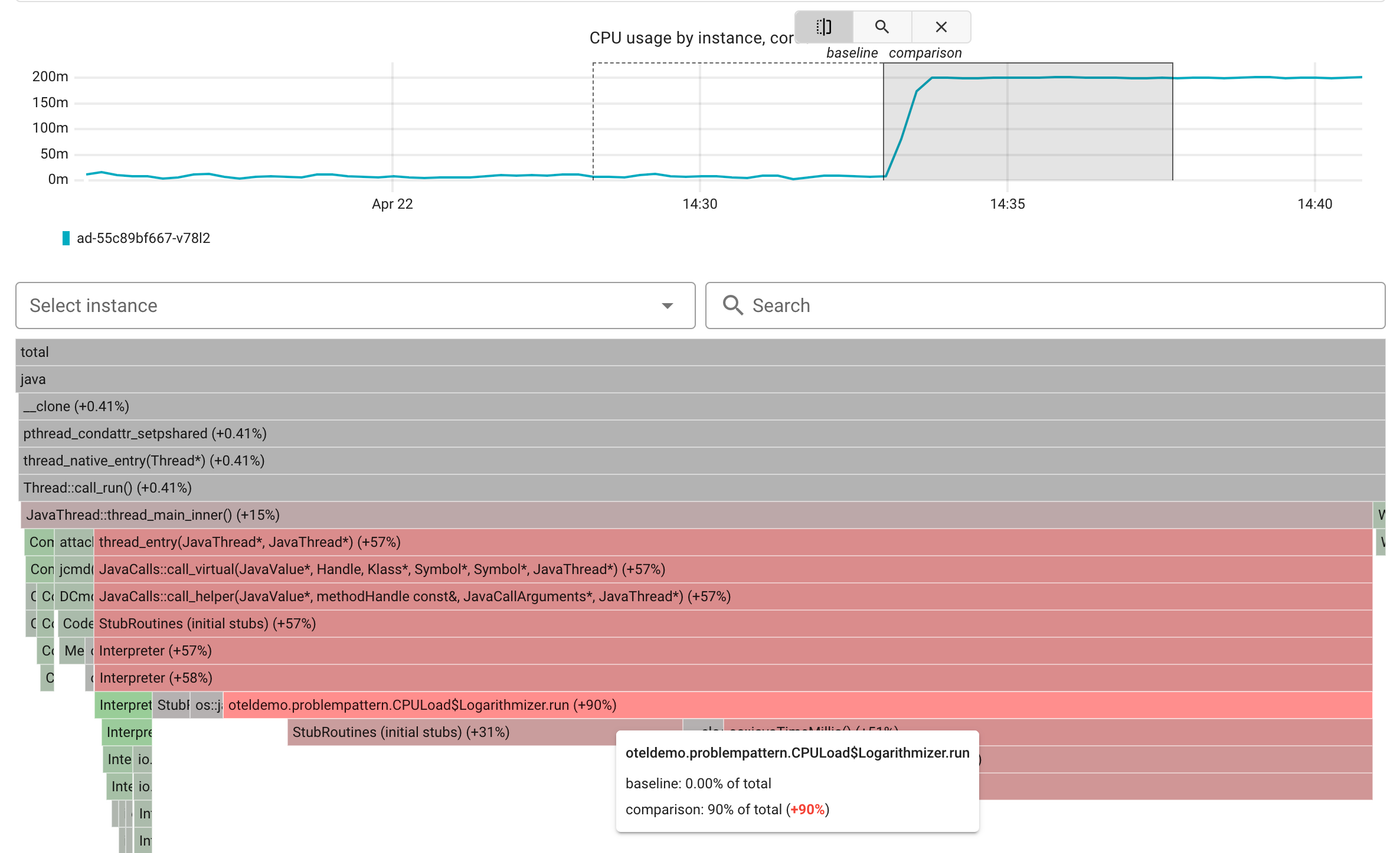
Now it’s pretty clear. We can see that the oteldemo.problempattern.CPULoad function is consuming 90% more CPU time compared to the baseline. This function is part of the simulated failure and intentionally runs a tight loop to burn CPU cycles. It doesn’t do any real work, it’s just there to waste CPU time. And thanks to continuous profiling, we can catch it immediately without any guesswork.
Garbage Collection
After enabling the adManualGc feature flag, we notice a spike in the frontend service’s latency, especially in the p95 and p99 percentiles. There are no errors, but responses are clearly getting slower.
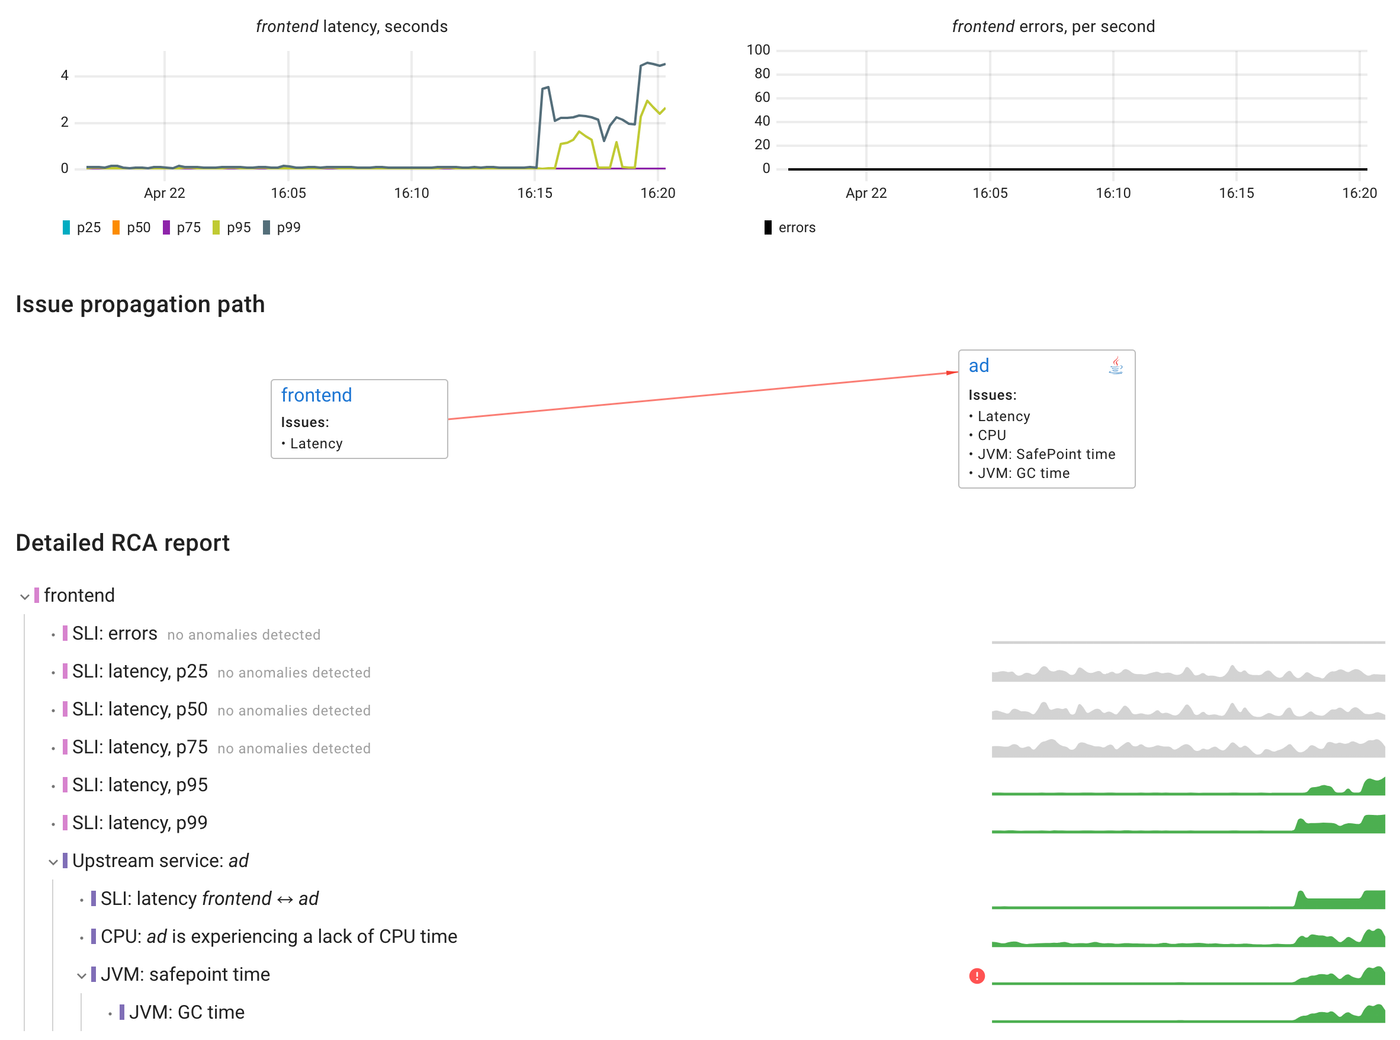
Tracing the issue through the system, it leads us to the ad service. This time, the problem isn’t CPU usage, instead, it’s the JVM spending a lot more time in garbage collection. We also see increased safepoint time, which occurs when the JVM pauses all application threads to perform internal operations like GC or thread coordination.
Now, let’s take a look at how this shows up in continuous profiling.
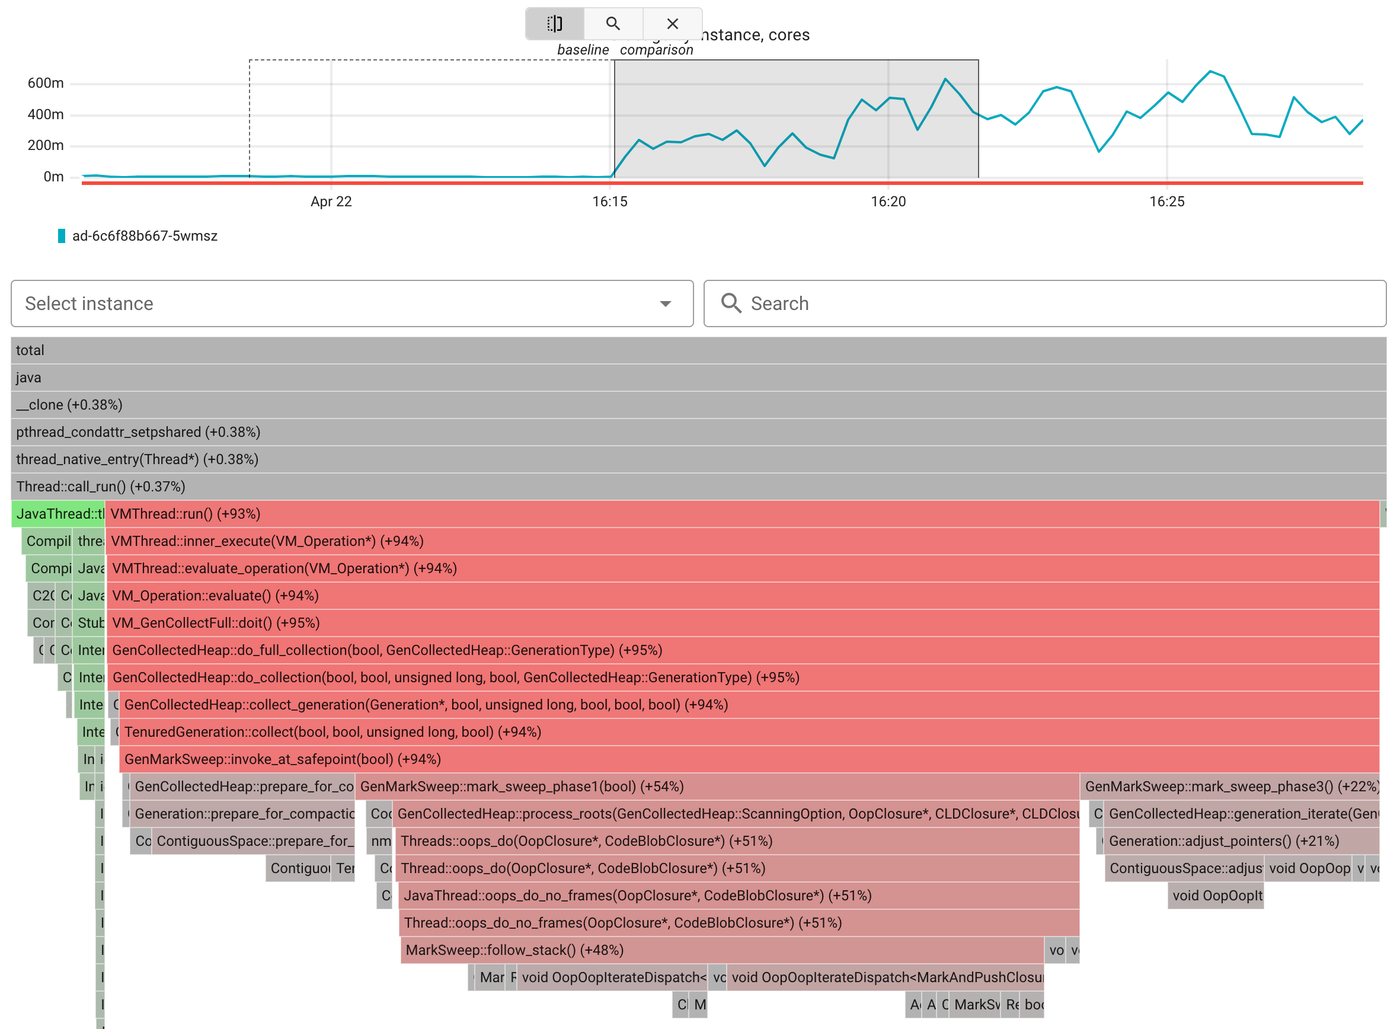
Since Coroot uses eBPF-based profiling, it captures both user-space and native JVM code, including the garbage collector itself. So even if the app wasn’t running our code, we can still see exactly where the time went.
How it works
Alright, we’ve seen how Coroot helps spot issues in Java apps. But I still think it’s super important to understand what’s actually going on under the hood if you want to really trust a tool.
SLI metrics in Coroot are collected using eBPF, with no code changes or sidecars required. These metrics include key indicators like request rate, error rate, and latency histograms. All of this is gathered directly at the kernel level by observing socket-level communication between services. This allows Coroot to automatically detect internal service dependencies and measure their performance in real time, without relying on application-level instrumentation or logs.
JVM-specific metrics are collected automatically from the hsperfdata_* files. This is a standard mechanism the JVM uses to expose internal performance counters. These files are created in a temporary directory and contain data such as heap usage, GC stats, thread counts, and class loading metrics. The JVM writes to them periodically, and tools like jstat use this data to access JVM telemetry without attaching directly to the process.
For continuous profiling, Coroot uses eBPF as well, capturing execution paths at the kernel level with minimal overhead. However, because the JVM relies heavily on JIT compilation, the generated native code does not include symbolic information by default. In other words, we see memory addresses, but not the actual method names. To make the profiles readable and useful, the JVM needs to expose symbol information. This can be generated using the jcmd
Coroot automates this step by periodically calling jcmd in the background. However, the JVM must be started with the -XX:+PreserveFramePointer option. This allows for accurate stack traces and proper symbolization of JIT-compiled code, with only a small performance overhead (typically around 1-3%).
Conclusion
Troubleshooting Java apps can be tricky, especially with everything the JVM does under the hood. But once you understand how things work and have the right tools, it gets a lot easier. With Coroot, you get the full picture without extra setup, and continuous profiling helps you catch real issues as they happen.
Try Coroot to get deep, code-level visibility into your Java services.
Use the Coroot Community Edition for free, or start a free trial of Coroot Enterprise Edition for advanced features.
If you like Coroot, give us a ⭐ on GitHub.
Questions or feedback? Join us on Slack.