Working with GPUs on Kubernetes and making them observable
 Nikolay Sivko
GPUs are everywhere powering LLM inference, model training, video processing, and more. Kubernetes is often where these workloads run. But using GPUs in Kubernetes isn’t as simple as using CPUs.
You need the right setup. You need efficient scheduling. And most importantly you need visibility.
This post walks through how to run GPU workloads on Kubernetes, how to virtualize them efficiently, and how Coroot helps you monitor everything with zero instrumentation or config.
Running GPU Workloads on Kubernetes
Running GPU workloads on Kubernetes is totally doable. But it takes a bit of setup.
It starts with your nodes. Whether you’re running in the cloud or on bare metal, your cluster needs machines with physical GPUs. Most cloud providers support GPU-enabled node pools, and provisioning them is usually straightforward.
Once the hardware is in place, the next step is software. For Kubernetes to schedule and run GPU workloads, it needs:
- NVIDIA GPU drivers, installed on each node
- The NVIDIA container runtime, so containers can access the GPU
- The NVIDIA device plugin, so Kubernetes knows how to handle GPU resource requests
You can install all of this manually. But it’s fiddly and error-prone. That’s where the NVIDIA GPU Operator comes in. It automates the whole setup: installing drivers, configuring the runtime, and deploying the device plugin. Once that’s done, your cluster is GPU-ready.
After that, requesting a GPU is simple. Just add this to your pod spec:
resources:
  limits:
    nvidia.com/gpu: 1
Kubernetes will handle the rest: scheduling your pod onto a node with an available GPU and assigning it to the container.
Of course, not every workload needs an entire GPU to itself. And that’s where GPU virtualization becomes really useful.
Virtualizing GPUs in Kubernetes
By default, Kubernetes treats GPUs as exclusive resources. One pod per device. But in many real-world cases, that’s overkill. The GPU Operator supports two forms of GPU virtualization that let you safely share a GPU between workloads:
Time-Slicing: Multiple containers take turns using the GPU in rapid bursts. It’s a great fit for bursty inference workloads, batch jobs, or anything that doesn’t require ultra-low latency.
MIG (Multi-Instance GPU): Available on GPUs like the A100 and H100, MIG lets you partition a single physical GPU into several hardware-isolated instances. Each one behaves like its own dedicated GPU, with its own memory, cache, and compute cores.
Virtualization makes GPUs way more flexible:
- You stop wasting an entire GPU on a tiny batch job
- You get much better overall utilization
- You can safely share GPUs across apps without them stepping on each other
- And you finally have a shot at balancing cost and performance
It’s a game-changer, but only if you can actually see what’s going on.
What observability looks like once GPUs are in play
So, the cluster is set up, the workloads are running, and maybe you’ve even started virtualizing GPUs to get better efficiency. Now comes the tricky part – actually understanding what’s happening.
From the infrastructure side, we want to know:
- How many GPU-enabled nodes do we have right now?
- Which GPUs are actually doing work, and which are just burning budget?
- What’s the current GPU and memory utilization across the fleet?
And sure, if you’re in the cloud, temperature and power draw might feel like someone else’s problem. But it’s still good to know. Somewhere out there, your model is warming the planet one token at a time. Mother Nature says hi. 🌱
From the application side, the questions change:
- Which GPUs is this app actually using?
- How much compute and memory is it consuming?
- Is it sharing the GPU with something else?
- And if so who’s the noisy neighbor hogging all the resources?
This isn’t just about curiosity. It’s about avoiding slowdowns, catching inefficiencies, and making smart scaling decisions. But here’s the catch: Kubernetes doesn’t tell you any of this.
Coroot’s out of the box GPU observability
Coroot makes any GPU-powered system observable with zero effort. It shows you exactly what’s happening on your GPUs, with no guesswork.
Coroot’s node agent doesn’t rely on sidecars, custom exporters, or magic annotations. Instead, it talks directly to the GPU using NVIDIA’s NVML library the same one behind nvidia-smi.
On startup, the agent looks for libnvidia-ml.so in all the usual (and unusual) places whether it’s installed by the GPU Operator, a package manager, or manually dropped in. If it finds the library, it loads it and starts gathering data.
From there, it:
- Discovers all available GPUs on the node
- Collects real-time metrics utilization, memory usage, temperature, power draw
- Tracks per-process usage using NVML’s process telemetry
- Maps each process back to its container and pod, using Coroot’s existing PID-to-container tracking
So instead of “PID 12345 is using GPU 0,” you get “this container in this pod is using 78% of GPU-xxxx”
And when it comes to virtualized GPUs, Coroot doesn’t just guess. It sees which containers are tied to which GPU UUIDs, even when multiple workloads are time-sharing or using MIG slices on the same physical device. That means:
- You can see which apps are sharing the same GPU
- Understand how each one is using it
- And spot noisy neighbors
All of this is automatic. Just install the agent and let Coroot do the rest.
What GPU observability looks like in Coroot
Once the Coroot agent discovers the GPUs and starts collecting data, all of it flows straight into the Coroot UI ready to explore without any dashboards to build or metrics to stitch together.
Let’s walk through how this looks in practice.
Node-level GPU overview
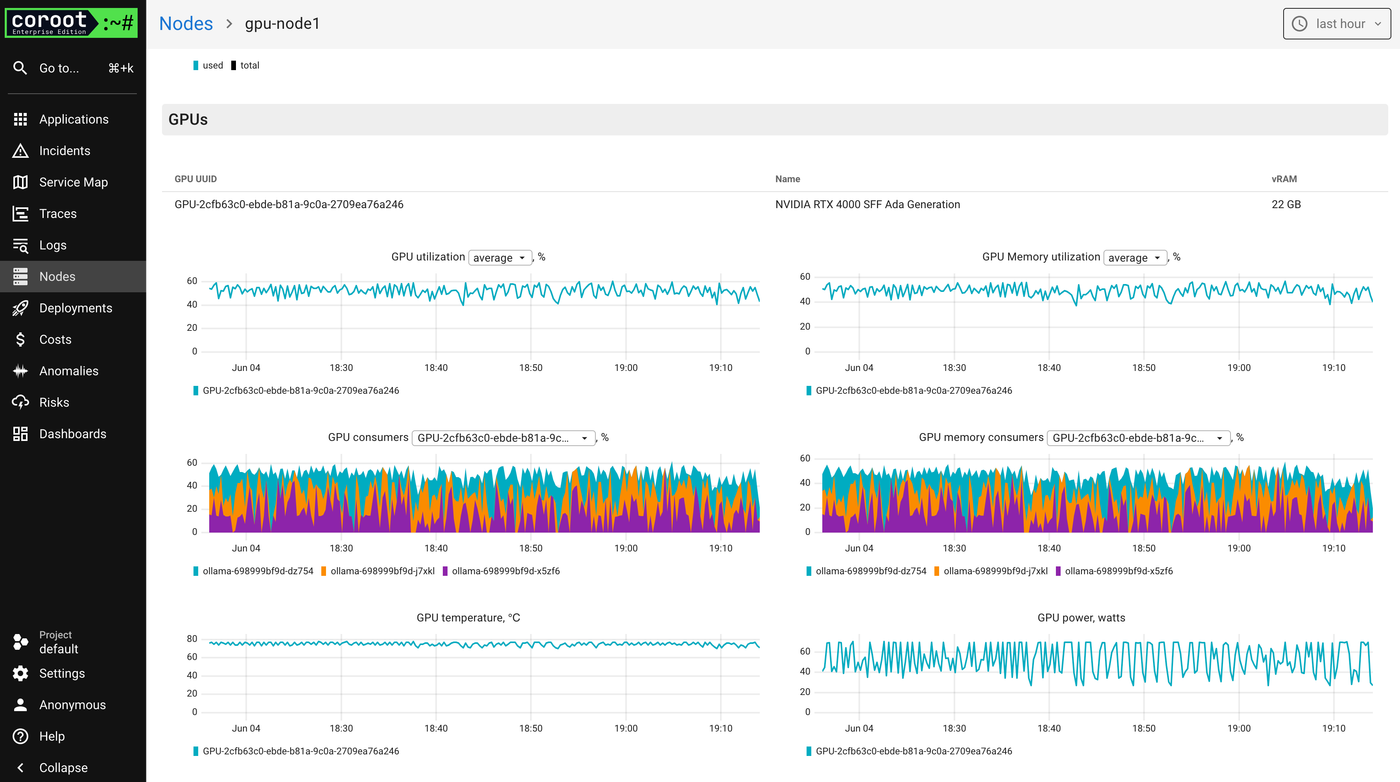
On the node view, Coroot shows everything you’d want to know about the GPUs attached to a specific machine:
- GPU utilization over time
- GPU memory usage
- Top consumers of both compute and memory
- Temperature and power draw
This isn’t just “hey, GPU usage went up.” You can see which containers are contributing to that load and whether the same GPU is being shared between apps.
App-level GPU breakdown
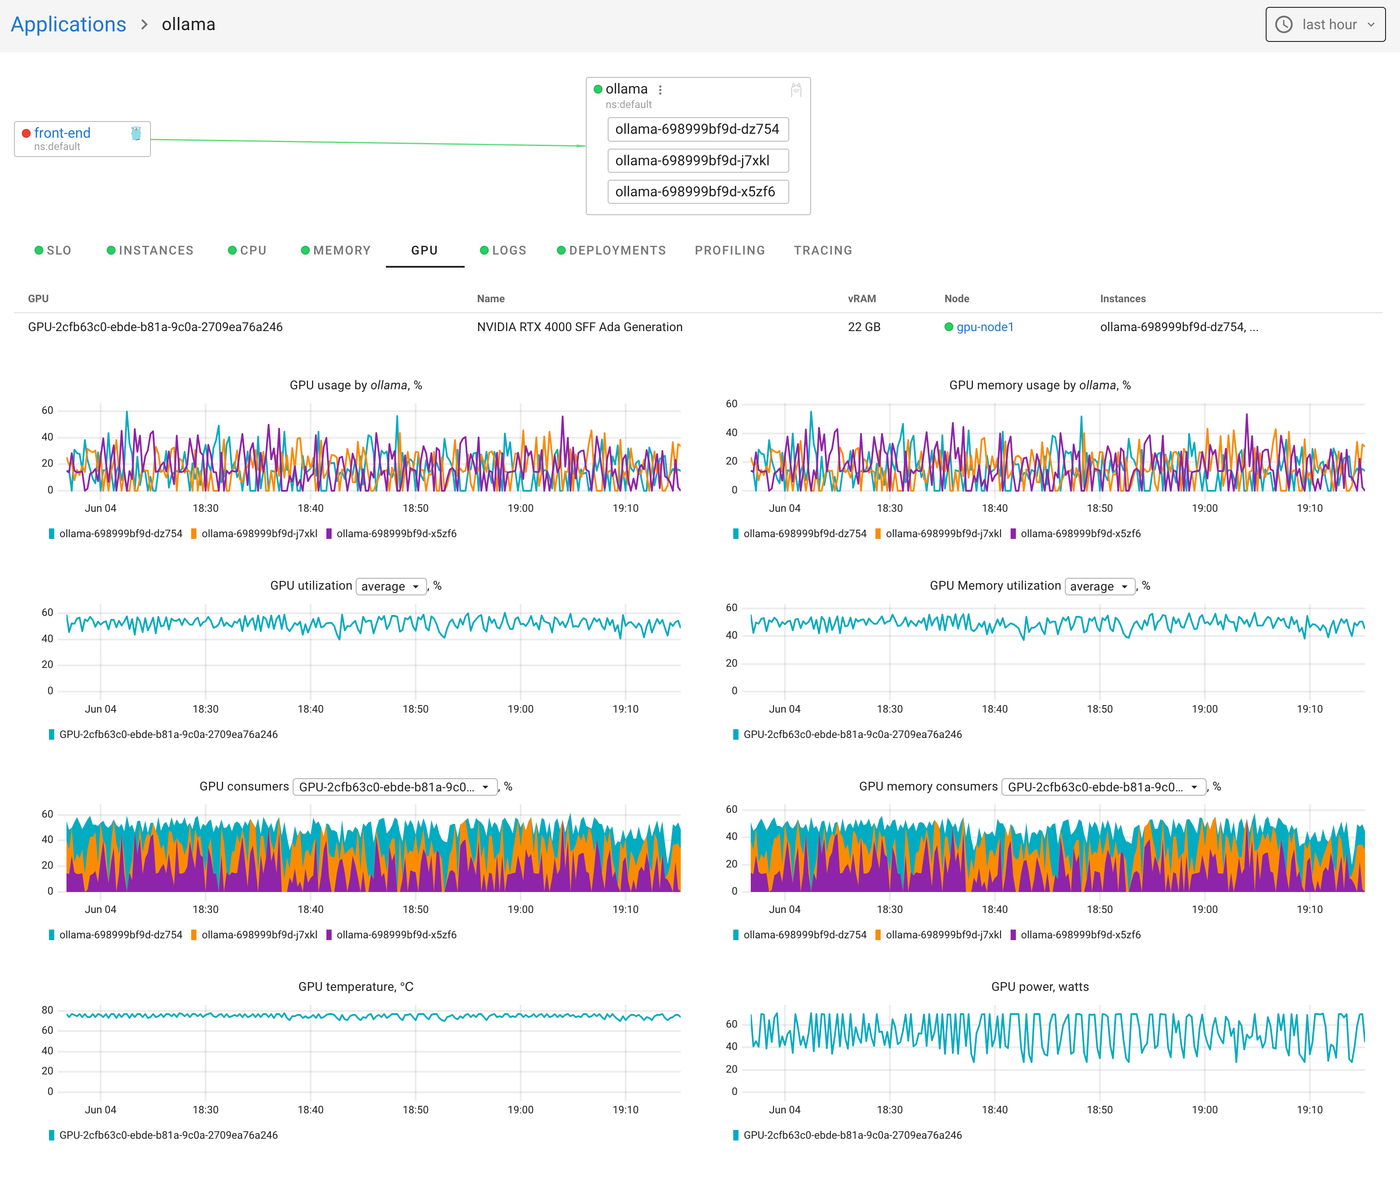
Coroot also surfaces GPU metrics in the context of your application. So you can see:
- How much GPU time your app is using
- How much memory it’s burning
- Which containers are sharing the GPU, and how much each one is using
This is where things get real. If your app is slow, you can check GPU usage alongside CPU, memory, logs, traces, and everything else in one place.
Ready to see what your GPUs are really doing?
GPU workloads aren’t cheap. And they’re rarely simple. Whether you’re running a single inference service or managing dozens of shared GPUs, you need real visibility.
With Coroot, you get that out of the box. No configuration. No guesswork. Install Coroot Community or Coroot Enterprise Edition today!