Metrics, logs & traces
without changing a line of code
Open-source observability powered by eBPF. Deploy in 2 minutes, get full visibility instantly.
Trusted by SREs and DevOps teams at
Everything you need for modern observability
From zero-instrumentation monitoring to AI-powered analytics, Coroot provides comprehensive insights without complexity.
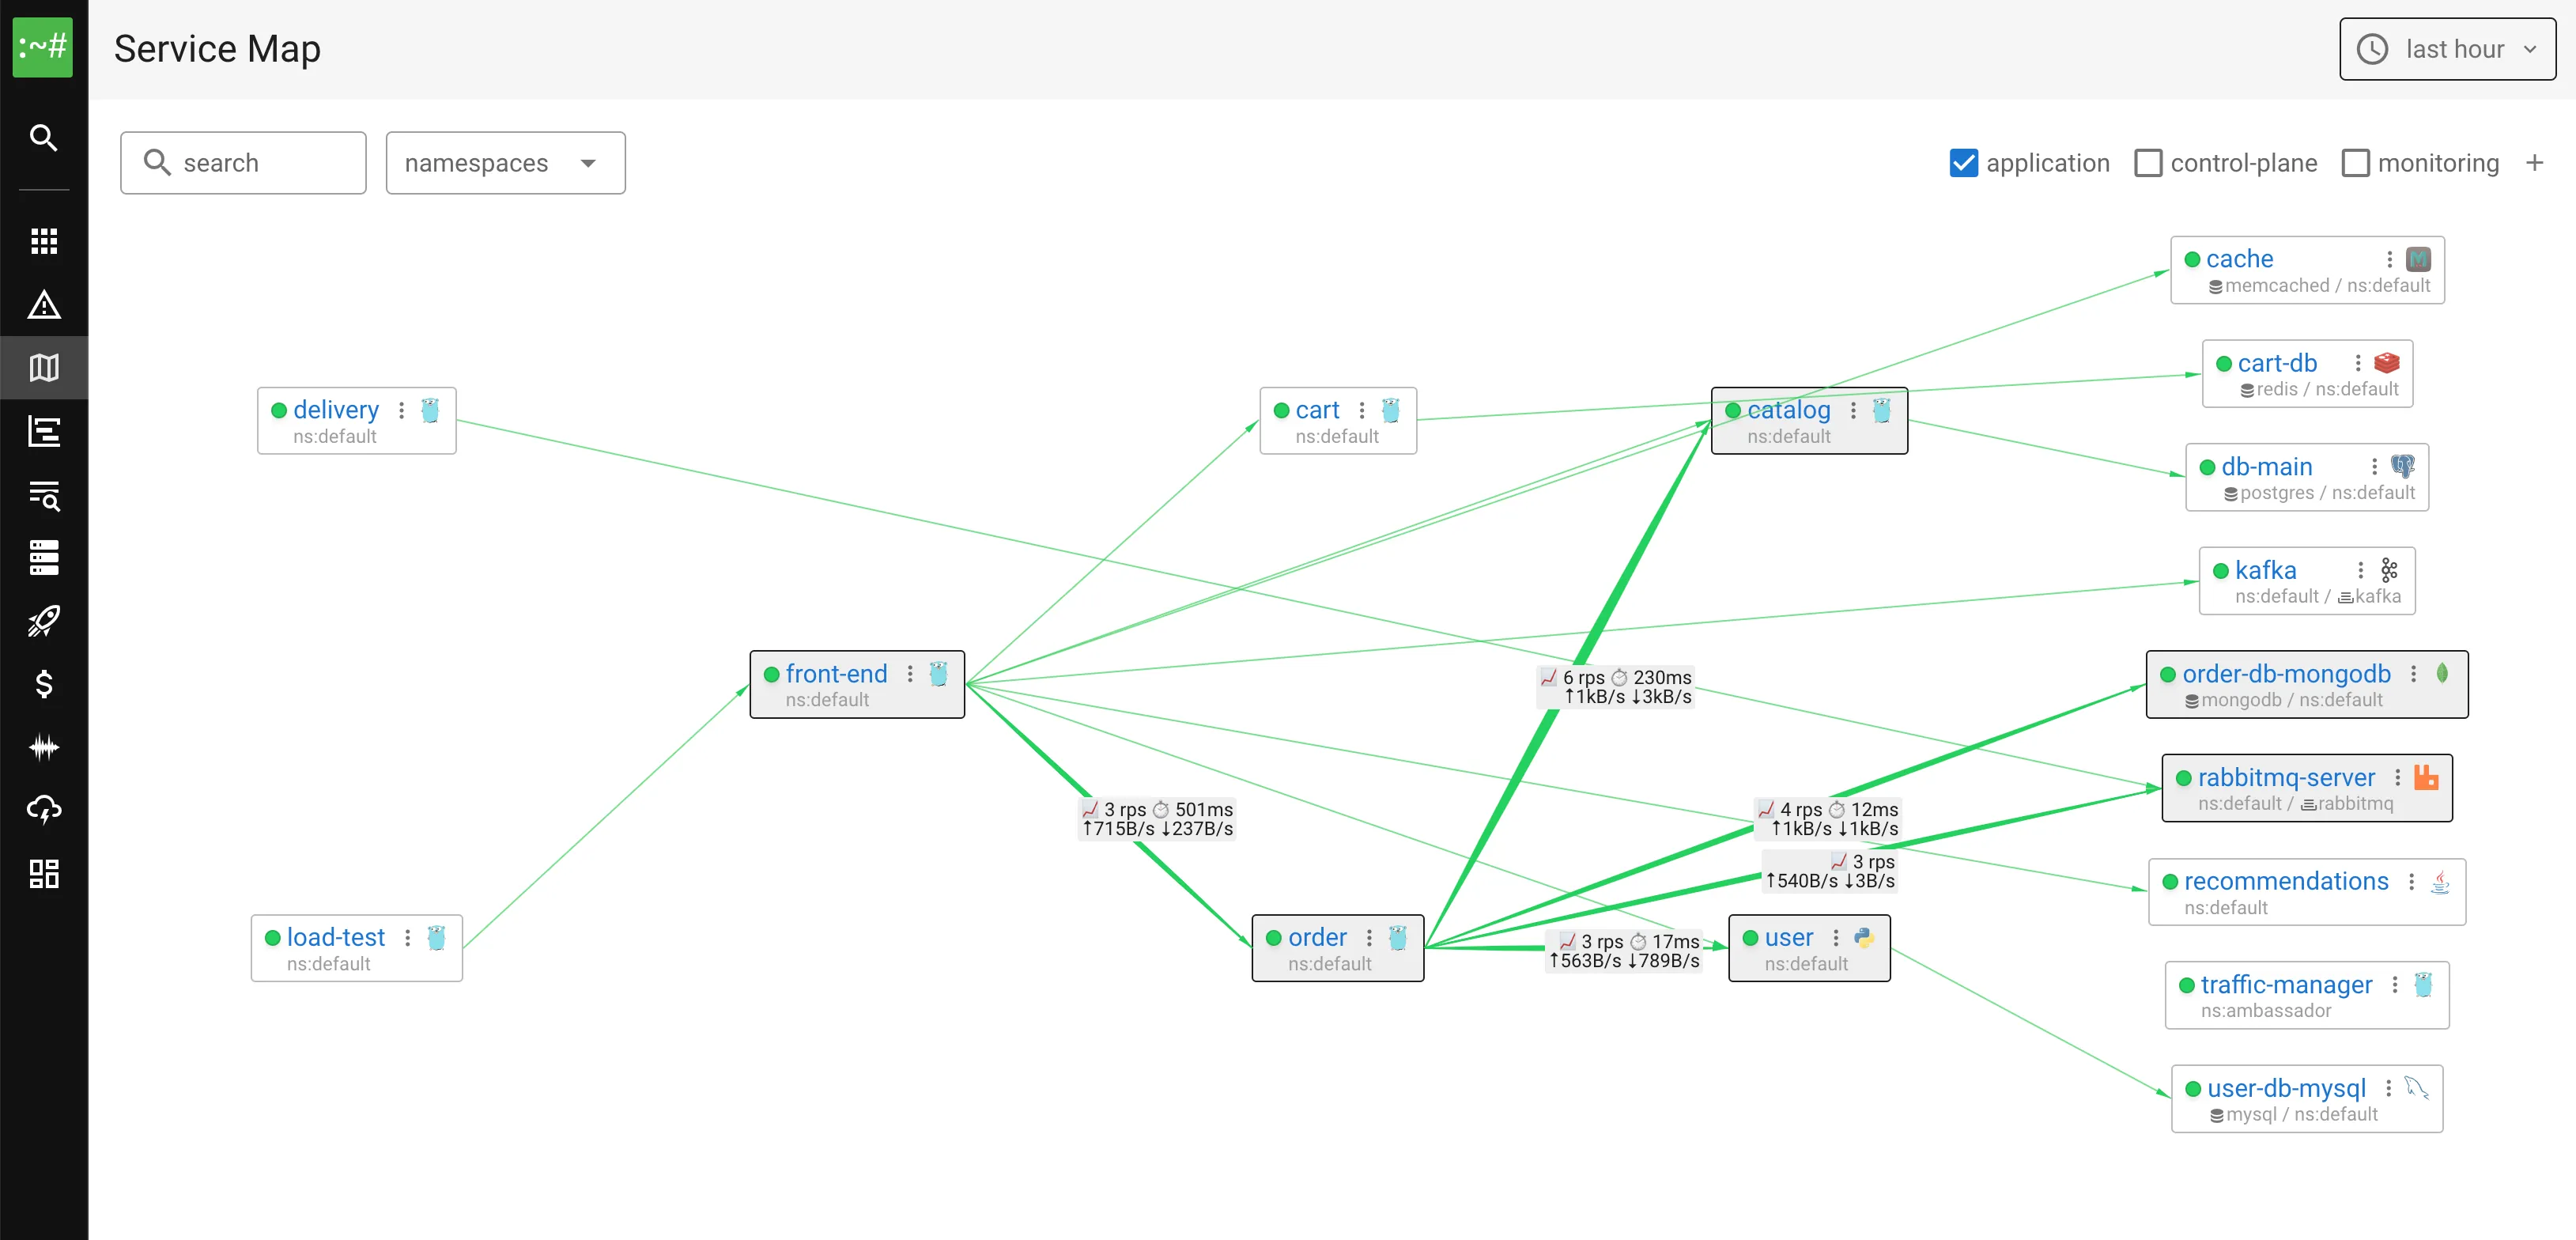
Zero-Instrumentation Observability
Coroot automatically collects metrics, logs, traces, and profiling data with eBPF — no code changes or manual setup. It maps every service and dependency to give you a complete picture of your system, with no blind spots.
Application Health Summary
Coroot gives you a clear, real-time view of every service's health — even at massive scale. Instantly spot issues through live log insights and SLO tracking, so you can focus on keeping performance on target.

Distributed Tracing
See every request's journey from start to finish. Coroot combines eBPF-powered auto instrumentation with traces from OpenTelemetry SDKs to give you complete coverage from modern microservices to legacy apps, with no blind spots and no vendor lock in.

Log Monitoring
Quickly spot issues in your logs. Coroot analyzes them right on the node with minimal overhead, detects severities and recurring patterns, stores them in ClickHouse with over 10x compression ratio, and works seamlessly with any log format.

Continuous Profiling
Coroot continuously profiles your applications, letting you zoom in on CPU spikes down to the exact line of code. Find and fix performance bottlenecks fast, optimize resource usage, and keep your apps running smoothly.

Cloud Cost Insights
You cannot optimize what you cannot measure, and that includes cloud costs. Coroot tracks them automatically without needing access to your cloud account or any extra configuration. It also calculates cross AZ and internet egress costs per application, helping you pinpoint exactly where your budget is going.

Proactive Risk Detection
Coroot scans your system for hidden reliability and security risks like single-instance apps, unreplicated databases, poor replica placement, and publicly exposed services, so you can fix them before they cause trouble.

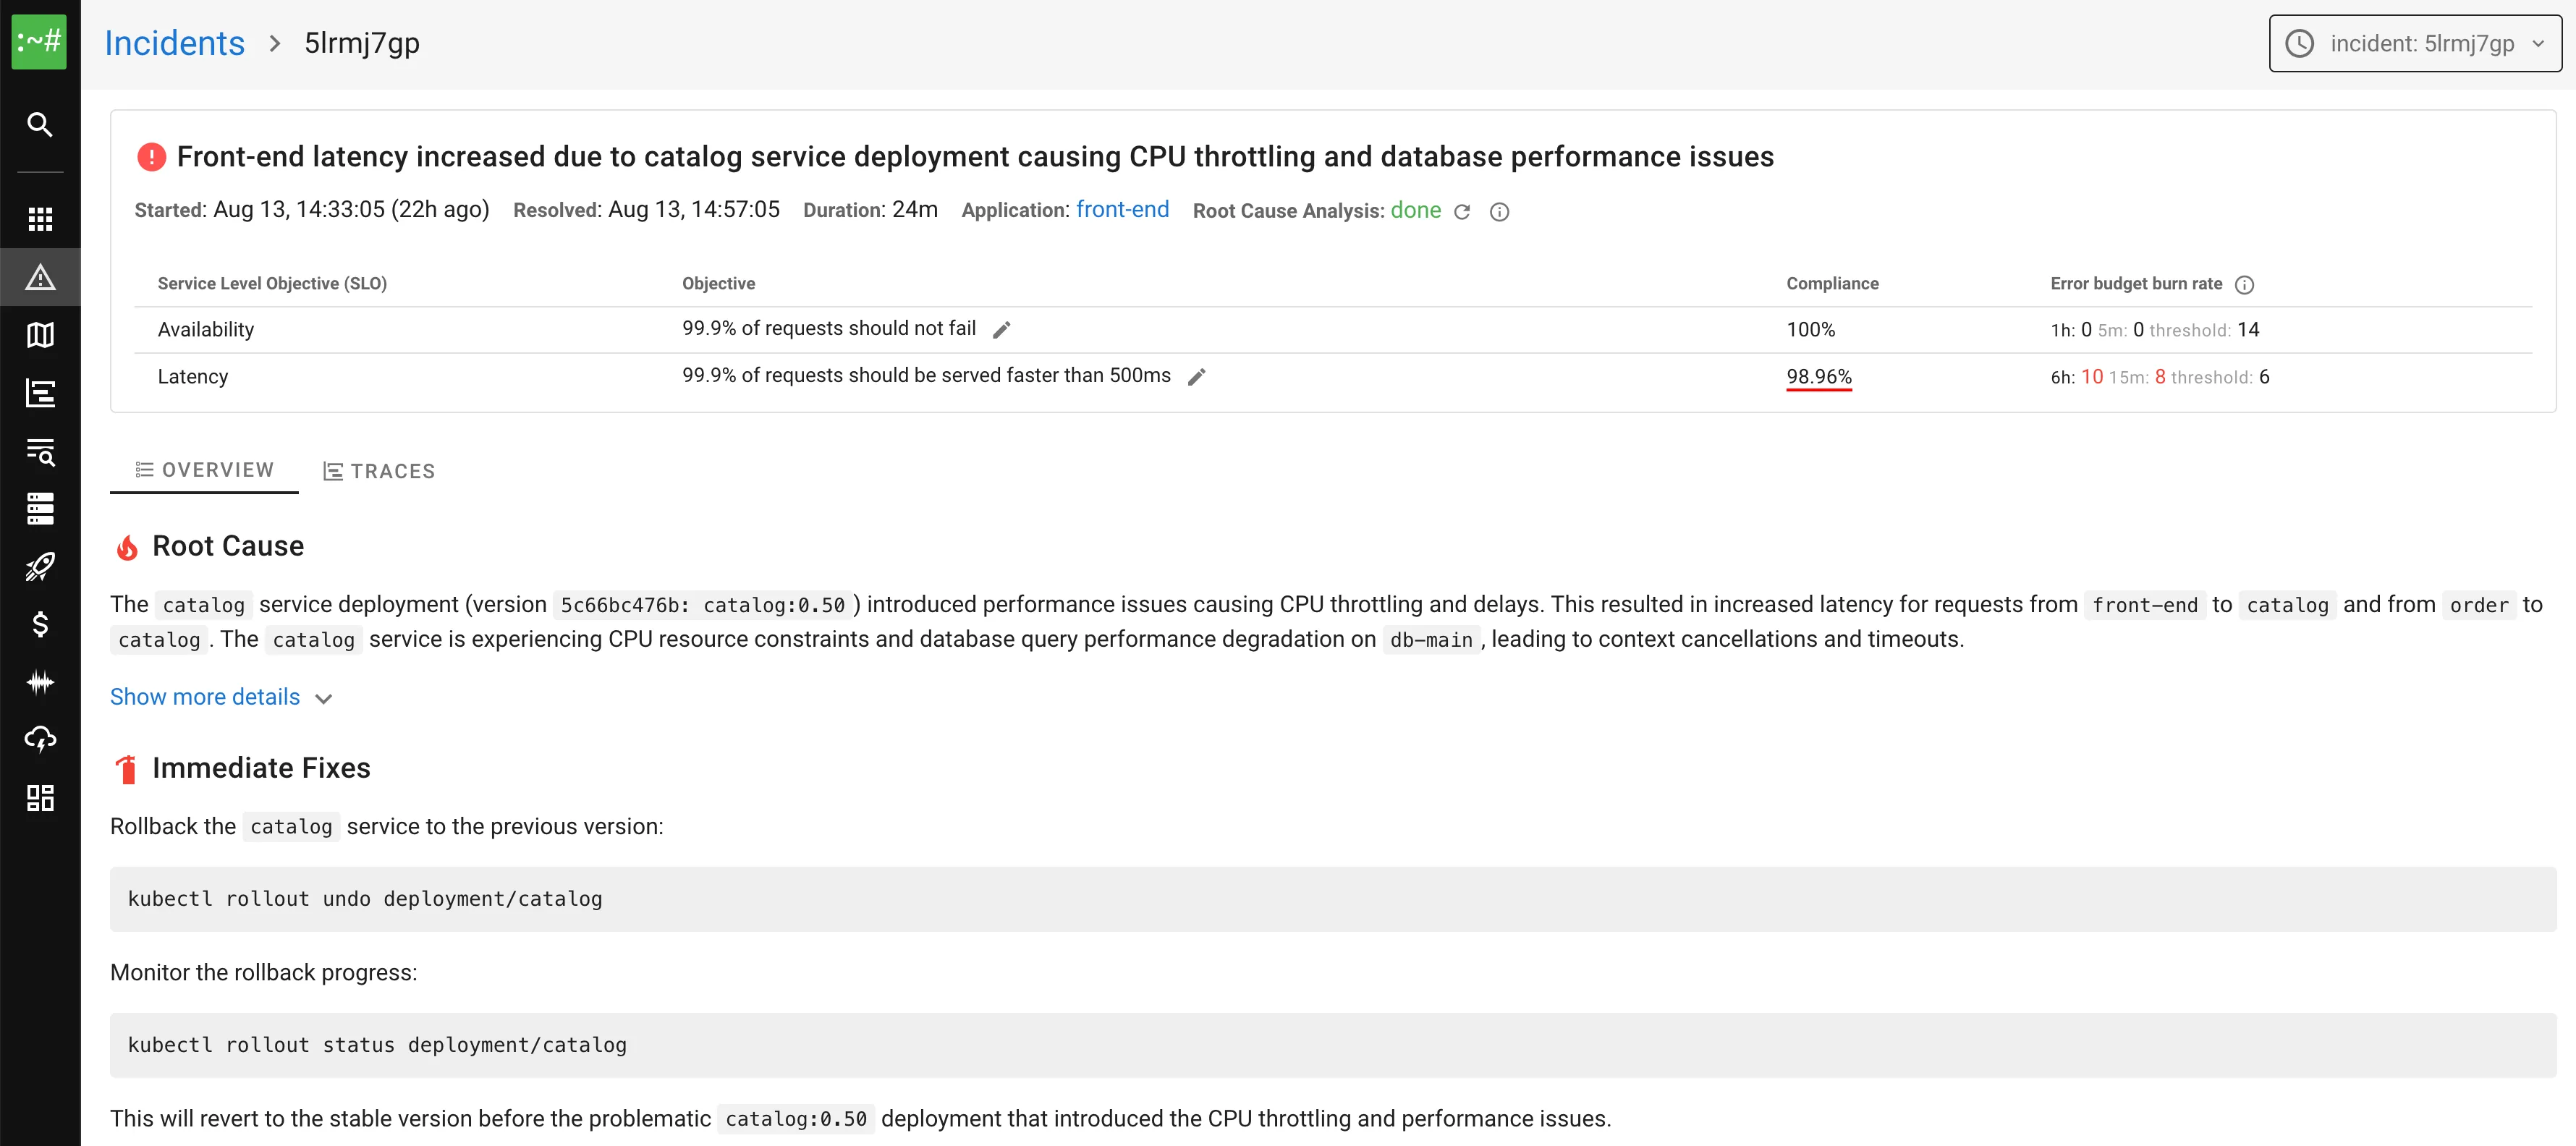
AI-powered Root Cause Analysis
Coroot analyzes your system like a seasoned engineer, identifying the most likely causes of incidents in seconds and providing the full evidence behind each hypothesis so you can verify the findings with confidence.
Why engineers choose Coroot
Observability that works the way you do
Open Source
Apache 2.0 licensed with full source code transparency. Deploy on-premises or in your cloud
Zero Instrumentation
eBPF-based monitoring requires no code changes, library installations, or application restarts
Production Ready
Battle-tested at scale with built-in high availability, data retention, and alerting capabilities
Works Everywhere
Deploys seamlessly on Kubernetes, VMs, bare-metal servers
See exactly what's happening in your systems
Join the teams who troubleshoot faster with zero instrumentation observability powered by eBPF.
✓ No credit card required ✓ 2-minute setup ✓ Full-featured trial