Advanced Postgres monitoring with Coroot (Apache 2.0)
 Nikolay Sivko
A month ago we released Coroot Community Edition – an open-source (Apache 2.0) monitoring and troubleshooting tool for microservice architectures. Since then, it has been installed 400+ times and gained over 1500⭐ on GitHub.
In one of my previous posts, I explained why we implemented another metric exporter for Postgres. However, collecting the right metrics is not enough to troubleshoot efficiently. In this post, I’ll highlight the Postgres monitoring capabilities provided by Coroot.
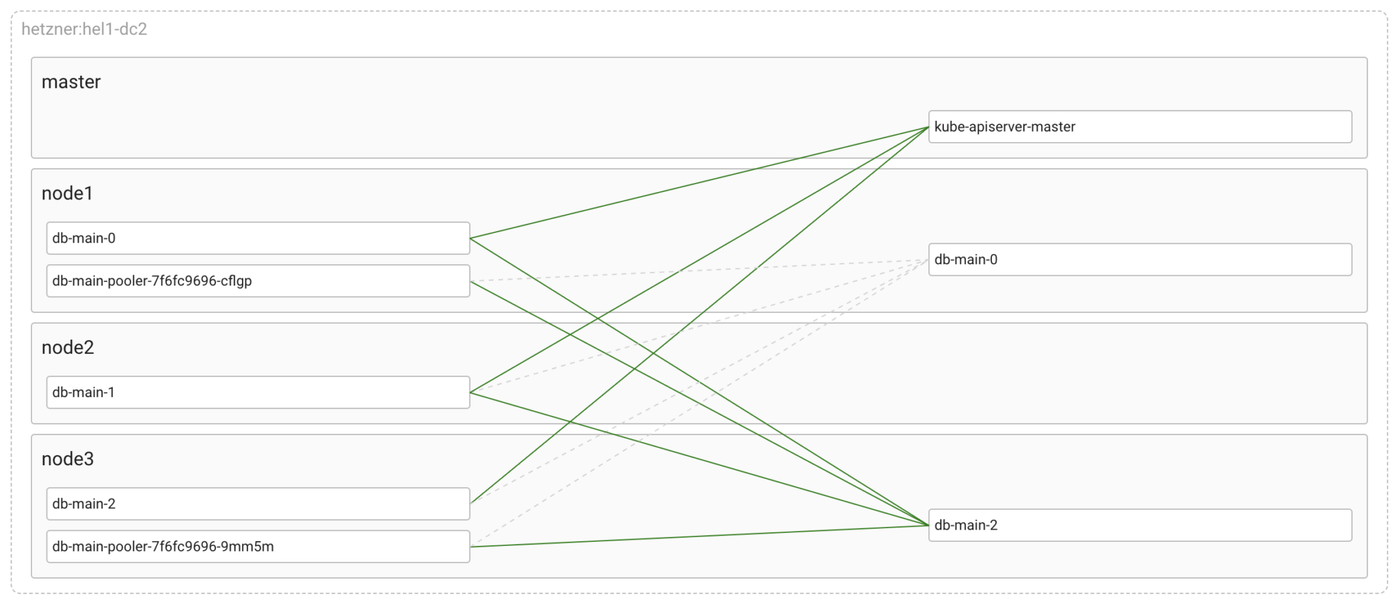
Service maps
A database is a critical part of any infrastructure. If it fails, none of the applications depending on it will perform. These days, we usually have to operate systems with hundreds of services and databases, therefore it’s really important to know which apps are using the database and how cluster components are communicating with each other.
Coroot uses network-level tracing to get a comprehensive map of all network connections in a cluster. This approach makes it possible to track not only inbound client connections but also every connection within a database cluster such as Postgres-to-Postgres and Pgbouncer-to-Postgres connections.
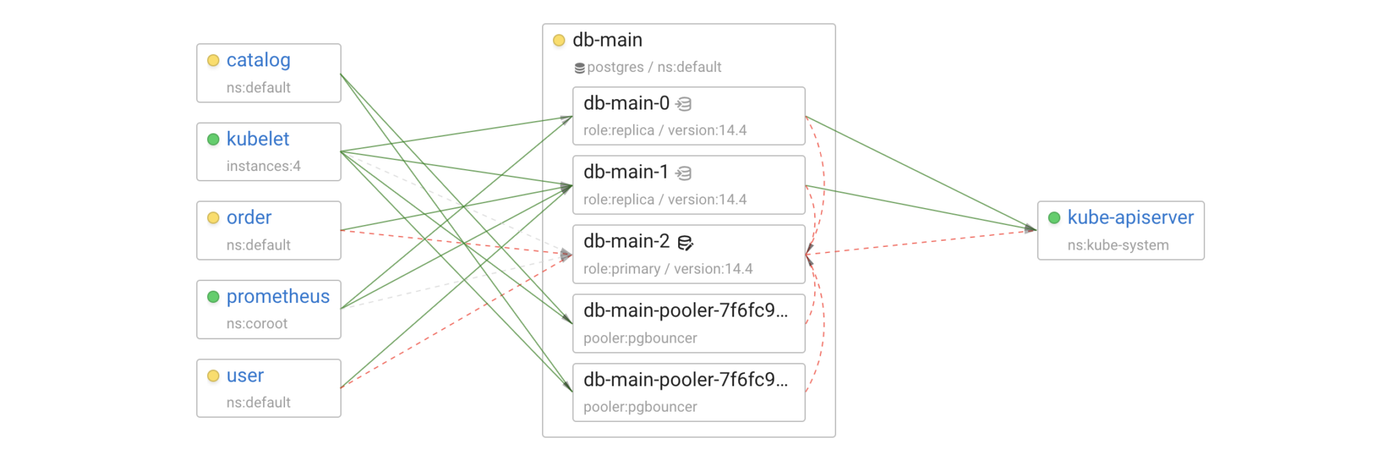
Such a map not only provides superb visibility into the application topology, but it also makes it easy to identify network connectivity issues. For example, on the map above you can see that the primary Postgres instance db-main-2 has no connectivity with other components.
Postgres SLIs (Service Level Indicators)
A database server like other services has its own SLIs. There are two primary SLIs of a DB instance:
- Availability: a DB instance is up and accepting client connections
- Latency: query execution time
Coroot has built-in inspections to track these SLIs:
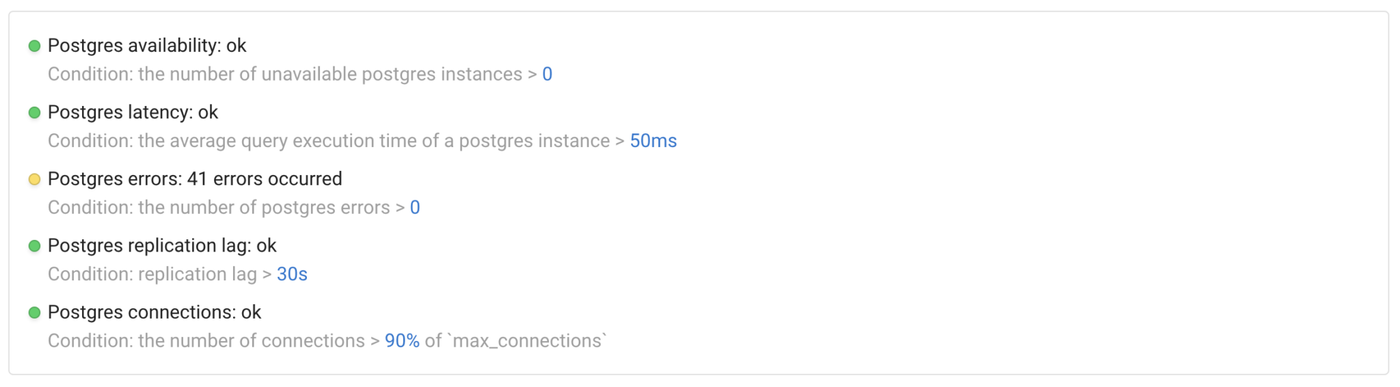
The worst status of these inspections is used as the status of the database, so you can quickly recognize if the database is experiencing any issues or not.
Automated log analysis
As you know, not all issues can be detected only by using metrics. Application logs can tell us much more, and Postgres is not an exception here. However, finding an issue in a large log can be pretty challenging.
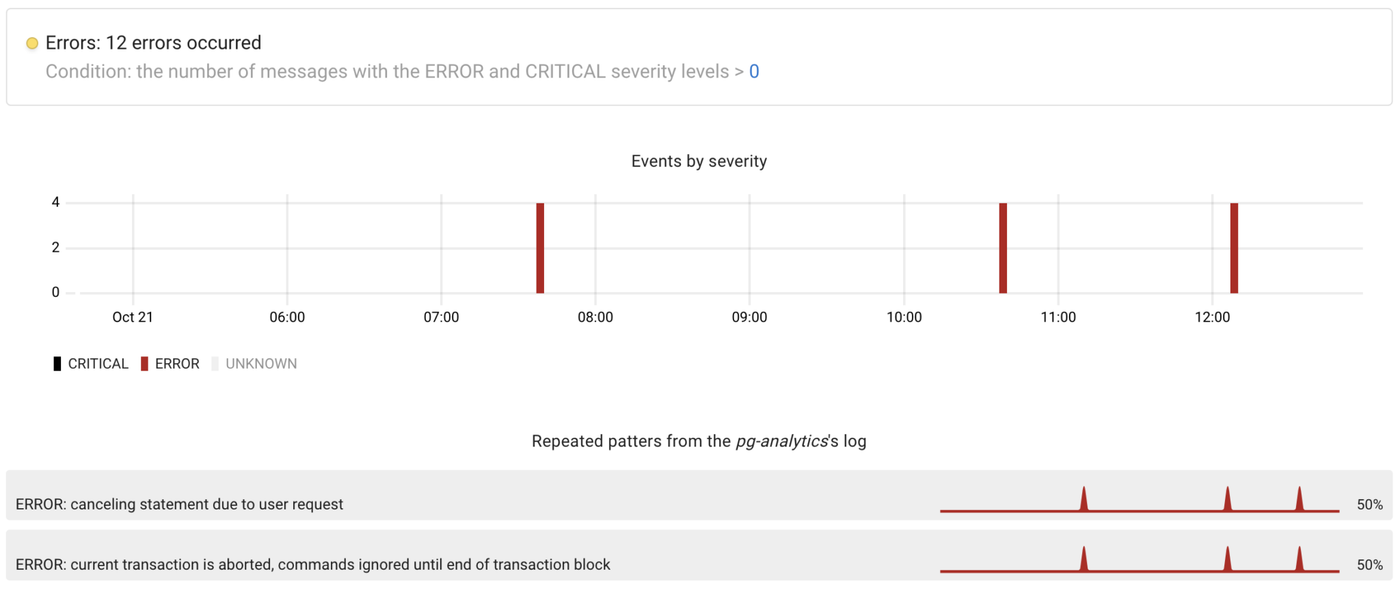
Coroot’s agents extract repeated patterns from logs and turn them into metrics. This allows you to quickly figure out what types of Postgres errors occurred over a given period of time.
All relevant metrics in one place
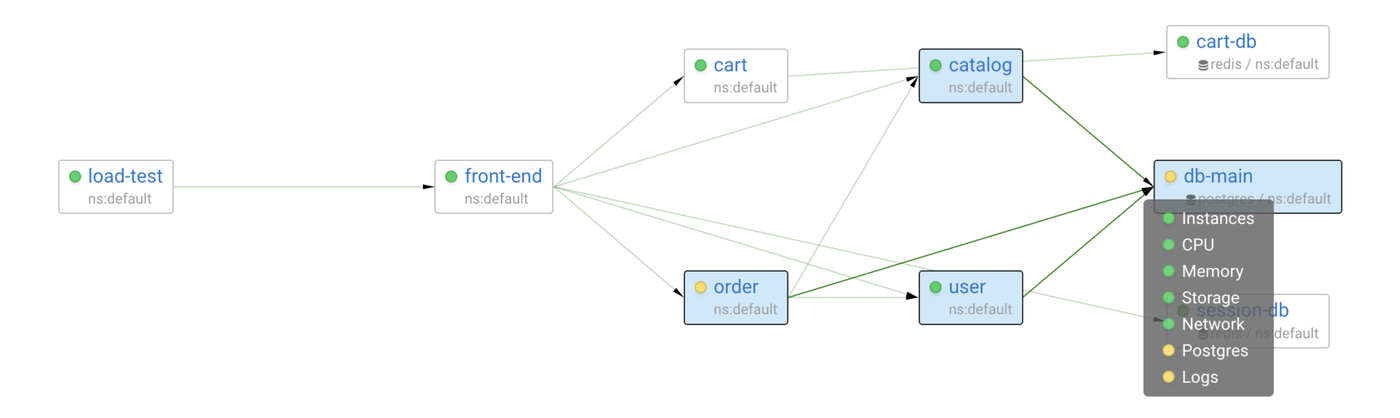
Coroot displays the metrics you might need to troubleshoot any given application all in one place. Moreover, each subsystem has a status, so you can quickly understand if there are any issues even before opening the corresponding dashboard.
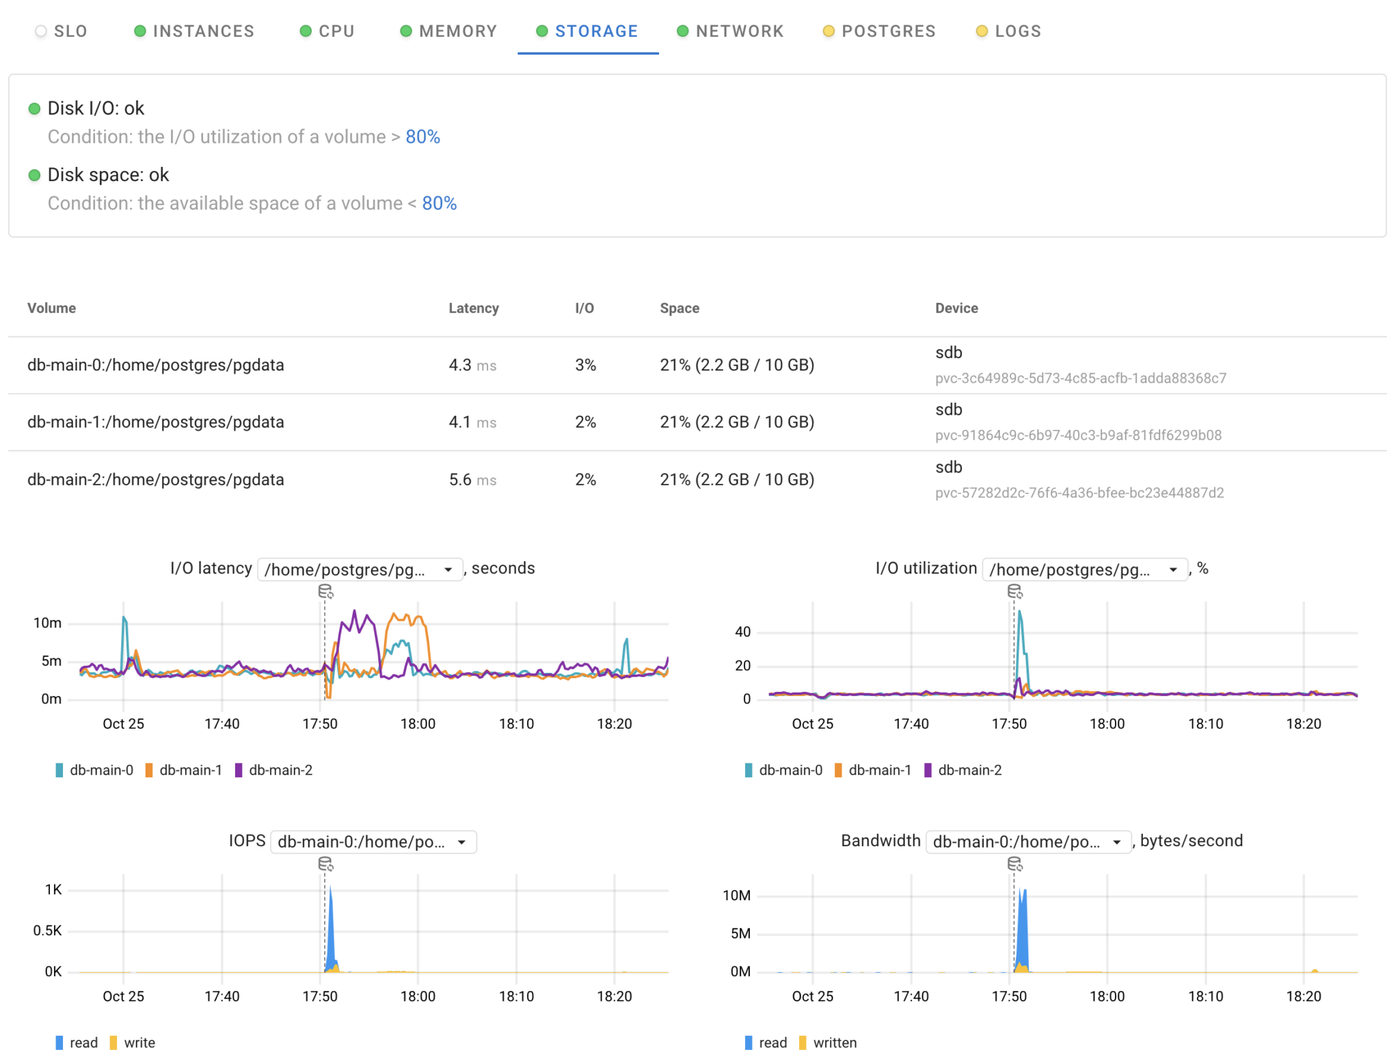
To achieve this, Coroot builds a model of each infrastructure by
- grouping individual containers into applications
- enriching each container representation with resource consumption statistics, subsystems statuses, logged errors, and runtime-specific data
- linking applications to each other regarding their actual connections
Using such a model allows each inspection to be aware of the instances, nodes, and upstream services related to a particular app.
Postgres query performance statistics
In the case where a Postgres server consumes more resources than usual, engineers need to figure out which queries caused the high CPU or I/O load. Coroot uses the query performance metrics to highlight the most CPU- and I/O-intensive queries.
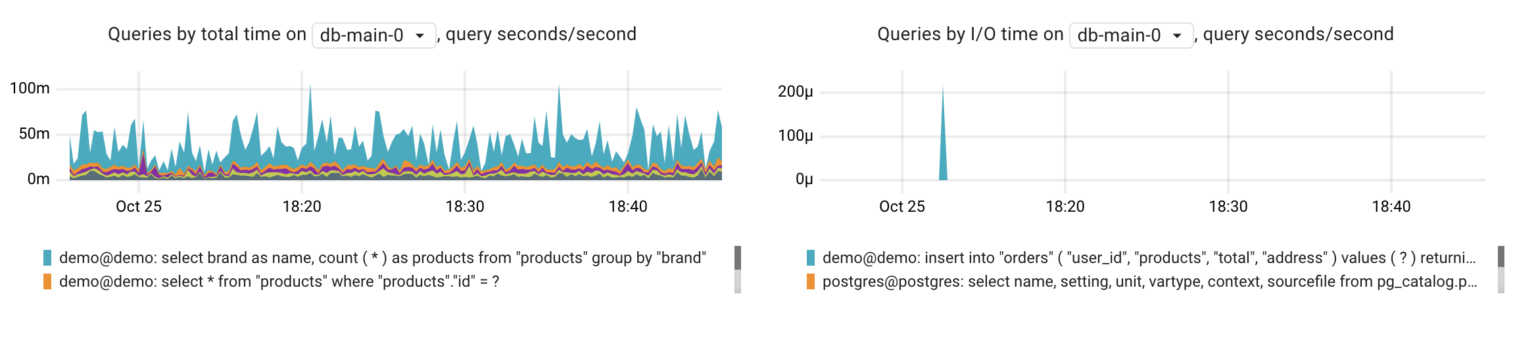
Pg-agent combines statistics from pg_stat_activity and pg_stat_statements, so the resulting metrics take into account both completed queries and those still in progress.
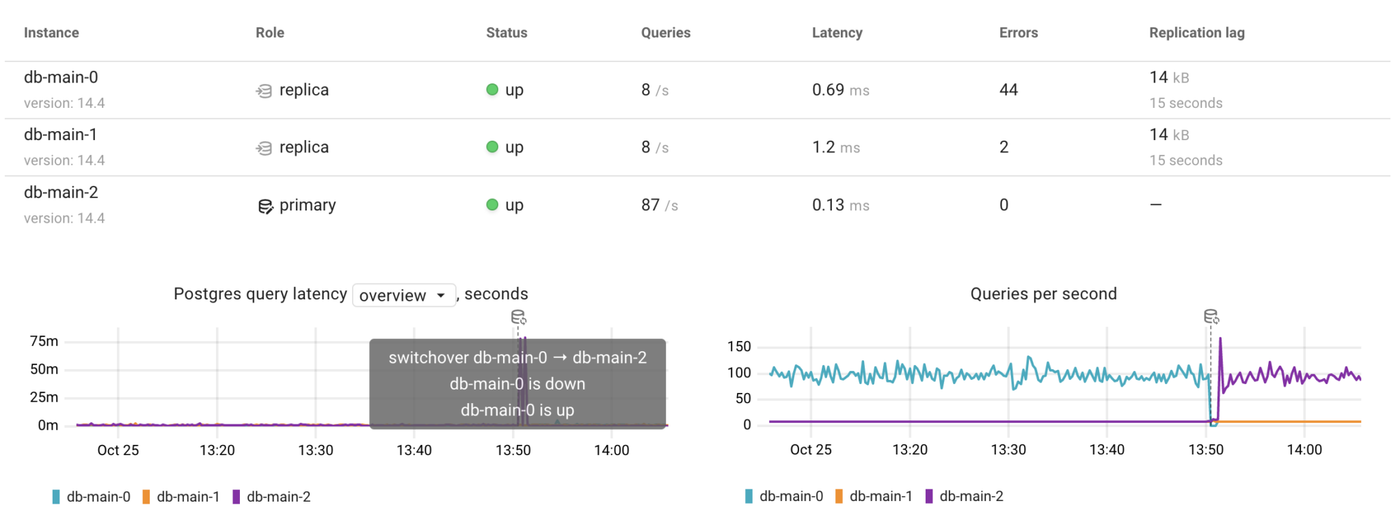
Monitoring HA Postgres clusters
Maintaining distributed databases in production is hard. Coroot provides visibility into any HA Postgres cluster with all its components and their layout across nodes and availability zones.
Moreover, it can track the current role of every Postgres instance, replication lag, and switchovers in the cluster.
Various Postgres deployment methods are supported out of the box:
- Dedicated Postgres instances deployed on bare metal or cloud instances
- Postgres in Docker
- Kubernetes: Postgres Operator by Zalando
- Kubernetes: Postgres Operator from Crunchy Data
- AWS RDS for Postgres (including Aurora)
Conclusion
We believe that Coroot can make troubleshooting Postgres-related issues easier not only for experienced DBAs but also for engineers not specialized in databases.
Follow the instructions on our Getting started page to try Coroot now. Not ready to Get started with Coroot? Check out our live demo.
If you like Coroot, give us a ⭐ on GitHub️.
Any questions or feedback? Reach out to us on Slack.