Pg-agent – a Postgres exporter for Prometheus focusing on query performance statistics
 Nikolay Sivko
At Coroot, we work on a product that detects the root cause of a service outage and provides our users with a list of possible fixes. Databases are crucial parts of any infrastructure, so our product must be able to identify common pitfalls in this area. According to numerous database rankings, Postgres is the most popular database these days, so it made sense to start there.
Initially, we planned to use metrics collected by existing open-source Prometheus exporters, such as postgres_exporter (1.7k stars on Github). Unfortunately, we realized that the metrics it collects are useless for identifying the most common Postgres issues, like:
- A CPU-intensive query is affecting other queries
- A server has reached its
max_connectionslimit because most of the connections are stuck in the idle in transaction state - An I/O-intensive query is affecting other queries
- A query is blocking other queries by holding an exclusive lock
Pg-agent (Apache 2.0)
Proposed changes to postgres_exporter would be too massive, so we decided to build another exporter focusing on query performance statistics — pg-agent. It’s open-source and distributed under the Apache 2.0 license.
While working on pg-agent, we reproduce the failure scenarios mentioned above and check whether the collected metrics identify a particular failure or not. Here are a few things we realized while testing the agent on real failures:
- statistics from
pg_stat_activityandpg_stat_statementsshould be merged by the query to take into account not only finished queries but also those still executing - queries from
pg_stat_activityshould be obfuscated and normalized, since they contain raw query parameters - queries from
pg_stat_statementsshould also be obfuscated and normalized to aggregate statistics of similar queries with different numbers of elements in the ANY (…) or IN (…) expressions - it should be possible to find out the latest queries for the active and idle in transaction connections.
- to deal with issues related to lock contentions, we need to know not only the queries that are waiting for locks but also those holding these locks
Let’s take a look at the resulting metrics and how they can help you deal with Postgres-related issues.
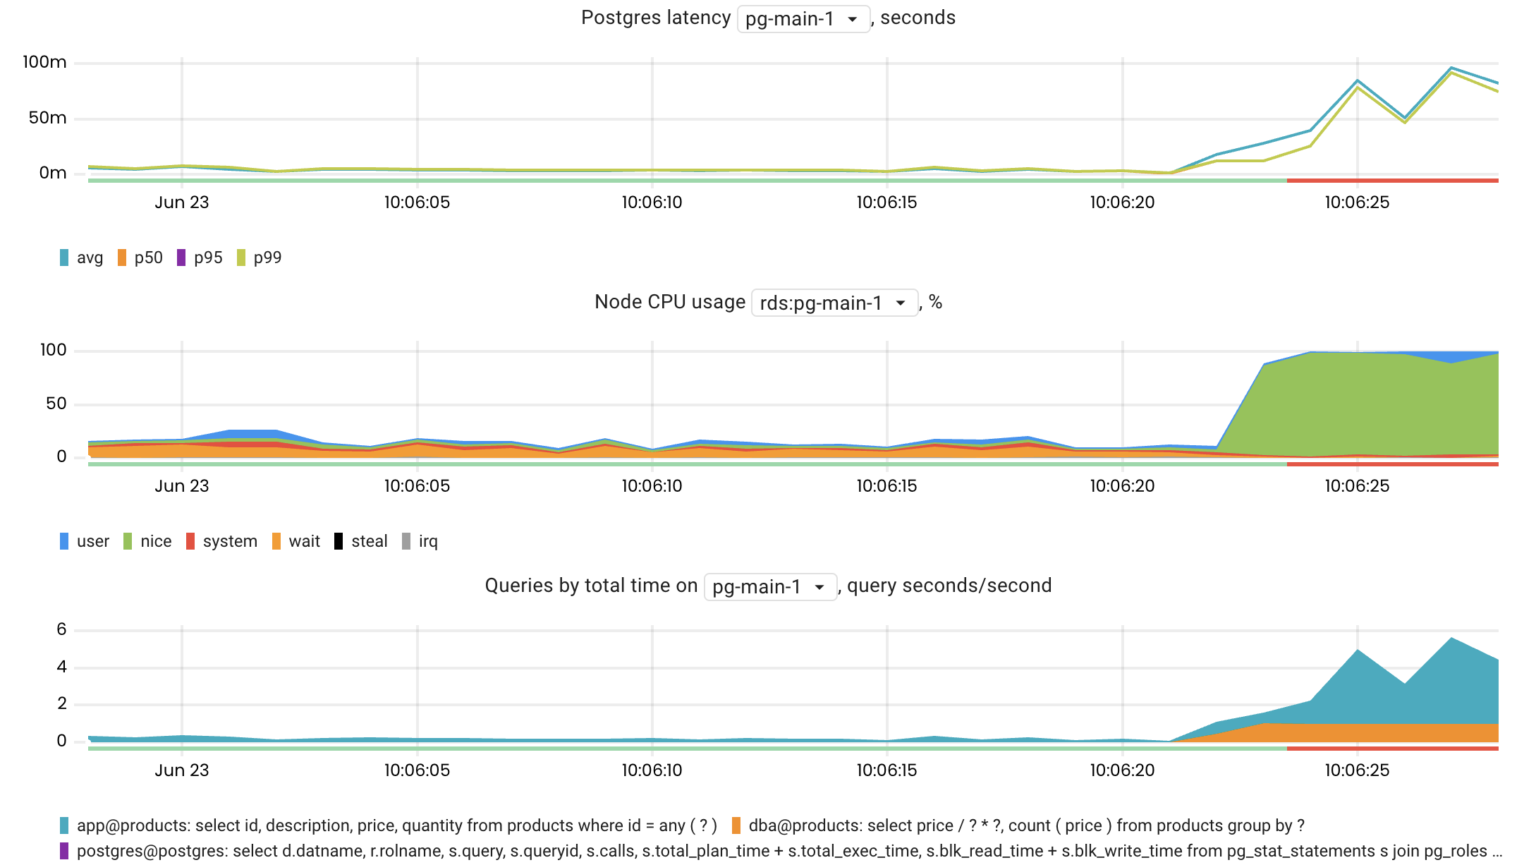
CPU-intensive queries
The pg_top_query_time_per_second metric is quite useful when you need to find the most CPU-intensive queries. This metric is a combination of clock_timestamp()-pg_stat_activity.query_start and pg_stat_statements.total_time for a particular query.
topk(10, pg_top_query_time_per_second{rds_instance="us-west-1/pg-main-1", db="products"})
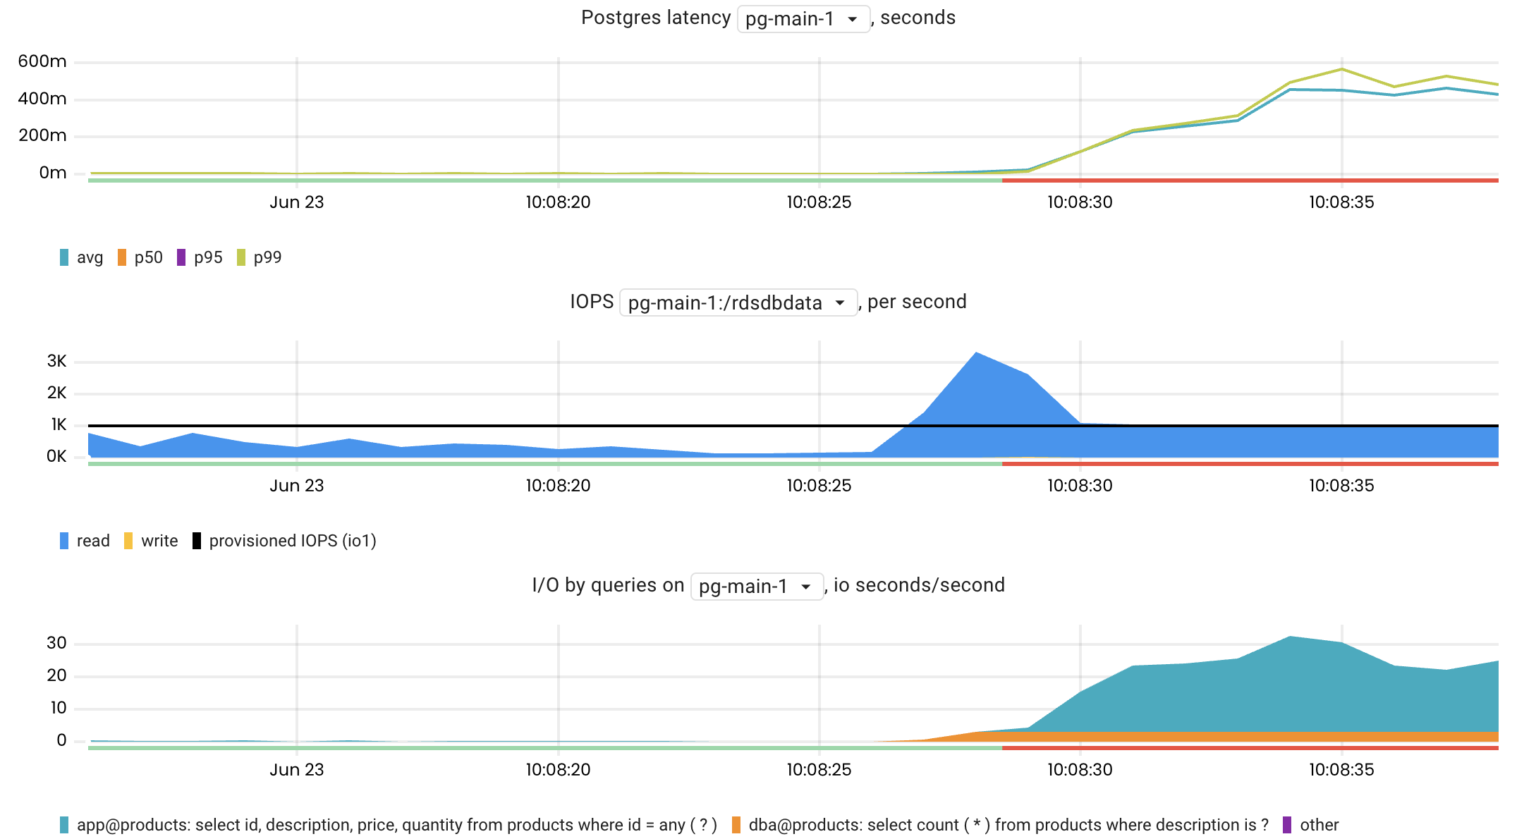
I/O-intensive queries
The pg_top_query_io_time_per_second metric helps to investigate I/O issues because it makes it easy to find the most I/O-intensive Postgres queries.
topk(10, pg_top_query_io_time_per_second{rds_instance="us-west-1/pg-main-1", db="products"})
Client connections
The number of client connections that a Postgres server can handle is always limited by its settings (max_connections). This is because Postgres forks a new process for each client connection. Every process consumes memory and CPU resources, even when idle. If the number of connections reaches max_connections, Postgres will reject clients’ attempts to connect.
The pg_connections metric is the number of connections broken down by their state, db, user, wait_event_type, and query. Such metric cardinality allows you to drill down and see the most recent queries executed within the active or idle transactions.
For example, if a Postgres server is rejecting connections, we can aggregate connections by their states:
sum by(state) (pg_connections{rds_instance="us-west-1/pg-main-1"})
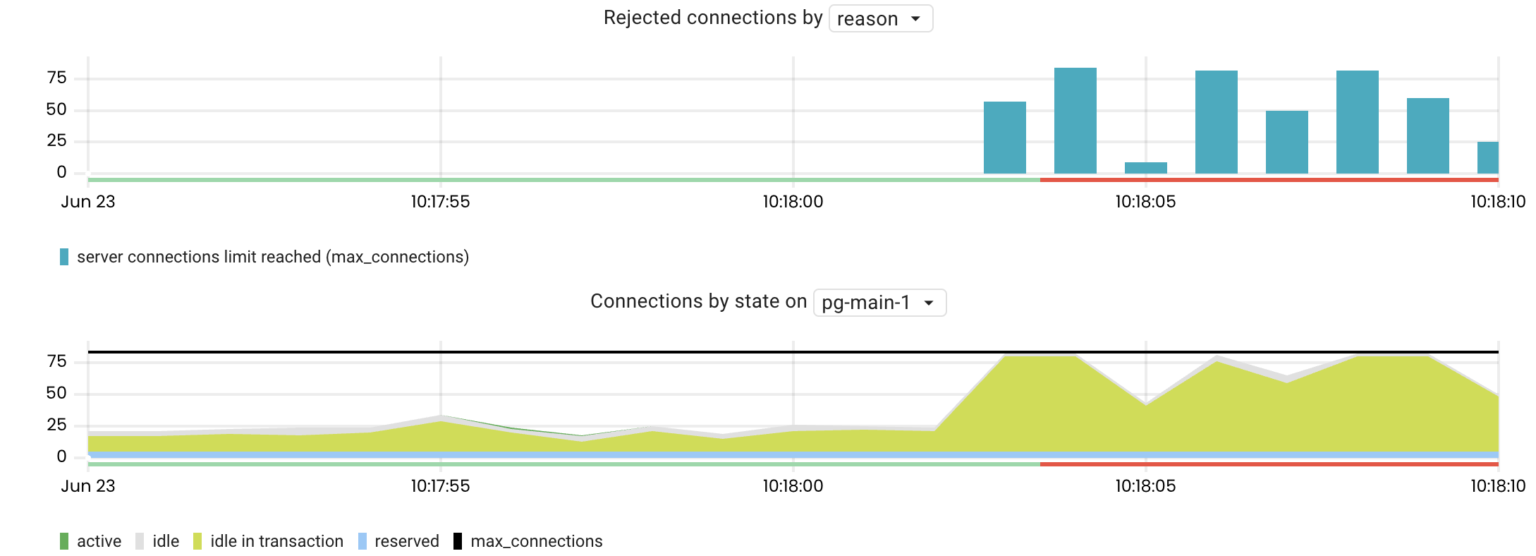
As seen above, most connections are in the idle in transaction state. Now, we can drill down to see the last executed queries before the transactions became idle:
sum by(query) (pg_connections{rds_instance="us-west-1/pg-main-1", state="idle in transaction"})
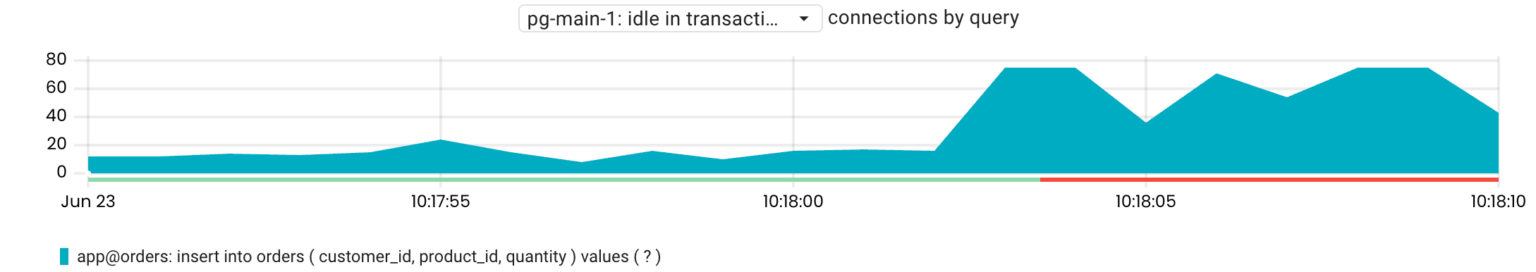
By understanding which transactions are in the idle in transaction state, we can figure out the cause of this behavior. For example, in this scenario, the application communicated with a remote service within transactions.
Locks
To ensure data consistency, all databases use locks. The waiting time to acquire a lock is usually negligible, but there still may be cases where locking is an issue. To find the queries waiting for locks we can use the pg_connections metric:
sum by(query) (pg_connections{rds_instance="us-west-1/pg-main-1", state="active", wait_event_type="Lock"})
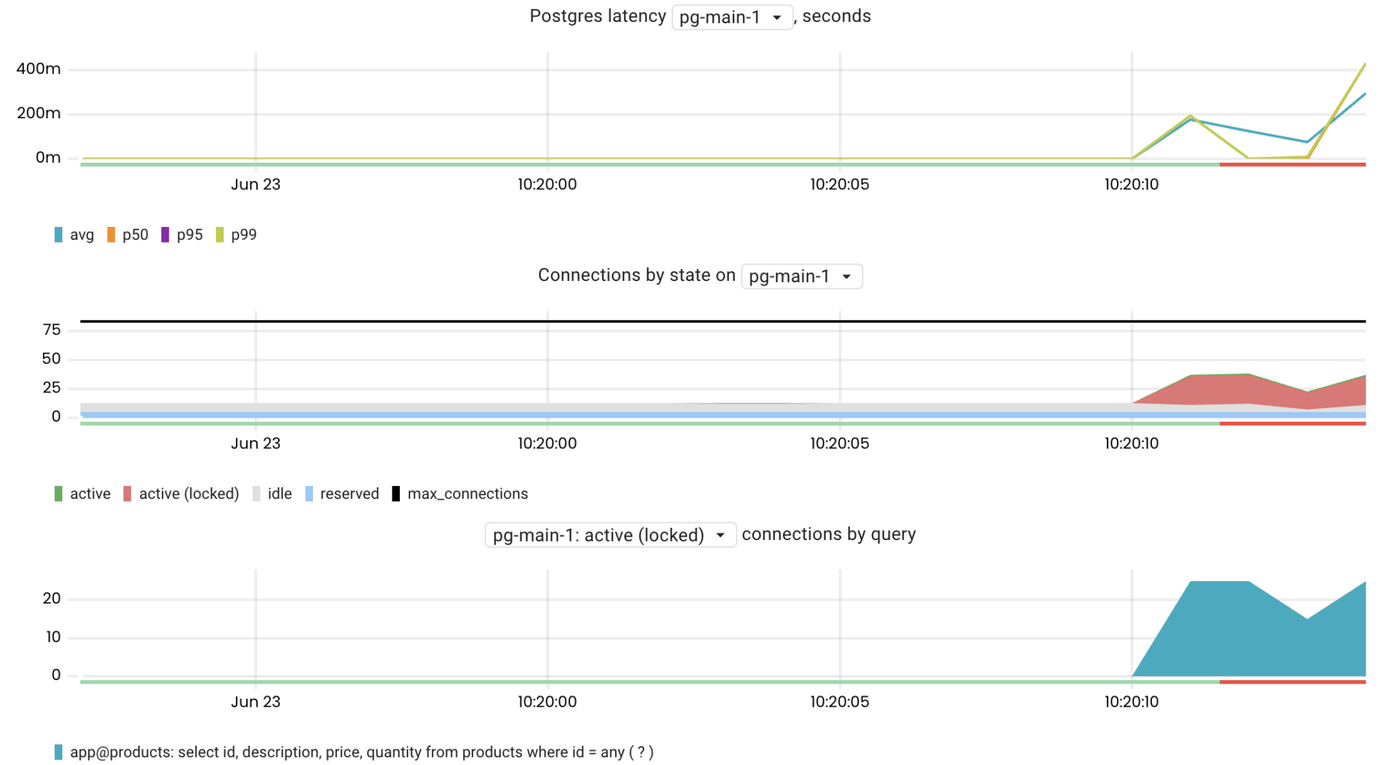
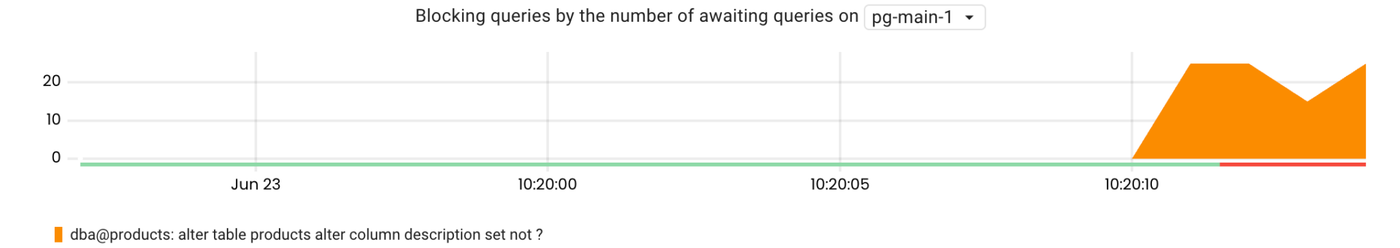
It is now clear that the issue is caused by lock contention. The next step is to figure out which query is holding the lock. To do so, we can use the pg_lock_awaiting_queries metric. This shows the number of queries awaiting the lock that are being held by a particular query. This metric is gathered by calling pg_blocking_pids() for every locked query and then identifying the relevant query for the returned PID.
topk(10, pg_lock_awaiting_queries{rds_instance="us-west-1/pg-main-1"})
Metric cardinality
The main concern about using queries as metric labels is the cardinality of the resulting metrics. Handling high cardinality metrics are challenging for most Time-Series Databases (TSDBs). Pg-agent addresses this problem in the following ways:
- Aggregating statistics of similar queries, e.g., those that differ only in the number of elements in the ANY (…) or IN (…) expressions.
On the one hand, the execution plan of such queries may vary depending on the number of elements. However,pg_stat_statementsandpg_stat_activitydo not contain anyplan_idthat could be used along with queries for grouping, so we aggregate statistics only by a normalized query. - Since, in most situations, we only need to find the major impacting queries, pg-agent collects statistics only for the top 20 by total execution time.
Quick start
Pg-agent can gather metrics from Postgres servers starting from version 9.6. It requires a database user with the assigned pg_monitor role. You will also need to enable the pg_stat_statement extension.
create role <USER> with login password '<PASSWORD>';
grant pg_monitor to <USER>
create extension pg_stat_statements;
Then, run the agent:
docker run --detach --name coroot-pg-agent
  --env DSN="postgresql://<USER>:<PASSWORD>@<HOST>:5432/postgres?connect_timeout=1&statement_timeout=30000"
  ghcr.io/coroot/coroot-pg-agent
Flags:
usage: coroot-pg-agent [<flags>] <dsn>
Flags:
      --listen="0.0.0.0:80"  Listen address (env: LISTEN) - "<ip>:<port>" or ":<port>".
      --scrape-interval=15s  How often to snapshot system views (env: PG_SCRAPE_INTERVAL).
      --version              Show application version.
Args:
  <dsn>  Data source name (env: DSN) - "postgresql://<user>:<password>@<host>:5432/postgres?connect_timeout=1&statement_timeout=30000".
Kubernetes
If you run Postgres in a Kubernetes cluster, you can deploy pg-agent as a sidecar container. Here is an example of the sidecars spec section for the Postgres Operator by Zalando:
...
podAnnotations:
  prometheus.io/scrape: 'true'
  prometheus.io/port: '80'
sidecars:
- name: pg-agent
  image: "ghcr.io/coroot/coroot-pg-agent:1.0.5"
  ports:
    - containerPort: 80
      protocol: TCP
  resources:
    requests:
      cpu: 100m
      memory: 100Mi
  env:
    - name: PGUSER
      valueFrom:
        secretKeyRef:
          name: postgres.product-pg.credentials
          key: username
    - name: PGPASSWORD
      valueFrom:
        secretKeyRef:
          name: postgres.product-pg.credentials
          key: password
    - name: DSN
      value: postgresql://$(PGUSER):$(PGPASSWORD)@127.0.0.1:5432/postgres
Amazon RDS for Postgres
Aws-agent is a dedicated agent that discovers running Postgres & Aurora for Postgres RDS instances in a specified AWS region and instruments them with built-in pg-agent. In addition to Postgres metrics, it gathers:
- OS metrics (based on Enhanced Monitoring)
- Log-based metrics
- Meta information of the RDS instance
You can find step-by-step instructions on how to install aws-agent and set up an IAM role for it on GitHub.
Conclusion
We hope that the metrics collected by pg-agent and aws-agent will make troubleshooting Postgres-related issues easier not only for experienced DBAs but also for engineers not specialized in databases.
- Get started with Coroot
- pg-agent (Apache-2.0 License)
- aws-agent (Apache-2.0 License)