Full-stack observability
in minutes
eBPF-powered and AI-guided — see every metric, log, and trace with zero code changes
Trusted by SREs and DevOps teams around the world
"For enterprises juggling sprawling architectures, Coroot is nothing short of a lifesaver. It's perfect for cost-conscious teams looking to ditch expensive cloud tools like DataDog or New Relic"

Know what’s wrong. Fix it fast.
Coroot shows you exactly what’s wrong and how to fix it so you can focus on building instead of debugging.
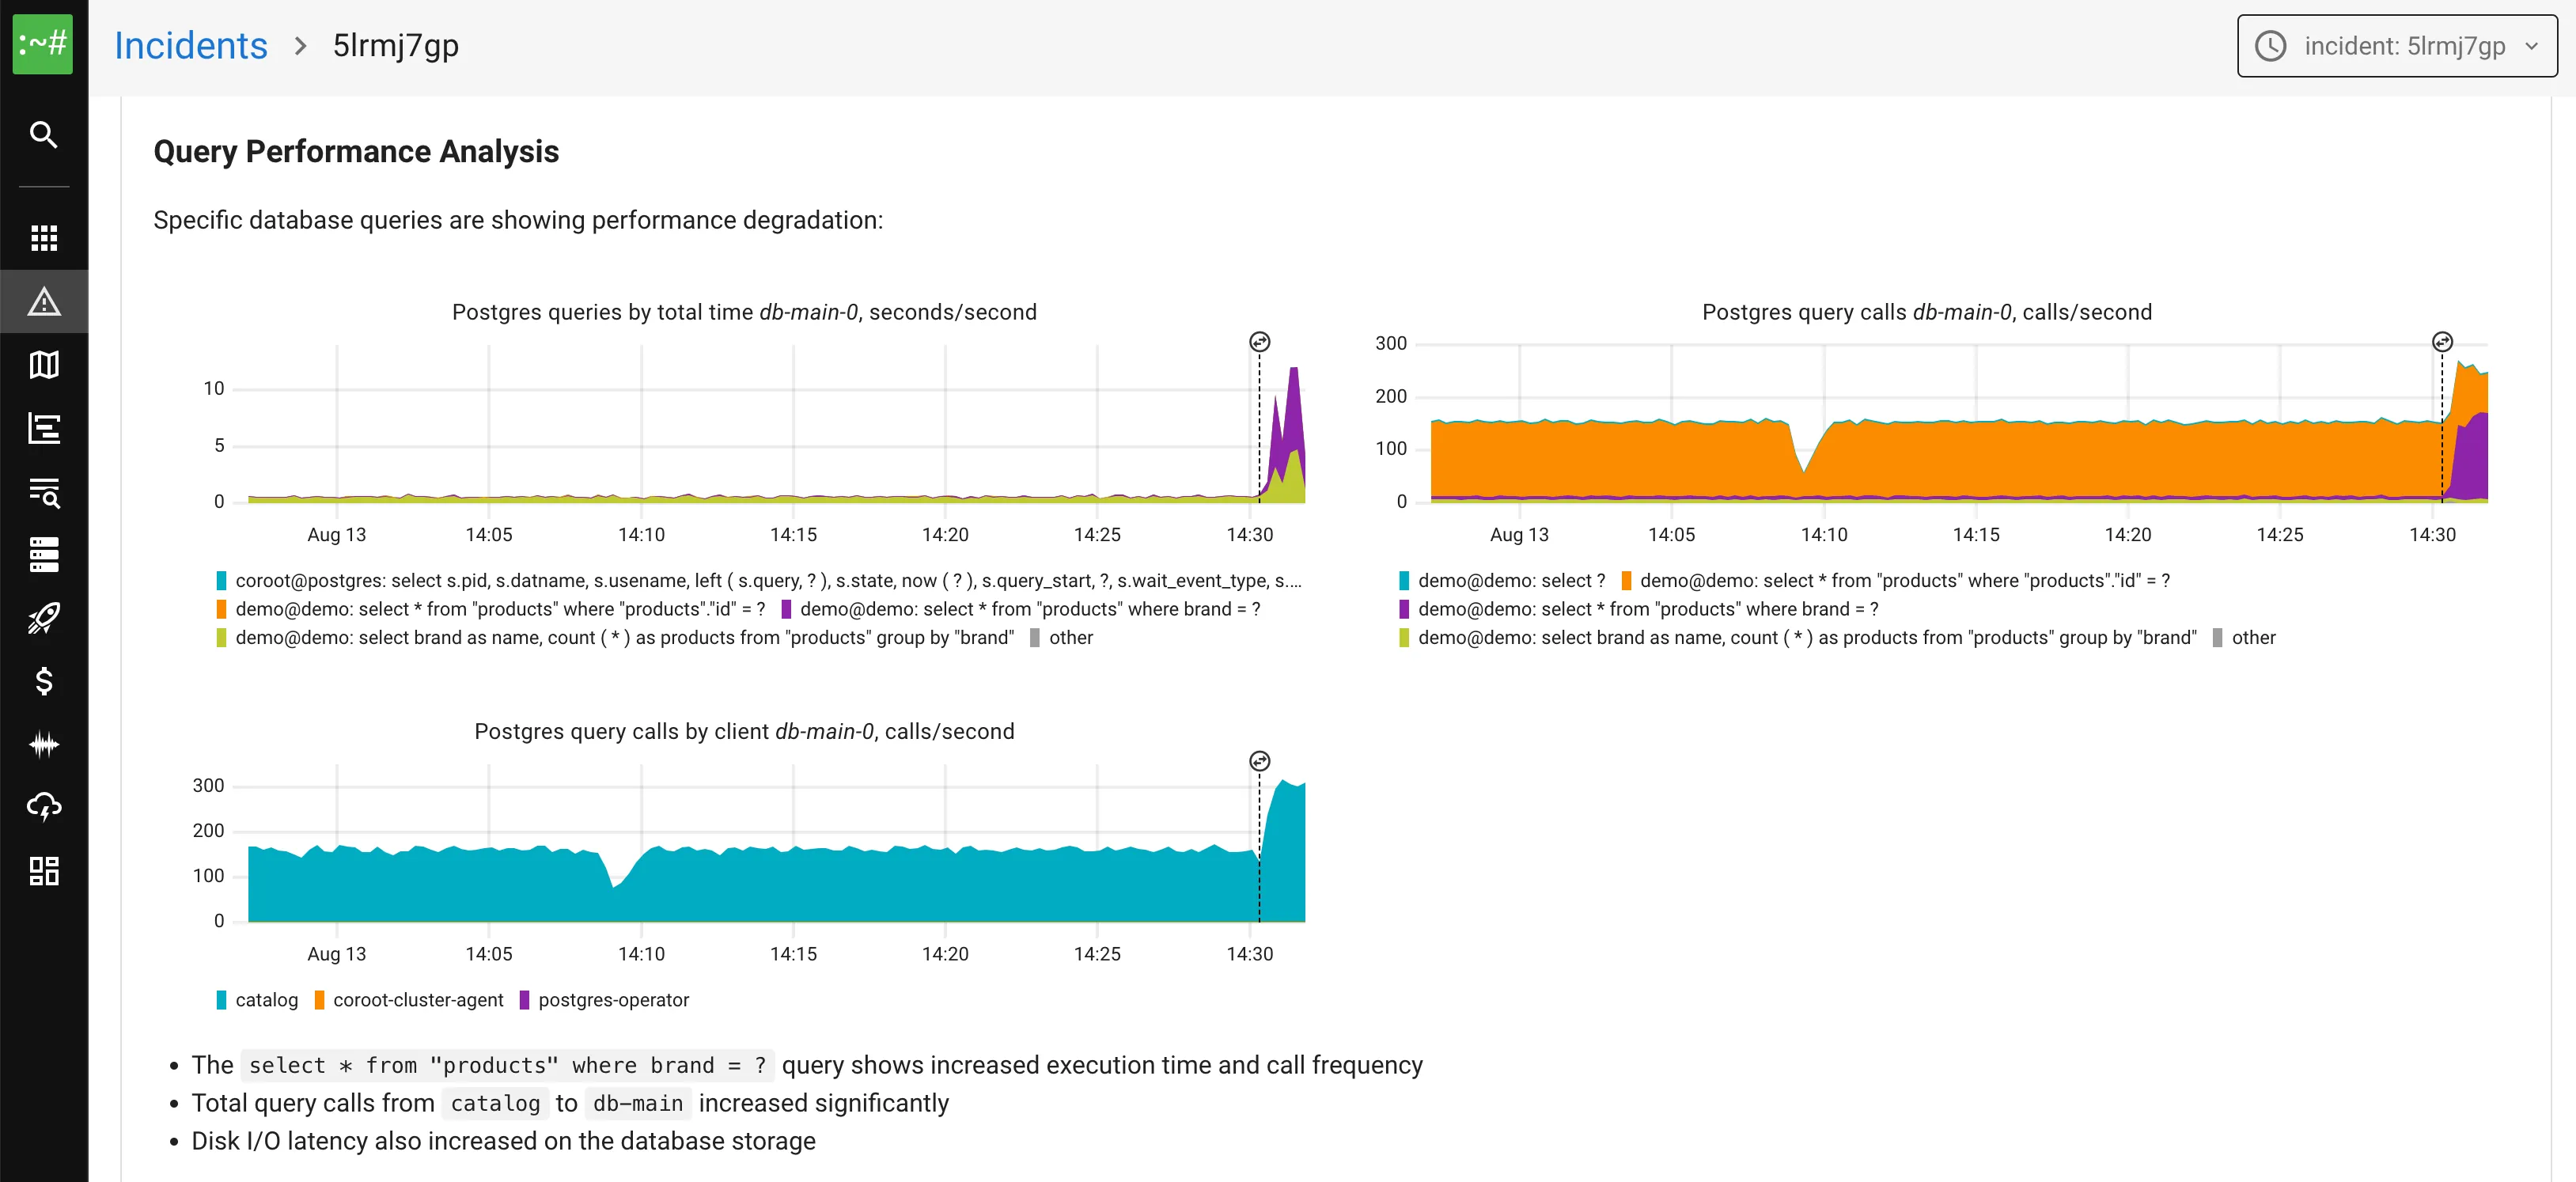
AI-powered Root Cause Analysis
With complete telemetry, AI works like an experienced engineer — tracing dependencies, finding the root cause, and suggesting fixes instantly.
Learn more about AI features →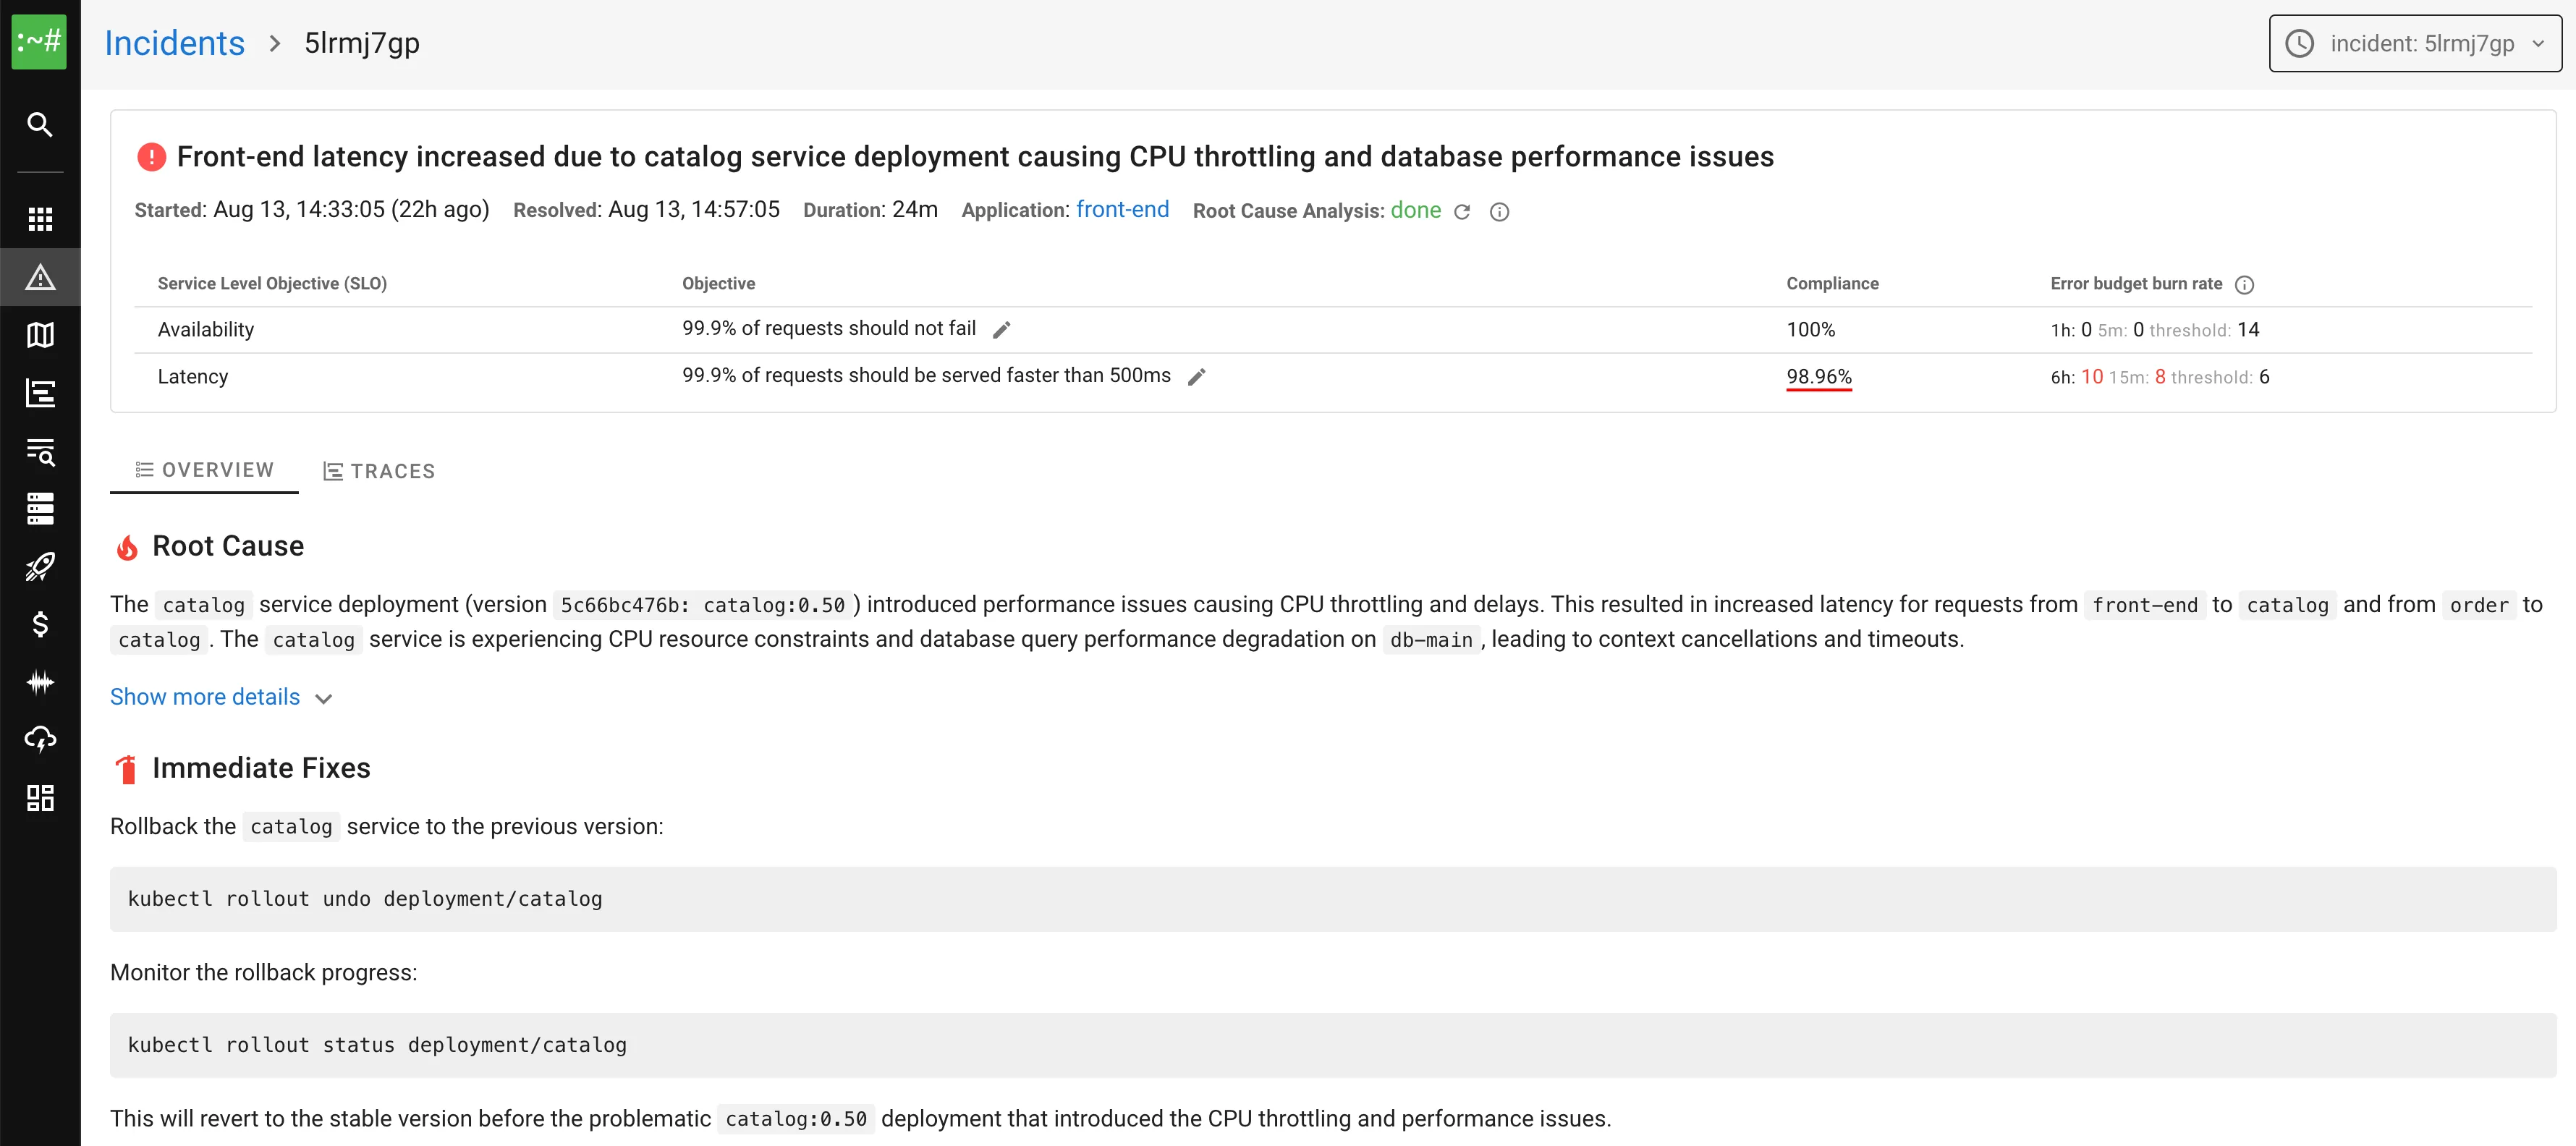
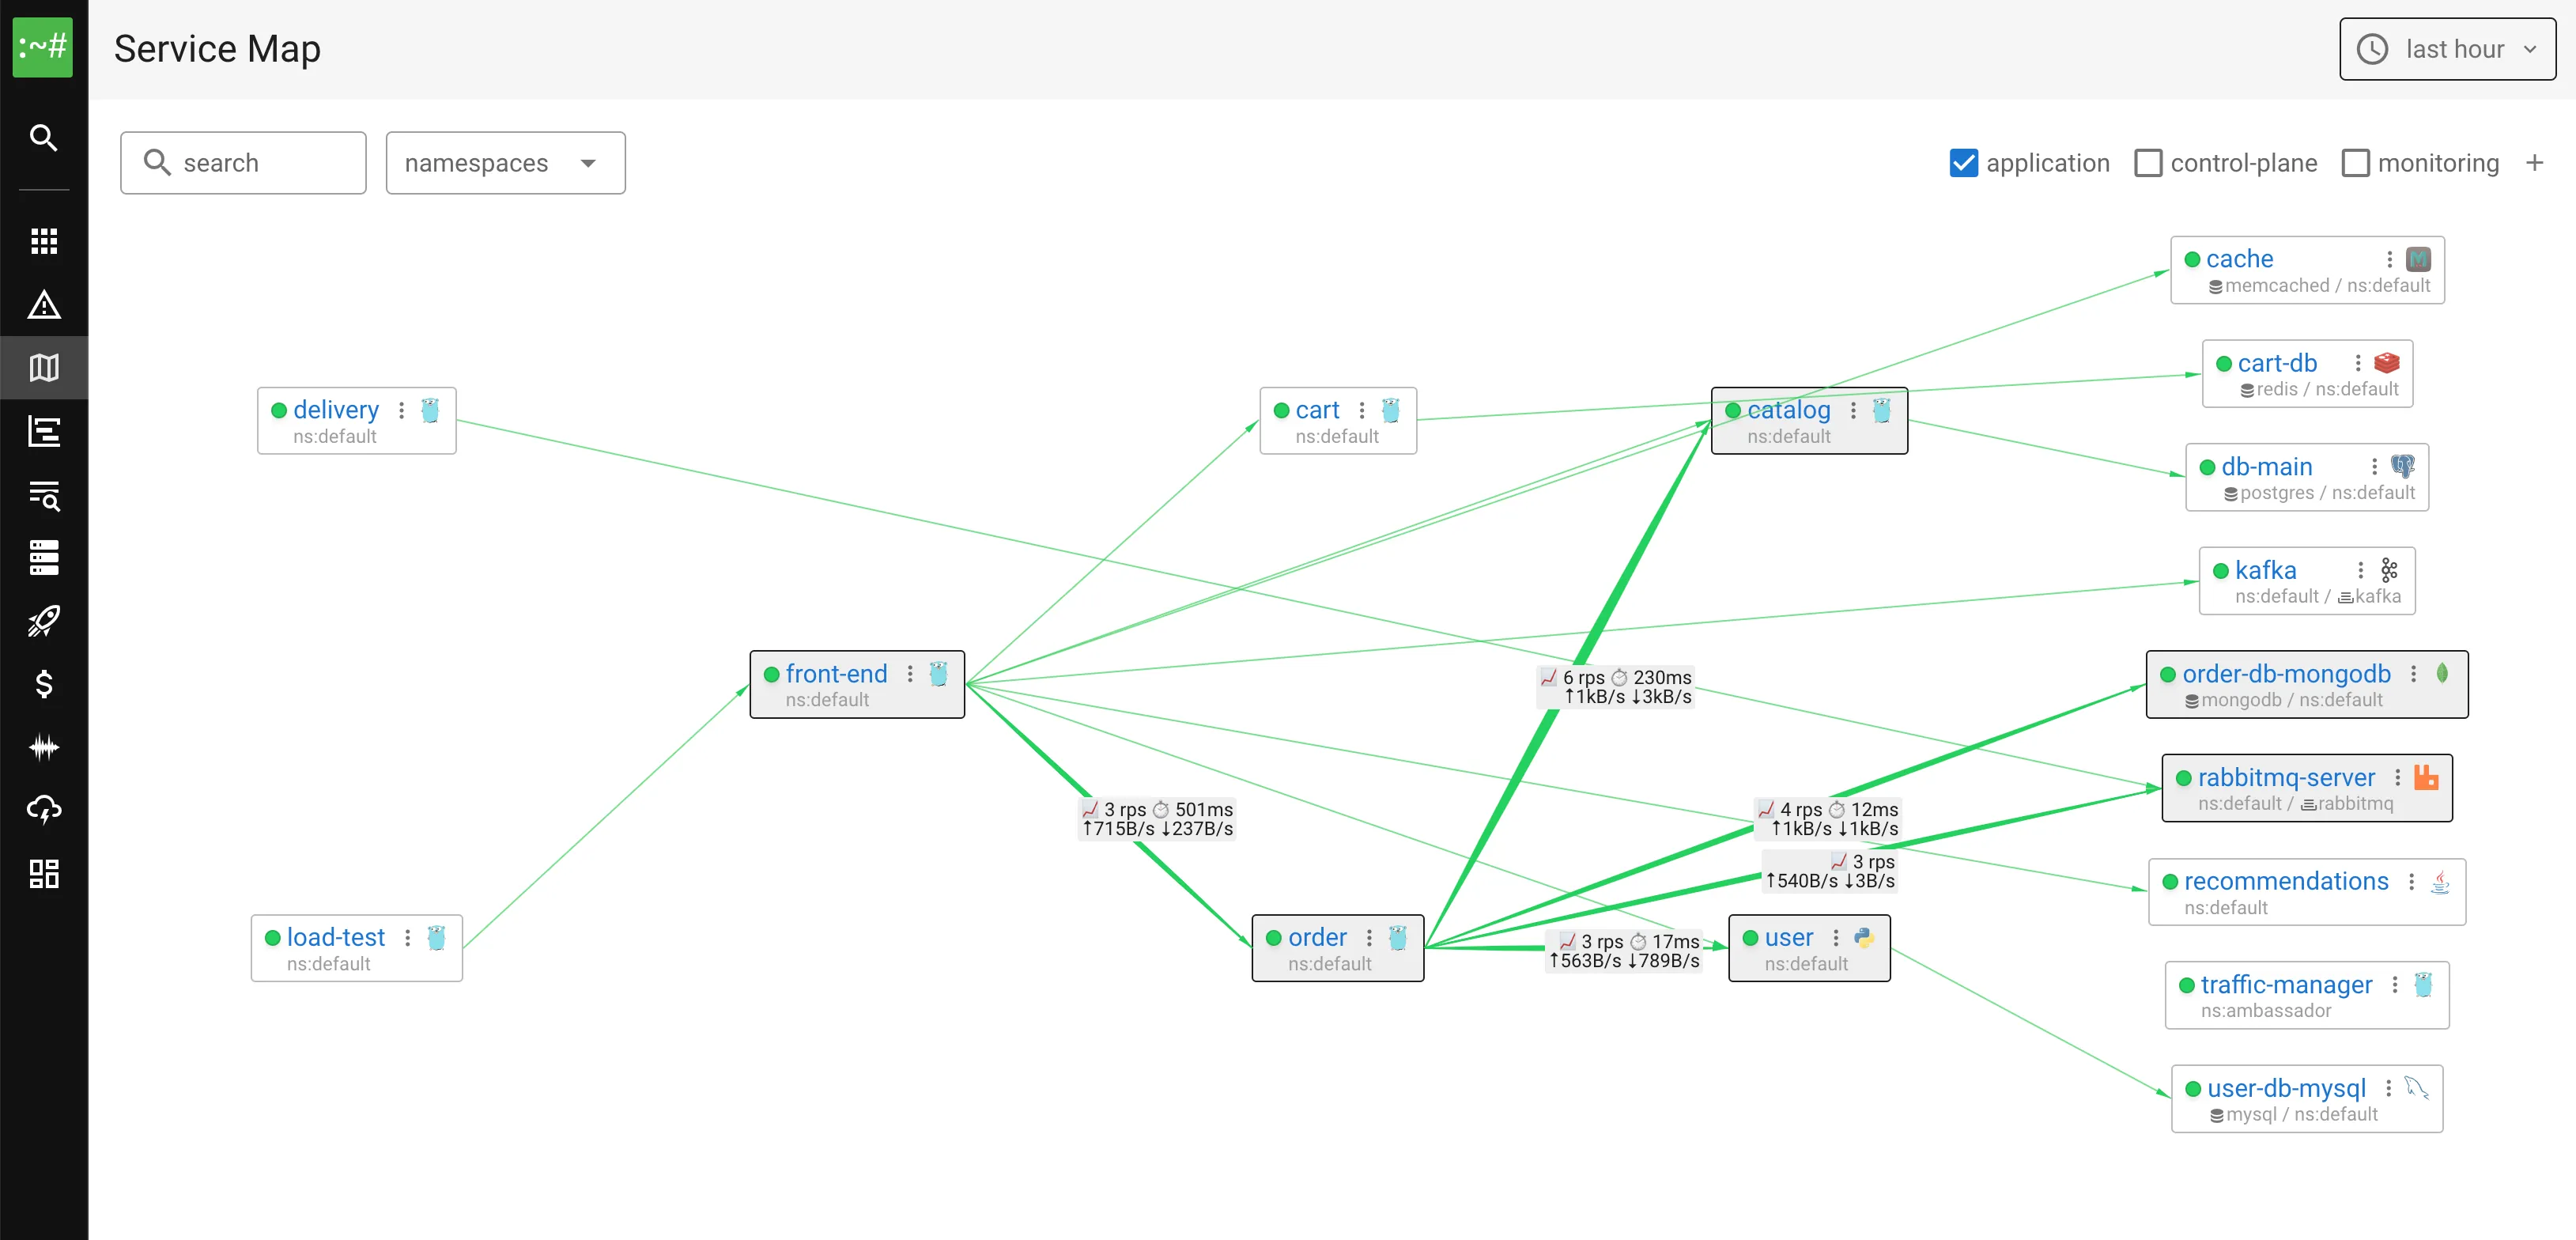
Full-stack Observability
See everything from applications and databases to infrastructure, cloud and network with every metric, log, trace and profile in one view.
All-in-One Observability Platform
It handles the entire observability cycle, from gathering and storing metrics, logs, traces and profiles to visualizing, alerting and turning them into actionable insights, with minimal effort from you.
See what makes Coroot different
From service maps to continuous profiling — explore the complete feature set that helps teams detect, diagnose, and resolve issues faster than ever.
Explore All Features →Observability teams love Coroot

"Coroot is one of the easiest observability solutions to recommend because it is both easy to install and feature-complete, delivering immediate value out of the box, all while being built on open standards. It's the first tool I install, even using it to observe my other observability tools."

"Coroot is a revolution in IT observability. This open source platform simplifies the analysis of metrics, logs and traces, providing valuable insights and unparalleled simplicity."

"For engineers and SREs tired of sifting through endless logs and fragmented metrics, Coroot offers a refreshingly intuitive yet powerful approach to modern observability."
"Coroot is one of the easiest observability solutions to recommend because it is both easy to install and feature-complete, delivering immediate value out of the box, all while being built on open standards. It's the first tool I install, even using it to observe my other observability tools."
"Coroot is a revolution in IT observability. This open source platform simplifies the analysis of metrics, logs and traces, providing valuable insights and unparalleled simplicity."
"For engineers and SREs tired of sifting through endless logs and fragmented metrics, Coroot offers a refreshingly intuitive yet powerful approach to modern observability."

"Coroot is the best open source observability stack you've never heard of. The out of the box experience is amazing. So much value with minimal effort."

"As someone who likes things simple that can be managed by large teams, I immediately loved Coroot. It's an amazing experience to set something up in less then thirty minutes and almost immediately attain a visual knowledge of containerized applications. And if there's an issue, their team reacts quickly."

"Coroot's use of eBPF technology for observability offers a powerful, user-friendly solution that enhances visibility, simplifies troubleshooting, and ensures your database operations run smoothly and reliably."

"Coroot is the best ePBF based APM monitoring and analytics in open source world. The cool thing is it can discover whether your infra is in nomad or Kubernetes and it will group accordingly. Minimal configuration and easily deployed anywhere."

"For enterprises juggling sprawling architectures, Coroot is nothing short of a lifesaver. It's perfect for cost-conscious teams looking to ditch expensive cloud tools like DataDog or New Relic. Plus, being fully self-hosted means your data stays under your control."

"Coroot is the best user-friendly tool to monitor and analyze network traffic. The web dashboards provides a clear overview of network connectivity and a detailed picture of network flows including packet size. it helps to easly identify repeated errors and warnings in application logs which is a common burden for development team."
"Coroot's use of eBPF technology for observability offers a powerful, user-friendly solution that enhances visibility, simplifies troubleshooting, and ensures your database operations run smoothly and reliably."
"As someone who likes things simple that can be managed by large teams, I immediately loved Coroot. It's an amazing experience to set something up in less then thirty minutes and almost immediately attain a visual knowledge of containerized applications. And if there's an issue, their team reacts quickly."
"Coroot is the best open source observability stack you've never heard of. The out of the box experience is amazing. So much value with minimal effort."
See exactly what's happening in your systems
Join the teams who troubleshoot faster with zero instrumentation observability powered by eBPF.
✓ No credit card required ✓ 2-minute setup ✓ Full-featured trial