PostgreSQL Observability Made Simple
Coroot captures every query on the wire with eBPF and reads PostgreSQL's own system views to deliver DBA-grade coverage: query performance, replication, backups, autovacuum, bloat, and wraparound. All with a quick setup.
Complete PostgreSQL Visibility
Coroot gives you end-to-end insights into PostgreSQL performance. eBPF captures every query on the wire, while system views explain exactly why the database behaves the way it does.
Full Query Transparency
See every query, its latency, and success rate without adding extensions or overhead.
Root-Cause Clarity
System views pinpoint locks, I/O bottlenecks, and CPU-heavy queries so you know why performance drops.
Works With Encrypted Traffic
Coroot monitors SSL/TLS connections safely by observing traffic before encryption and after decryption.
Per-Application Insights
Understand how each service communicates with PostgreSQL, from connection patterns to query behavior.
Correlation That Matters
Connect network-level latency with internal PostgreSQL metrics for the complete performance story.
Runs Anywhere
Works with any PostgreSQL deployment, from managed cloud services to self-hosted clusters, without extra configuration.
Built-in Health Checks, Zero Configuration
Beyond query performance, Coroot runs the checks a seasoned DBA would - and tells you the root cause, not just that something is wrong.
Availability
Detects when an instance stops accepting connections or a primary goes missing.
Query latency
Flags latency regressions and error-rate spikes seen on the wire.
Connections
Warns before you exhaust max_connections and surfaces idle-in-transaction sessions.
Replication
Splits lag into WAL shipping and apply, and catches paused or disconnected replicas.
WAL archiving
Alerts on archiver failures so point-in-time recovery never silently breaks.
Checkpoints
Spots checkpoints that stall or fall behind, with timed vs requested breakdown.
Transaction ID wraparound
Tracks XID and multixact age and names the transaction pinning the freeze horizon.
Autovacuum
Shows when autovacuum falls behind and why: disabled, throttled, slow, or no free workers.
Stale statistics
Finds tables whose planner statistics are out of date and driving bad plans.
Table and index bloat
Estimates dead space across tables and indexes so you know what to reclaim.
Storage and WAL
Watches directory size, disk usage, largest tables, and WAL retained per slot.
Backups
Catches overdue, failed, or stale backups and explains the failure in plain language.
From Database to Application
PostgreSQL doesn't live in isolation — Coroot shows how query performance impacts the services that depend on it.
Application-Aware Monitoring
See which services issue the slowest queries and how their behavior changes over time.
Deployment Correlation
Instantly connect application releases with shifts in query patterns and database load.
End-to-End Performance
Trace latency from the application layer down to PostgreSQL to understand the full user impact.
Deep insights into database performance + AI
See how applications talk to PostgreSQL and why queries slow down. Every connection, every query, every bottleneck - visible with minimal setup.
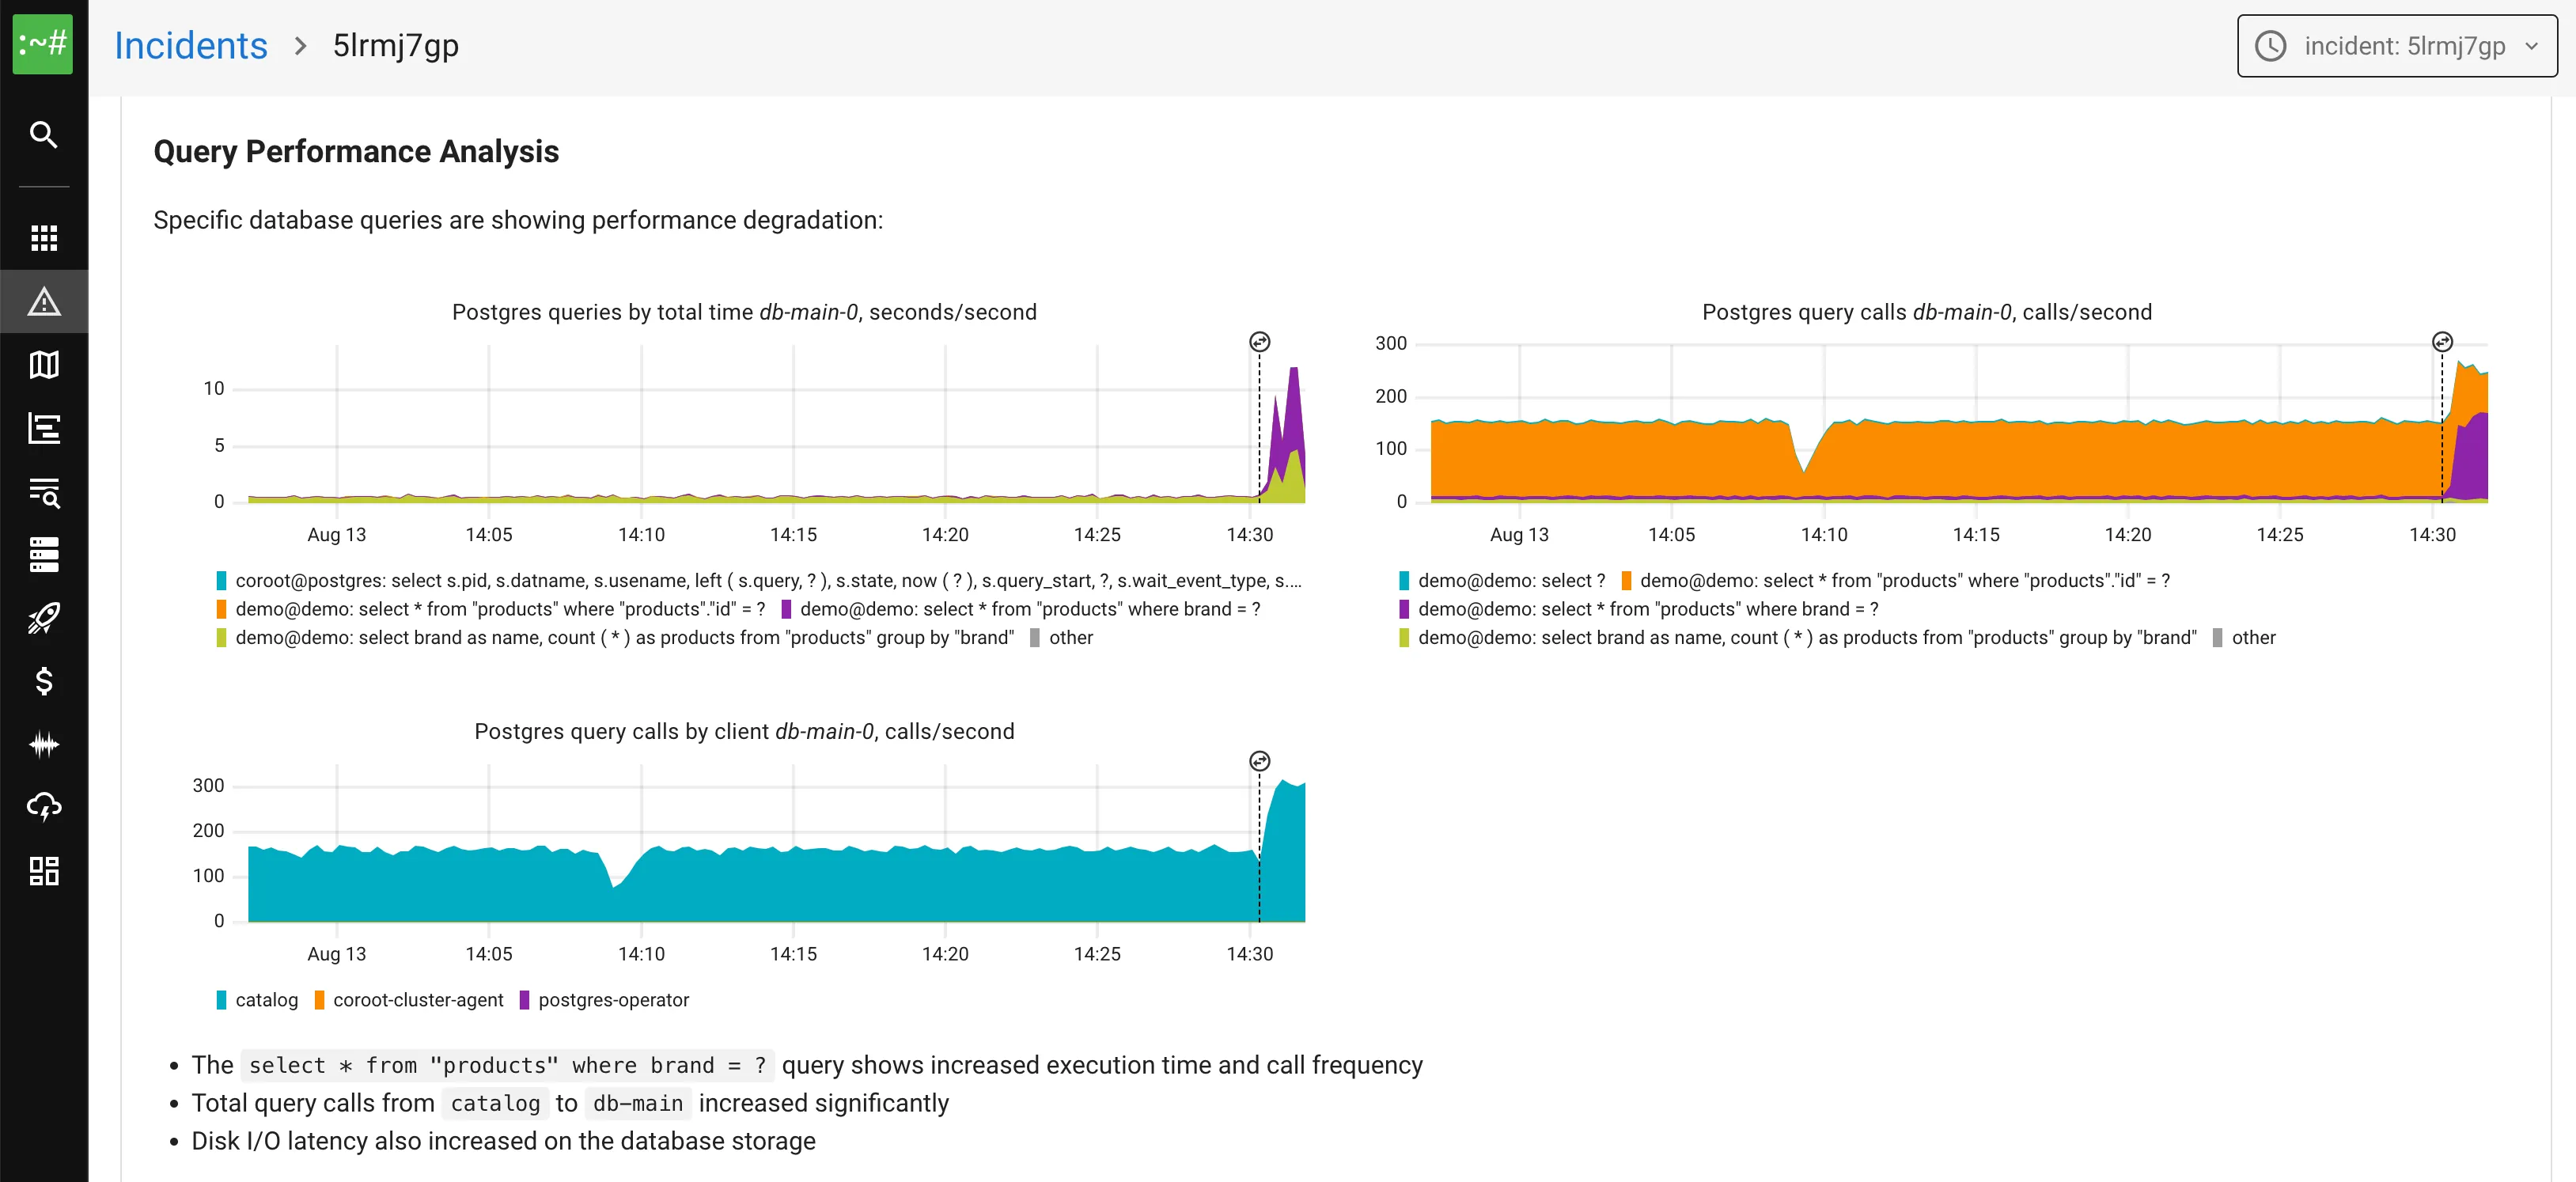
Query Performance Analysis
Automatically collect metrics from pg_stat_statements and pg_stat_activity to identify your most resource-intensive queries. See CPU usage, I/O patterns, and execution statistics correlated with wire protocol data.
Query Tracing & Performance
eBPF captures every PostgreSQL query with detailed tracing, showing latency heatmaps, error rates, and individual query performance. See exact SQL statements and execution times without any database instrumentation.

PostgreSQL Health & Metrics
Monitor PostgreSQL availability, query latency, replication lag, and connection usage with real-time charts. Get instant visibility into database health.

Backups & Recovery
Track backups across CloudNativePG and the Percona Operator in one place. Coroot catches overdue, failed, and stale backups, checks WAL archiving, and surfaces the recovery window and the operator's reason when something breaks.

Replication & WAL
Follow every replica's lag split into WAL shipping and apply, spot paused replay or disconnected receivers, and watch WAL retained per replication slot so a lagging consumer never fills the disk.

Autovacuum, Bloat & Wraparound
The internals that quietly cause outages: autovacuum falling behind, table and index bloat, stale planner statistics, and transaction ID wraparound. Coroot explains the cause and points to the table or transaction responsible.

Kubernetes-Native, Operator-Aware
Coroot understands how the major PostgreSQL operators run your clusters. It detects cluster topology and primary/replica roles automatically, and reads backup state straight from their custom resources.
CloudNativePG
Cluster topology, roles, and backup state from the CNPG custom resources.
Percona Operator
pgBackRest backups, WAL archiving, and cluster health, end to end.
Zalando
Spilo-based clusters with primary and replica role detection.
StackGres
Cluster and primary/replica role detection out of the box.
Works With All PostgreSQL Deployments
From Kubernetes clusters to managed cloud databases - monitor PostgreSQL anywhere with consistent visibility
Kubernetes
PostgreSQL running in containers with automatic pod and service discovery
Cloud
AWS RDS, Aurora, Cloud SQL with complete performance monitoring
Self-Hosted
On-premise and custom PostgreSQL deployments with full observability
Why PostgreSQL Monitoring Is Usually a Pain
Traditional monitoring tools only see one side of the story - either application metrics or database internals, but never how they connect.
How Coroot Solves This
Coroot's dual-layer approach combines wire protocol capture with PostgreSQL system views for complete visibility.
Ready to Monitor Your PostgreSQL Databases?
Start monitoring PostgreSQL with zero configuration. Works with any deployment - from Kubernetes to cloud managed databases.
✓ Zero configuration ✓ SSL/TLS monitoring ✓ Open source agent ✓ Prometheus compatible
Explore more of Coroot
One platform for metrics, logs, traces, and profiling. Here is what else it does.