Kubernetes Observability Simplified
Zero-code instrumentation using eBPF. Get complete visibility into your Kubernetes applications with automatic service discovery, deployment tracking, and actionable insights.
All in One Kubernetes Telemetry and AI Insights
Complete observability with metrics, logs, traces, profiles, and Kubernetes events - plus AI that identifies root causes and suggests remediation
Complete Telemetry Stack
All your signals in one place: metrics, logs, traces, profiles, and Kubernetes events combined for a complete view of your applications.
AI-Powered Root Cause Analysis
Skip the investigation grind. AI identifies the root cause and tells you exactly how to fix it, turning hours of debugging into minutes.
Cloud Cost Insights
Stop budget surprises! Automatically breaks down which apps are driving your cloud costs, including those sneaky cross-AZ transfers and egress charges that can blow up your bill overnight.
Automatic Service Discovery
See everything instantly. Complete service map coverage including control plane components with zero setup - eBPF discovers it all automatically.
Zero-instrumentation
Deep visibility without the work. Monitor everything at the kernel level with zero code changes and virtually no performance impact.
Deployment Impact Tracking
Know what broke and when. Automatically correlate every deployment with performance changes, resource spikes, and cost impacts.
From Zero to Full Observability in Minutes
Simple deployment, powerful insights
Deploy
Single command installs Coroot across your entire Kubernetes cluster. Works with any distribution.
Discover
All services and dependencies appear automatically. Zero configuration required.
Monitor
Get immediate insights into performance, costs, and deployment impacts across your cluster.
Why Most Observability Tools Don't Help
Having tons of data doesn't mean you get answers. Most tools dump everything on you and leave the detective work to you.
How Coroot Actually Helps
We handle the whole journey — from collecting data to giving you clear answers about what's broken, why it's broken, and how to fix it.
Stop Guessing, Start Knowing
See exactly what's happening in your cluster, understand why problems occur, and get clear steps to fix them.
AI-Powered Root Cause Analysis
No more endless digging. AI pinpoints exactly what's wrong and tells you how to fix it, turning hours of troubleshooting into minutes of action.
Explore AI features →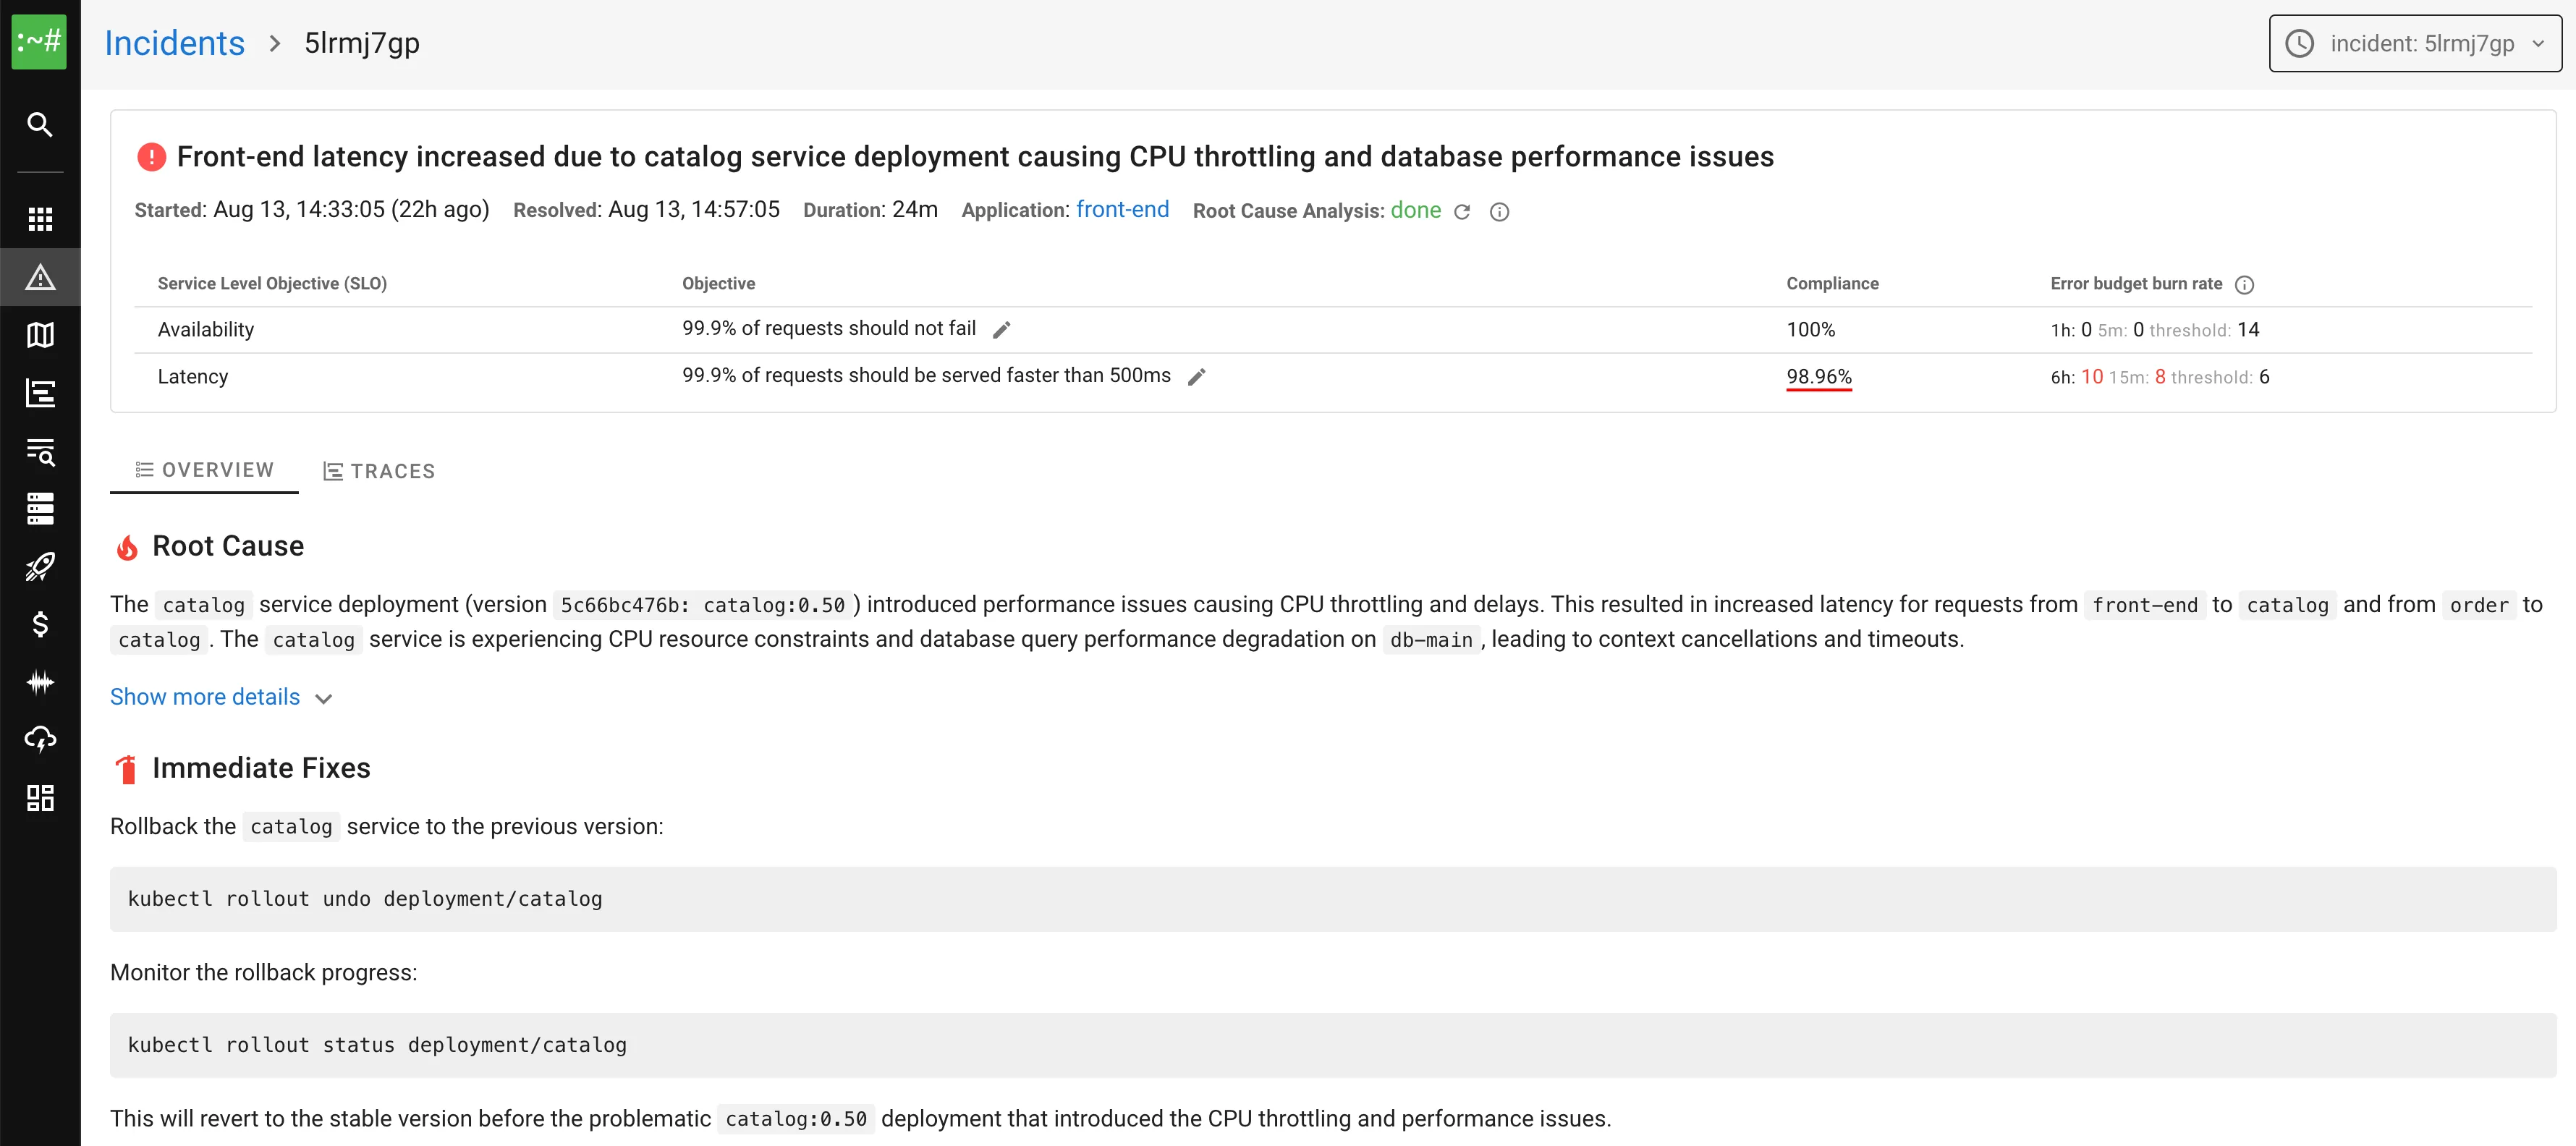
GitOps Monitoring for Argo CD & Flux
Instantly spot every OutOfSync or Degraded Argo CD and Flux application, and tie each GitOps rollout to its real impact on your workloads, so you catch bad deployments before your users do.

Smart Log Analysis
Quickly spot issues in your logs. Coroot analyzes them right on the node with minimal overhead, detects severities and recurring patterns, stores them in ClickHouse with over 10x compression ratio, and works seamlessly with any log format.

Network and DNS Monitoring
Coroot tracks network traffic, DNS queries, and service communication across your Kubernetes cluster. Measure RTT, detect packet loss, and uncover connectivity issues with detailed visibility into the network layer.

Continuous Profiling
Understand exactly where CPU time is spent, down to the line of code. Coroot shows bottlenecks with no instrumentation required, so you know what to optimize.

Cloud Cost Insights
You cannot optimize what you cannot measure. Coroot automatically tracks cloud costs without cloud account access or extra setup, and calculates cross AZ and internet egress per application so you know exactly where your budget goes.

All Your Observability Data in One Place
Stop jumping between different tools. Coroot unifies metrics, logs, traces, profiles, and Kubernetes events so you get the full picture instantly.
Metrics
Performance indicators, resource usage, GPU monitoring, and custom business metrics
Logs
Application and system logs with automatic discovery and parsing
Traces
Distributed tracing across microservices and external dependencies
Profiles
Continuous CPU profiling and performance optimization
K8s Events
Kubernetes events correlation with performance and deployment changes
Deploy with Kubernetes Operator
Infrastructure as Code approach with Custom Resources for complete configuration management
Kubernetes-Native Deployment
Choose Your Kubernetes Observability
Start with our open source Community edition or unlock enterprise features
Community Edition
Full-featured Kubernetes observability, free forever. Perfect for development and small production clusters.
Enterprise Edition
Advanced features for large-scale Kubernetes deployments, enterprise support and AI-powered insights.
Compare All Features
See detailed feature comparison between Community and Enterprise editions
Compare EditionsReady to Monitor Your Kubernetes Cluster?
Start with our free trial or deploy the open source Community edition today.
✓ Works with EKS, AKS, GKE, OpenShift, OKE ✓ Self-hosted & secure ✓ Community edition free forever
Explore more of Coroot
One platform for metrics, logs, traces, and profiling. Here is what else it does.