eBPF Observability, Zero Code Changes
Coroot uses eBPF to map your services, profile CPU usage, and measure request rate, errors, and latency for every application. No code changes, no blind spots, and full visibility within minutes of installation.
Full visibility without touching your code
eBPF gathers telemetry from the kernel, so you get deep insight into every service the moment the agent is running.
Zero instrumentation
eBPF runs in the Linux kernel, so Coroot sees every request without SDKs, sidecars, or a single line of code added to your apps.
Insights in minutes
Deploy the agent and full visibility appears within minutes. There is no instrumentation project to plan and no rollout to wait on.
Automatic service maps
Coroot discovers every service and the connections between them from kernel-level network events, mapping your architecture as it really is.
eBPF CPU profiling
Continuous, always-on CPU profiling down to the line of code, with negligible overhead and nothing to instrument.
Golden-signal SLIs
Request rate, errors, and latency are measured for every service automatically, so you have RED metrics from the first minute.
No blind spots
Because it works at the kernel level, eBPF covers legacy and third-party services you cannot instrument, including databases and message queues.
What eBPF reveals
Maps, signals, and profiles for your whole system, captured automatically from the kernel.
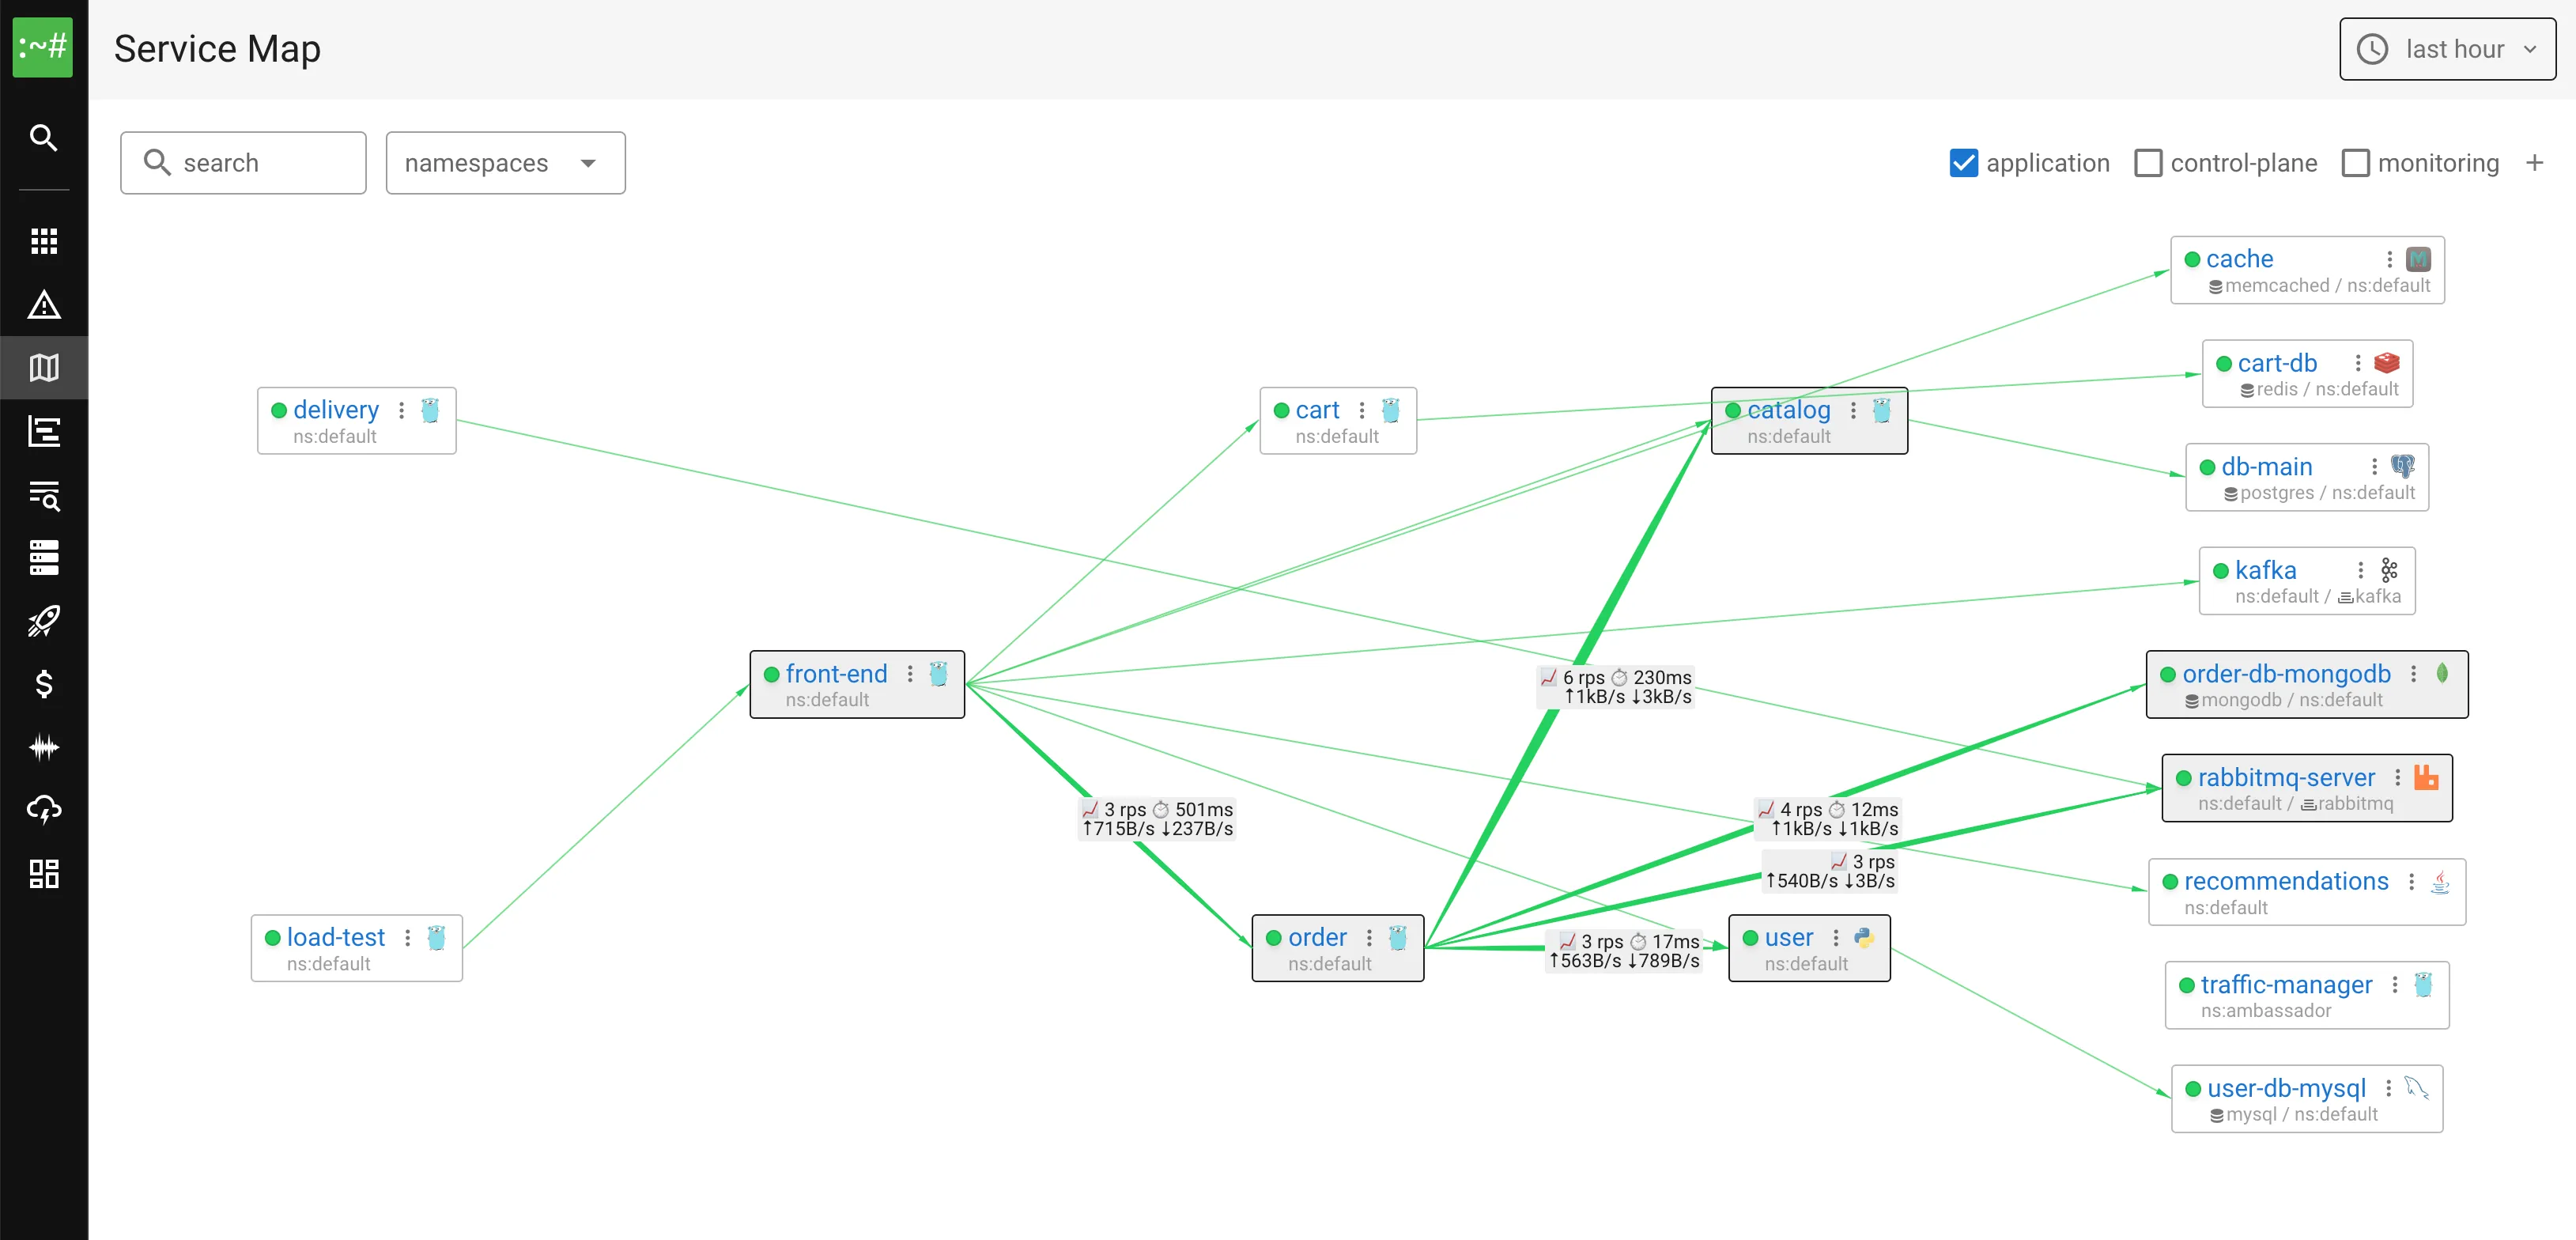
A service map that builds itself
Coroot watches kernel-level network events to discover every service and dependency, then draws an accurate map of how requests flow through your system. New services appear automatically, with no configuration.
Golden-signal SLIs for every service
Request rate, errors, and latency are measured for each application straight from network traffic, including databases and message queues. You get RED metrics and SLOs out of the box, even for services you cannot instrument.

CPU profiling down to the line of code
Always-on eBPF profiling shows exactly where CPU time goes across your services, with no instrumentation and negligible overhead, so you know precisely what to optimize.

Frequently asked questions
What is eBPF?
eBPF (extended Berkeley Packet Filter) is a Linux kernel technology that lets sandboxed programs run safely inside the kernel without changing kernel source or loading modules. It can observe system calls, network activity, and CPU usage in real time, which makes it ideal for collecting observability data with no changes to your applications.
What is eBPF observability?
eBPF observability uses eBPF programs running safely in the Linux kernel to capture metrics, traces, and profiles directly from the operating system. Because the data is gathered at the kernel level, you get visibility into every application without changing or instrumenting your code.
Does Coroot require code changes or instrumentation?
No. Coroot uses eBPF to collect telemetry automatically, so there are no SDKs to add, no sidecars to configure, and no code changes. You install the agent and insights appear within minutes.
What is the performance overhead of eBPF?
eBPF is designed to be lightweight and runs in the kernel with negligible overhead. Coroot samples efficiently so continuous profiling and network monitoring add only a small, predictable cost.
Which protocols can Coroot capture with eBPF?
Coroot's eBPF tracer automatically parses a wide range of application protocols, including HTTP, Postgres, MySQL, MongoDB, Redis, Memcached, Cassandra, Kafka, ClickHouse, ZooKeeper, and FoundationDB. This is what powers the automatic service map and the request, error, and latency metrics for every service, with no instrumentation.
Can Coroot capture encrypted (TLS) traffic?
Yes. Coroot hooks into common TLS libraries with eBPF uprobes to read request data before it is encrypted and after it is decrypted, so it can observe encrypted traffic such as HTTPS without decrypting anything on the wire. For runtimes that manage TLS internally, like Java, Coroot attaches the instrumentation dynamically.
Does eBPF work for legacy and third-party services?
Yes. Because eBPF observes the kernel rather than your application code, it covers services you cannot instrument, including legacy applications, closed-source software, databases, and message queues. There are no blind spots.
Is eBPF observability only for Kubernetes?
No. Coroot's eBPF agent runs anywhere Linux does, so you get the same service maps, SLIs, and profiling on virtual machines and bare-metal hosts as you do on Kubernetes. Kubernetes and non-Kubernetes workloads appear together in a single view.
What are the requirements to run eBPF monitoring?
Coroot's eBPF-based agent runs on modern Linux kernels and works across Kubernetes, virtual machines, and bare metal. See the documentation for exact kernel version and capability requirements.
Is Coroot open source?
Yes. Coroot Community Edition is open source and free to self-host, with an Enterprise Edition available for additional features and support.
Explore more of Coroot
One platform for metrics, logs, traces, and profiling. Here is what else it does.
See everything, instrument nothing
Install Coroot and get eBPF service maps, golden-signal SLIs, and CPU profiling across your whole system in minutes.
Open-source Community Edition · Deploy in minutes with Helm or the Kubernetes Operator