Better Network observability in Coroot
 Peter Zaitsev
One service can’t connect to another (or can’t establish a database connection) – underneath this simple definition, there can be two very different conditions.
First – we may have a service process down. In this case, the Kernel stack is operational, so we are getting the packet back, indicating the connection was refused.
Second – when network flow is completely disrupted due to connectivity issues, firewall, or a node being completely down. In this case, we do not get any response whatsoever.
Before the update, while Coroot had metrics and presented them in charts, it would not specifically identify them as issues.
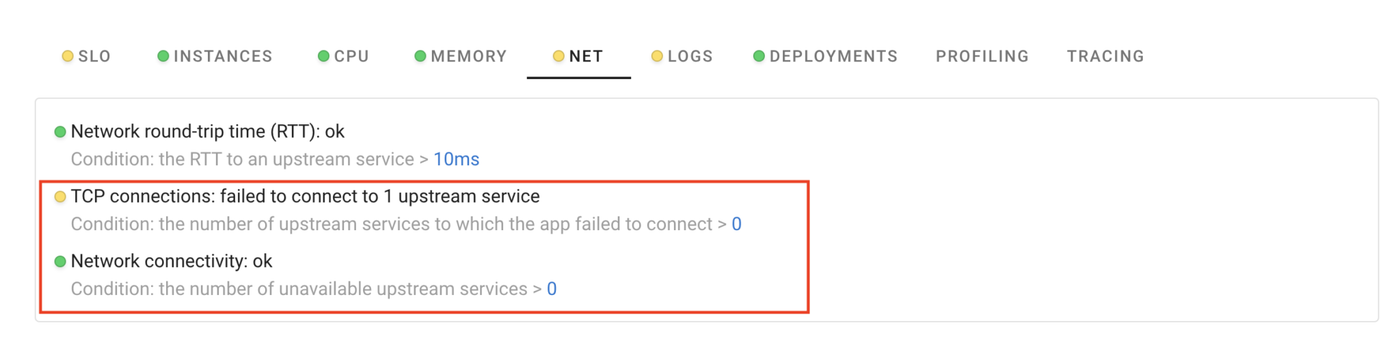
In the Coroot 0.29.5 release, we added automatic inspections for these issues, so users no longer have to analyze charts manually.
If you’re interested to learn more about Network Failures and how Coroot identifies them, check out our previous articles on Spotting Network Failures in Kubernetes and Measuring Network Round Trip Time Precisely.