Chaos-driven observability: spotting network failures in a Kubernetes cluster
 Nikolay Sivko
Chaos engineering involves intentionally introducing failures and faulty scenarios into distributed systems to test their resilience. It not only provides insights into the reliability of your system but also helps battle-test your observability stack. At Coroot, we leverage this approach to ensure that our product accurately identifies different failure scenarios.
In this post, we’ll simulate different network failures in a distributed system and see how they can be detected.
Lab
I’ll be using the same demo project we use for Coroot’s live demo. This demo project is a set of services that communicate with each other and various databases, accompanied by a load generator that emulates user behavior. In addition, Chaos Mesh is used for failure injection.
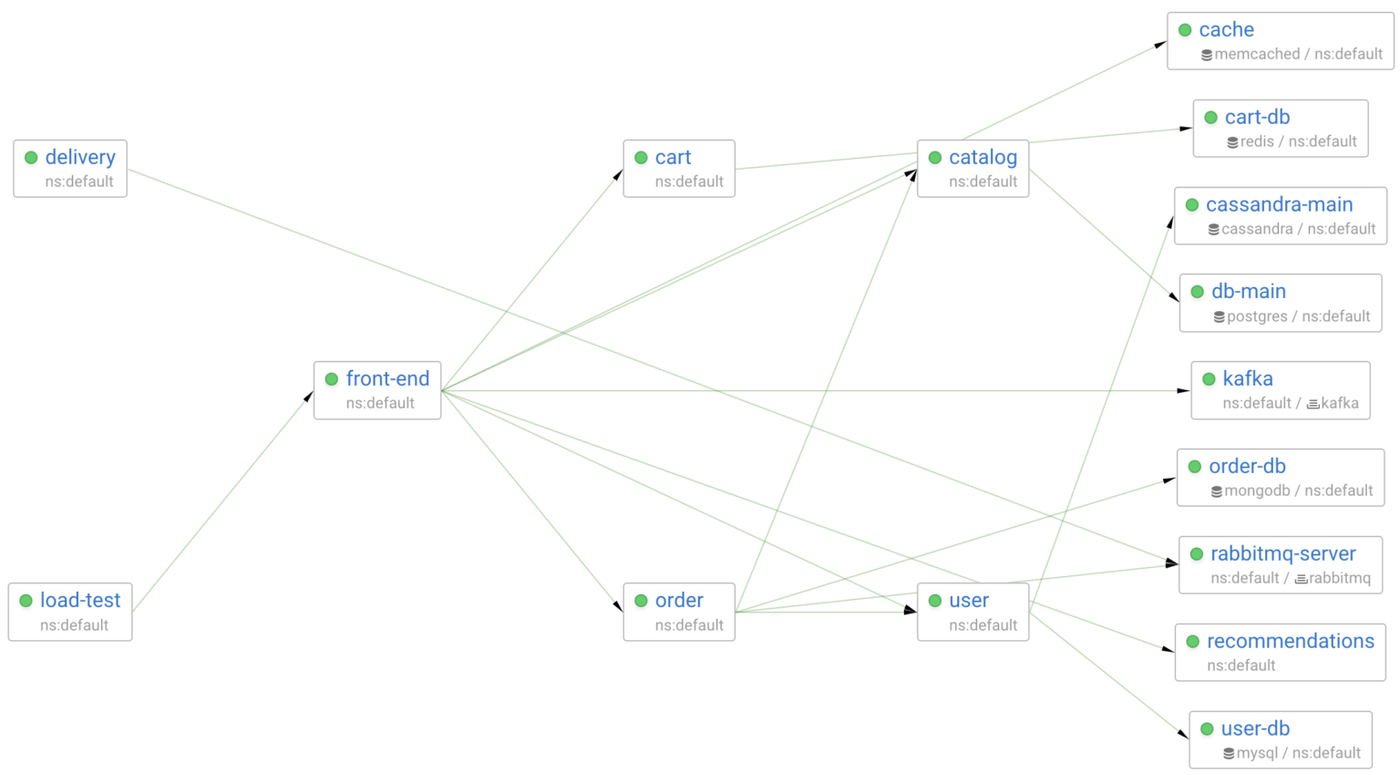
In this post, I’m going to simulate network failures between front-end and one of the services it communicates with. So, it’s better to observe this at the Pod-to-Pod level.
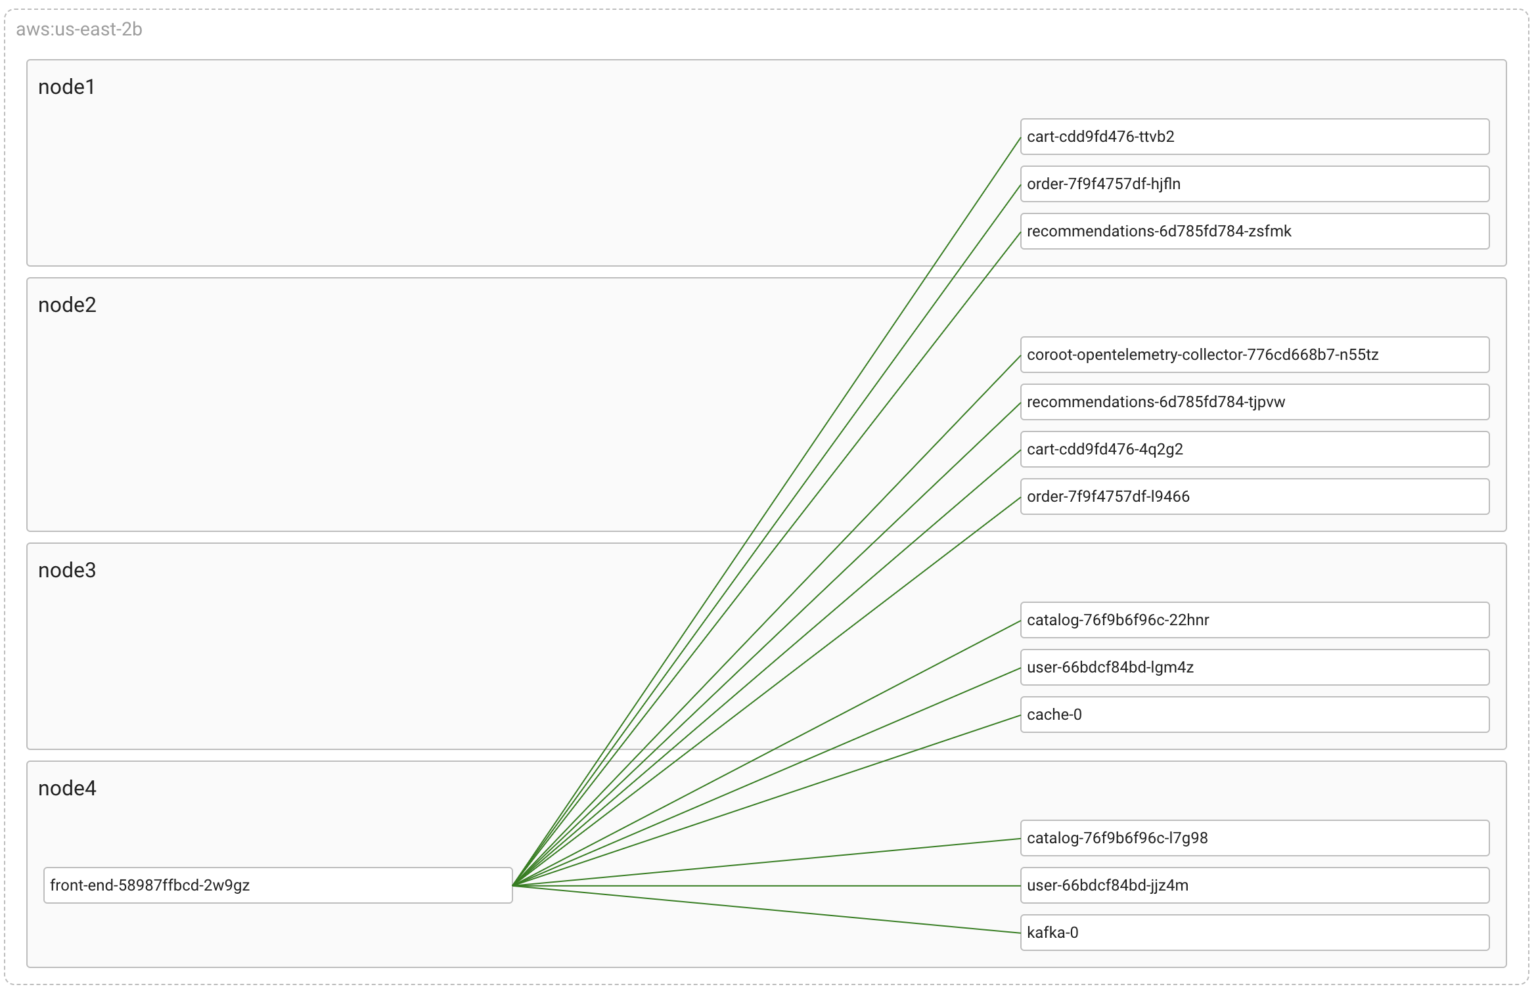
Now, let’s introduce some chaos by cutting one of these links
Network partitioning
The Chaos Mesh spec below configures Linux’s tc-netem to drop all packets between front-end and one of the catalog‘s pods.
kind: NetworkChaos
apiVersion: chaos-mesh.org/v1alpha1
metadata:
  namespace: default
  name: net-partition
spec:
  selector:
    namespaces:
      - default
    labelSelectors:
      name: catalog
    pods:
      default:
        - catalog-76f9b6f96c-22hnr
  mode: all
  action: partition
  direction: to
  target:
    selector:
      namespaces:
        - default
      labelSelectors:
        name: front-end
    mode: all
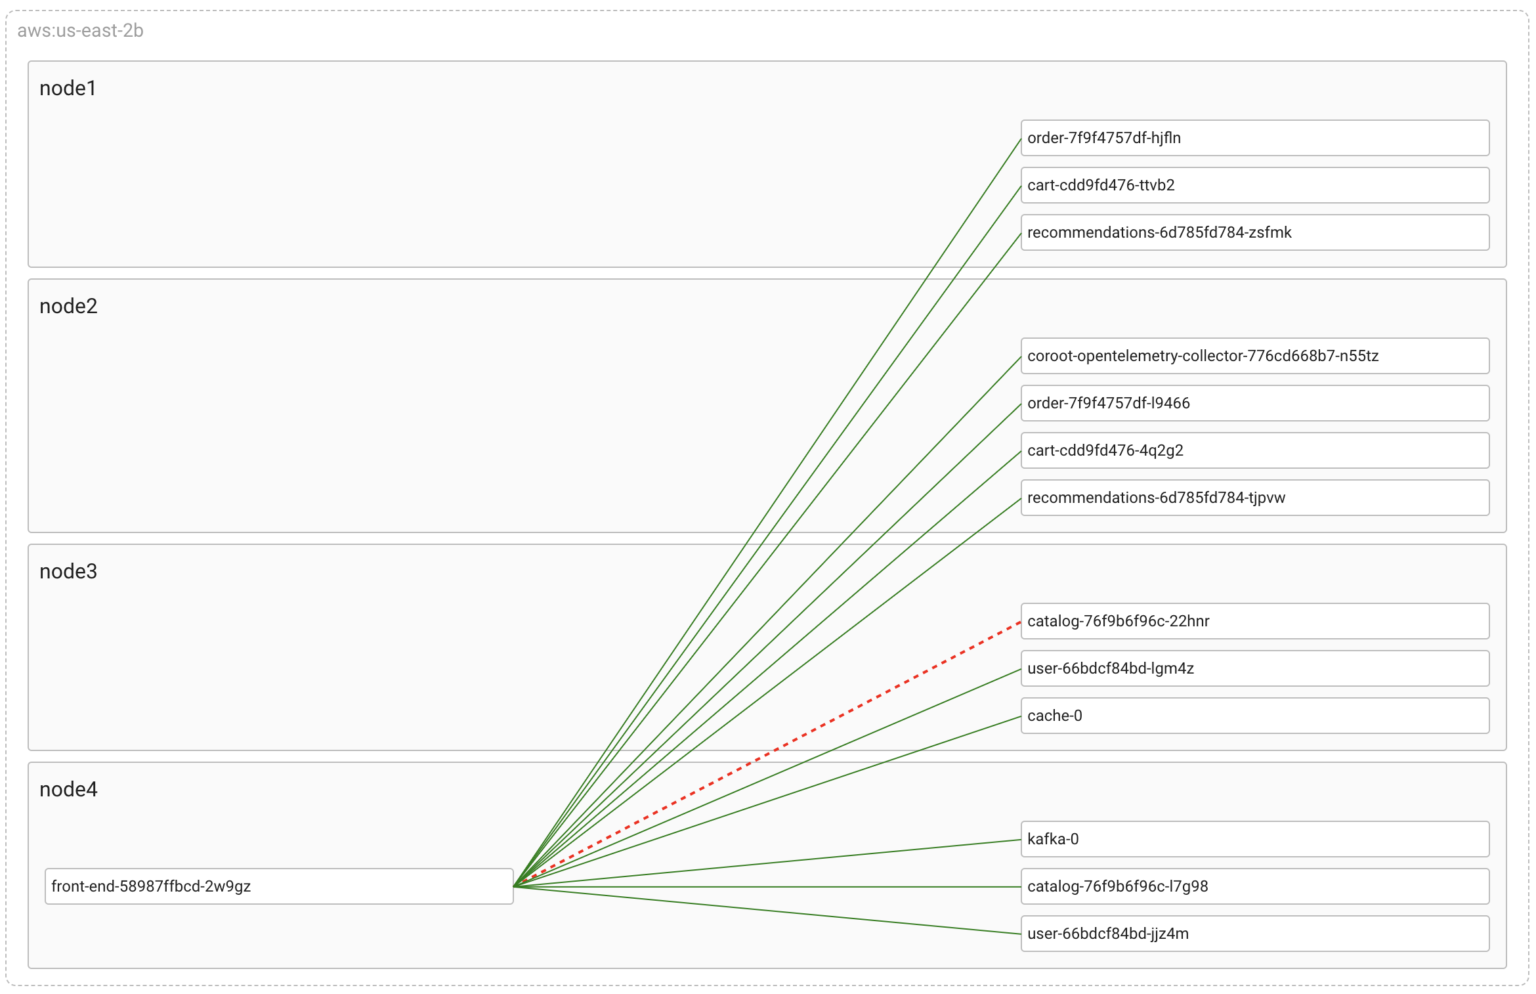
As you can see, Coroot has detected the connectivity issue and highlighted the corresponding link on the map. It utilizes the container_net_latency_seconds metric, similar to how we manually detect packet loss using ping.
To gather this metric, Coroot’s agent traces all outbound connections from all containers on the node at the eBPF-level. Next, it measures the network Round-Trip Time (RTT) between each container and their active connection endpoints. This is done using ICMP probes, which help determine the time it takes for a packet to travel from the container to the destination and back.
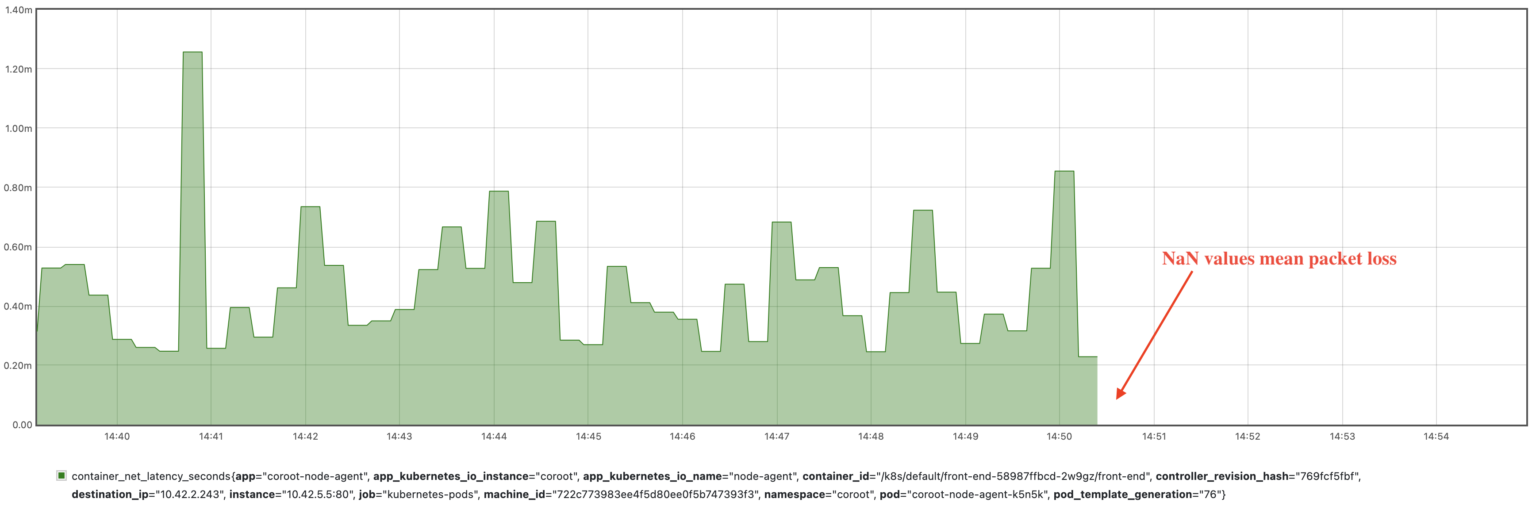
In the event of packet loss during the measurement process, the agent reports NaN (Not a Number) as the metric value, indicating that the measurement was not successful due to packet loss.
As a result, we can easily monitor the network between any given pods. In our case, we can select the metric reflecting the affected connection by the container_id of the front-end’s pod and the IP address of the catalog’s pod (10.42.2.243)
container_net_latency_seconds{container_id="/k8s/default/front-end-58987ffbcd-2w9gz/front-end", destination_ip="10.42.2.243"}
Since the agent dynamically discovers and monitors all active connections, there is no need to configure anything when the network topology changes. This is especially valuable in dynamic environments, such as Kubernetes clusters, where containers can constantly appear and disappear.
Network delay
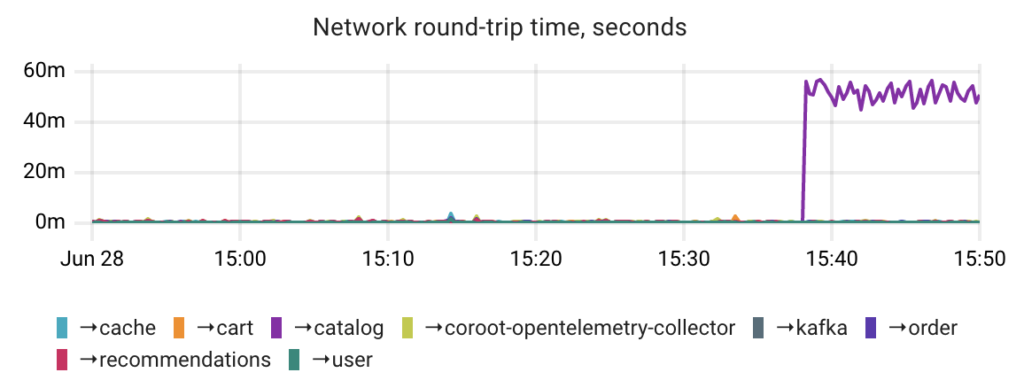
Now, let’s restore connectivity and add a delay of 50±10ms to each packet between those pods. As a result, the pods will be able to communicate, but the communication will be much slower than before.
kind: NetworkChaos
apiVersion: chaos-mesh.org/v1alpha1
metadata:
  namespace: default
  name: net-delay
spec:
  selector:
    namespaces:
      - default
    labelSelectors:
      name: catalog
    pods:
      default:
        - catalog-76f9b6f96c-22hnr
  mode: all
  action: delay
  delay:
    latency: 50ms
    correlation: '0'
    jitter: 10ms
  direction: both
  target:
    selector:
      namespaces:
        - default
      labelSelectors:
        name: front-end
    mode: all
To detect such issues, Coroot also uses the container_net_latency_seconds metric comparing it against a threshold (10ms by default).
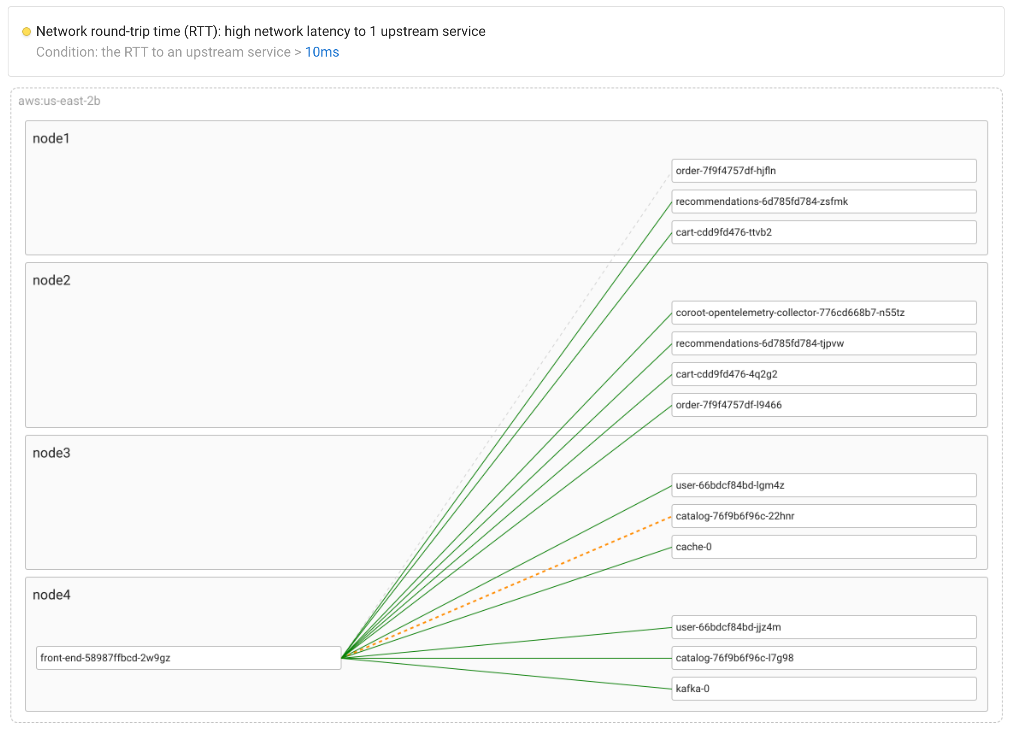
To simplify spotting any network latency issues, Coroot consolidates its granular latency metrics into a Service-to-Service view.
Alternatively, the internal TCP RTT metric can be used to detect network latency issues. However, it may not always provide accurate results for several reasons:
- The TCP stack reports a calculated average or smoothed value of the TCP RTT measurements within a TCP connection.
- The RTT measurement can be influenced by the TCP SACK (Selective Acknowledgments) mechanism. In such cases, the RTT reflects the transmission of multiple segments and cannot be considered as a true round-trip time.
Packet loss
As you may have noticed, the previous two scenarios can be easily detected using a relatively straightforward metric. However, detecting partial failures, such as partial network packet loss, poses a greater challenge in real-world situations.
Let’s simulate a scenario with a 30% packet loss and explore how this failure can be identified.
kind: NetworkChaos
apiVersion: chaos-mesh.org/v1alpha1
metadata:
  namespace: default
  name: packet-loss-30
spec:
  selector:
    namespaces:
      - default
    labelSelectors:
      name: catalog
    pods:
      default:
        - catalog-76f9b6f96c-22hnr
  mode: all
  action: loss
  loss:
    loss: '30'
    correlation: '0'
  direction: to
  target:
    selector:
      namespaces:
        - default
      labelSelectors:
        name: front-end
    mode: all
Since only a portion of the packets are dropped in this scenario, it may not significantly impact the container_net_latency_seconds metric. This is because statistically, ICMP echo packets may remain unaffected.
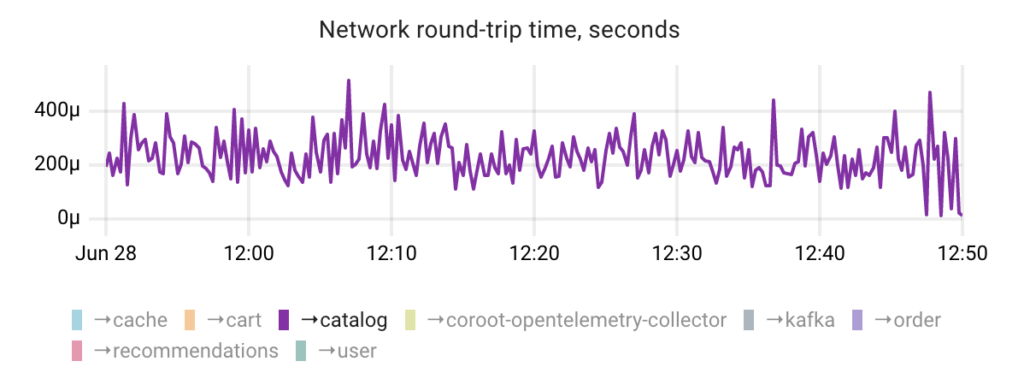
By default, Coroot’s agent performs one ICMP probe per connection during each Prometheus scrape, e.g. once every 15 seconds. Although it’s possible to increase the frequency of these probes, doing so does not ensure 100% detection of packet loss.
Let’s review the processes that occur in the TCP/IP stack when packets are lost. One crucial mechanism in such cases is packet retransmission. Therefore, monitoring the number of retransmitted TCP segments can help identify partial packet loss.
Additionally, unlike surrogate ICMP probes, this metric does not rely on probability. Instead, it provides a comprehensive overview of what happened with actual TCP connections.
However, the Linux kernel provides only a global counter of retransmitted TCP segments.
$ netstat -s |grep -i retransmitted
    24851 segments retransmitted
Having this metric broken down by container and connection direction would indeed be incredibly valuable. Thanks to eBPF, it’s now possible to extract any required information directly from the kernel. Coroot’s agent gathers such a metric by using the tcp:tcp_retransmit_skb kernel tracepoint.
Returning to our failure scenario, by examining the number of TCP retransmissions broken down by upstream services, we can easily identify the issue.
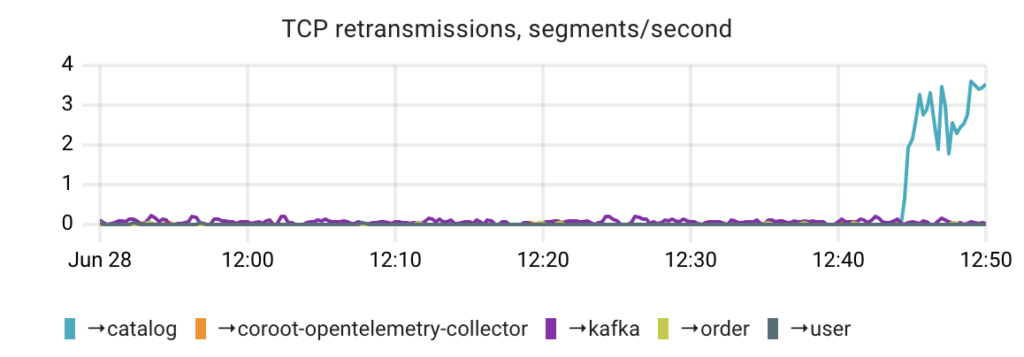
Furthermore, the TCP retransmission mechanism is also triggered in the event of out-of-order packets or when there is insufficient bandwidth available for transmitting or receiving packets.
Conclusion
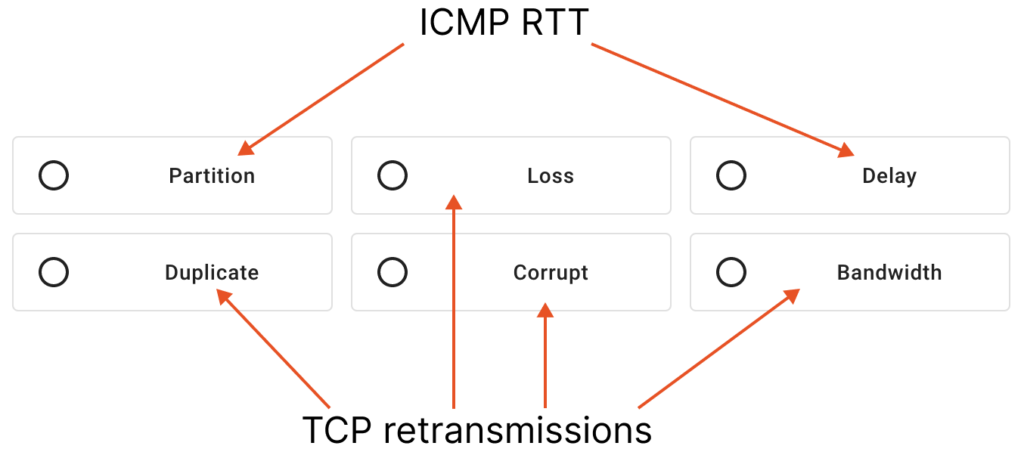
As you can see, it’s possible to identify all the network attack types provided by Chaos Mesh using just two fine granular metrics.
It’s worth mentioning that most observability tools typically offer only network interface metrics, which are entirely useless when it comes to diagnosing network failures. Perhaps this is because no one has tried to test these tools on real failure scenarios 😉
At Coroot, we leverage Chaos Engineering to ensure that our product can help you quickly pinpoint the root causes of even the most complex failures.
Follow the instructions on our Getting started page to try Coroot now. Not ready to Get started with Coroot? Check out our live demo.
If you like Coroot, give us a ⭐ on GitHub️ or share your experience on G2.
Any questions or feedback? Reach out to us on Slack.