When discussing the technical foundations of observability, several key components, often referred to as the “pillars,” emerge. While there is no universally agreed-upon number of pillars, this post will focus on four fundamental elements: metrics, logs, traces, and profiles.
Metrics, logs, and traces
- Metrics: Numerical representations of system behavior over time. They provide a high-level overview of system health and performance. Examples include CPU usage, memory consumption, and response times. While valuable, metrics often lack context and require further investigation.
- Logs: Textual records of events and activities within a system. They offer detailed information about system behavior but can be overwhelming due to volume. Effective log management involves filtering, searching, and analyzing log data.
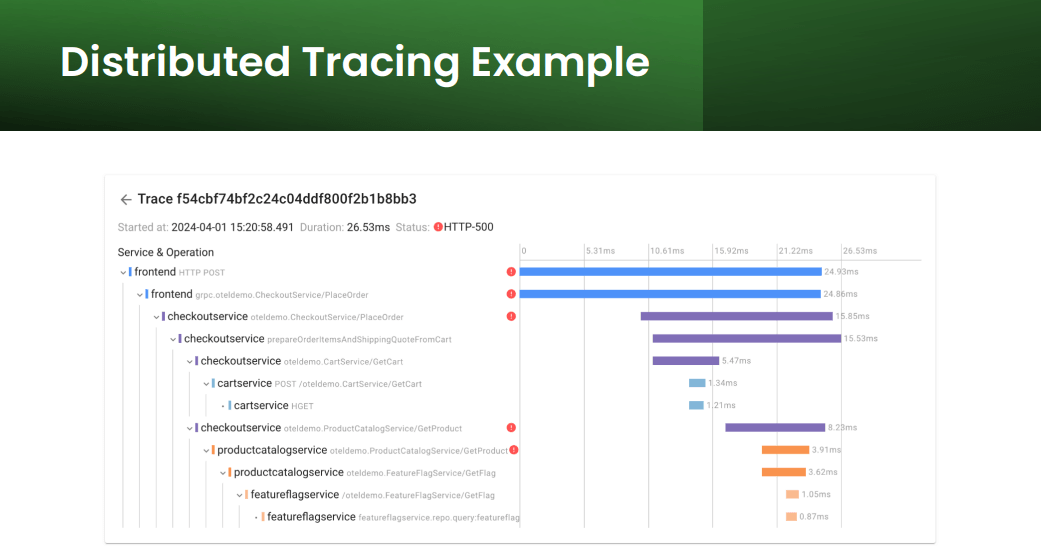
- Traces: Records the journey of a request through a distributed system, providing insights into latency, errors, and dependencies. Traces are essential for understanding complex system interactions but can be computationally expensive to collect and process.
The importance of sampling
Due to the vast amount of data generated by metrics, logs, and traces, sampling is often employed to reduce data volume while maintaining representative information. However, it’s important to balance the need for data reduction with the potential loss of valuable insights.
Visualizing observability data
Effectively visualizing observability data is crucial for gaining insights. Tools and dashboards should be designed to present information in a clear and actionable manner.
Profiling: A deep dive into performance
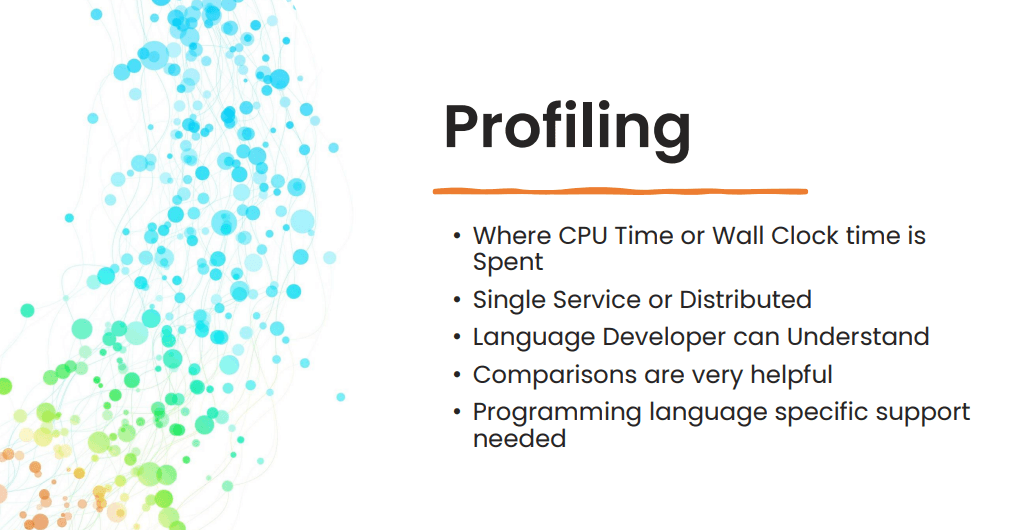
The fourth pillar of observability is profiling. Unlike metrics, logs, and traces, which provide a broad overview of system behavior, profiling focuses on the granular details of code execution.
- Profiling: Measures the performance of software by monitoring resource utilization, such as CPU time, memory consumption, and network I/O. This data helps identify performance bottlenecks and optimize code efficiency. Profiling can be applied to individual services or across distributed systems for a holistic view of performance.
A key advantage of profiling is its ability to provide insights at the code level, enabling developers to pinpoint performance issues with precision. However, profiling can be resource-intensive and requires careful consideration of when and how to collect data.
Instrumentation: Collecting observability data
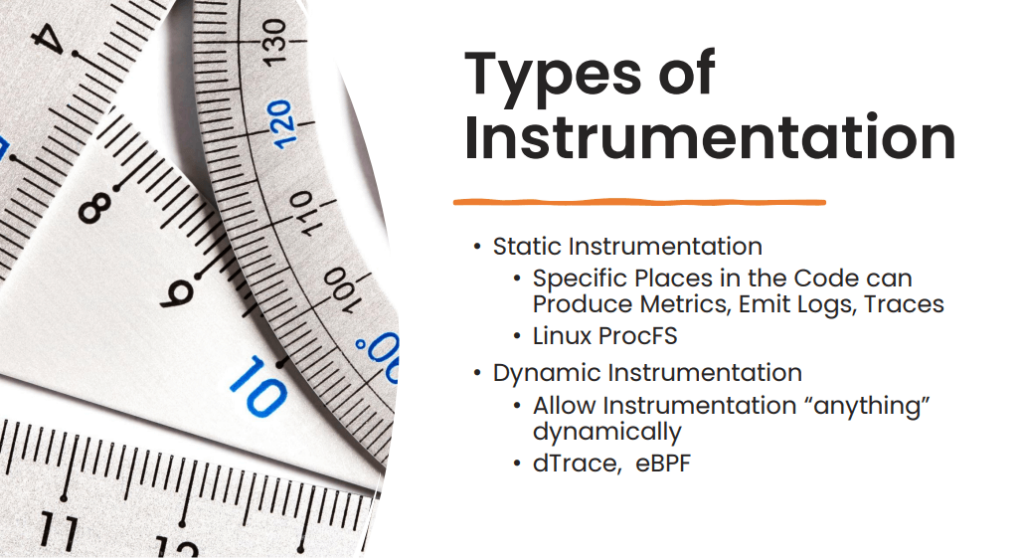
To collect the data necessary for metrics, logs, traces, and profiles, instrumentation is required. Instrumentation involves adding code or agents to applications and infrastructure to capture relevant data points.
There are two primary types of instrumentation:
- Static instrumentation: Built-in mechanisms within operating systems or applications that collect data without requiring additional code. Examples include Linux’s ProcFS and performance counters.
- Dynamic instrumentation: Code added to applications at runtime to gather specific data points. Tools like DTrace and eBPF enable dynamic instrumentation, offering flexibility in data collection.
Instrumentation and key observability technologies
Instrumentation is the process of collecting data from a system for observability purposes. There are several key types:
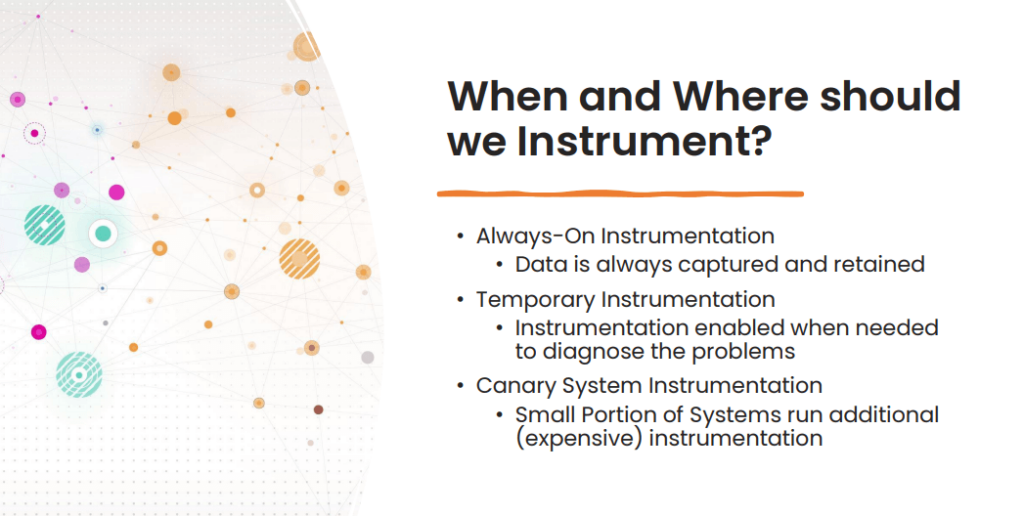
- Always-on instrumentation: Continuously collects data, often with minimal performance impact.
- Temporary instrumentation: Enabled for specific troubleshooting or debugging purposes.
- Sampling instrumentation: Collects data from a subset of system instances to reduce overhead while maintaining representative data.
When choosing instrumentation methods, it’s essential to balance the need for data with the potential performance impact.
Open Metrics and Open Telemetry
Two critical technologies for observability are Open Metrics and Open Telemetry:
- Open Metrics: Focuses on standardizing how applications expose metrics. It provides a common format for metric data, making it easier for monitoring tools to consume and process.
- Open Telemetry: A broader standard covering metrics, logs, and traces. It offers a comprehensive approach to collecting and exporting telemetry data, enabling more in-depth analysis and troubleshooting.
While Open Metrics is more focused, Open Telemetry provides a more comprehensive solution for observability.
eBPF and the RED method: A powerful combination
eBPF: A game-changer in observability
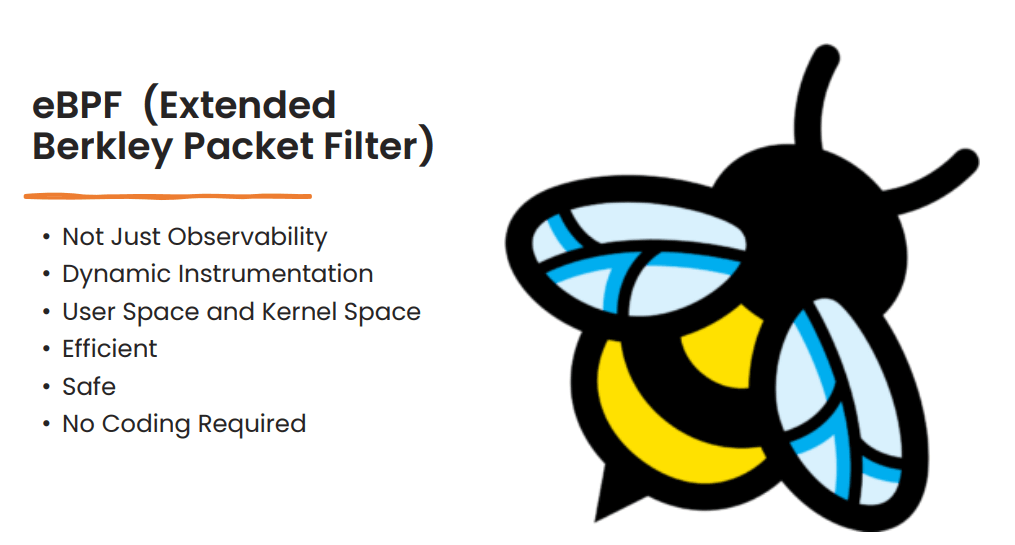
eBPF (Extended Berkeley Packet Filter) has emerged as a transformative technology in the observability landscape. It empowers developers to dynamically instrument applications and systems without modifying source code, providing unparalleled flexibility and efficiency.
The RED method: A practical framework
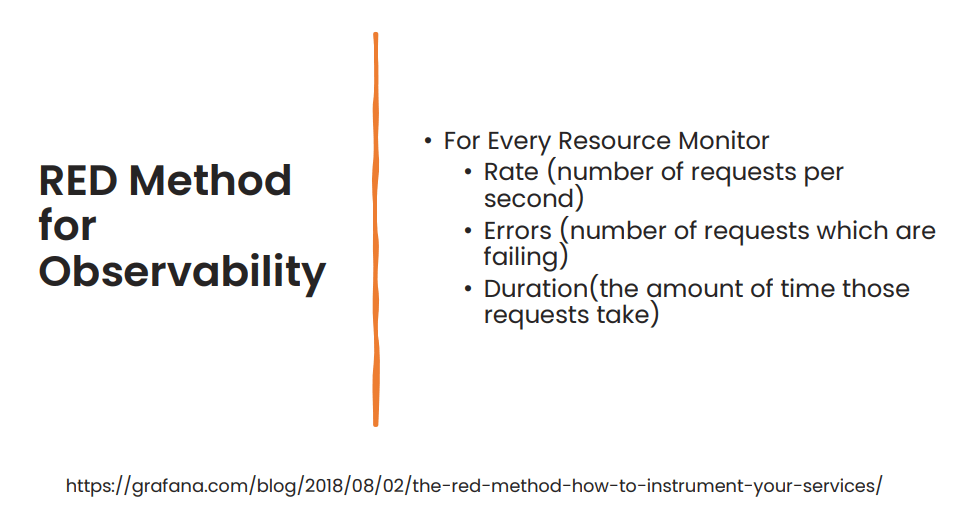
The RED method (Rate, Error, Duration) offers a structured approach to monitoring and analyzing system health. Developers can effectively identify and address performance issues by focusing on these three key metrics.
- Rate: The frequency of requests or events.
- Error: The number of failed requests or errors.
- Duration: The time taken to process requests.
The RED method aligns well with SRE (Site Reliability Engineering) practices by enabling the definition of SLIs (Service Level Indicators) and SLOs (Service Level Objectives).
Combining eBPF and RED
By leveraging eBPF to collect data on rate, error, and duration, organizations can gain deep insights into system performance and identify potential issues proactively. This combination provides a robust foundation for building reliable and efficient applications.
Key benefits of this approach:
- Early detection of anomalies: By monitoring rate, error, and duration metrics, potential problems can be identified before they escalate.
- Improved performance: Analyzing duration metrics can help pinpoint performance bottlenecks and optimize code.
- Enhanced reliability: Tracking error rates can help identify and address system failures.
- Data-driven decision-making: The RED method provides quantitative data to support informed decision-making.
Conclusion
Effective observability is built on a solid foundation of metrics, logs, traces, and profiles. By understanding these pillars and the instrumentation techniques to collect them, organizations can gain unprecedented visibility into their systems. The RED method provides a practical framework for applying these insights to assess service health and identify areas for improvement.
As technology continues to evolve, the importance of observability will only grow. By embracing these concepts and tools, organizations can build more resilient, efficient, and reliable systems.
To learn about common observability challenges and how Coroot addresses them, check out our previous post, “Conquering observability challenges with Coroot”