If you’re an experienced engineer, you likely have comprehensive observability and monitoring set up for your production systems. So if issues arise, you’re empowered to resolve them quickly.
Yet, there are way too many systems out there, especially smaller and simpler ones, which are running with only rudimentary observability systems, or no observability at all. This means when an application goes down or starts to perform poorly, it may be very hard to pinpoint and resolve the issue.
This is where Emergency Observability comes into play – if spending 15 minutes checking for “usual suspects” and random googling does not help, it may be the time to do what you needed to do long time ago – get observability solutions installed, so you can resolve this and future problems efficiently.
For example, as one Coroot users told us, they were motivated to finally install Coroot when their Cloud observability vendor went down for a prolonged period of time and they just needed to avoid flying blind… Coroot got them covered.
Let’s look into the requirements for such observability solutions installed in an emergency:
- Simple to install, as we need to resolve the ongoing problem as fast as possible.
- Comprehensive, covering all the infrastructure and services, as we want to be able to resolve the issue no matter where it comes from.
- Easy to use, as you can’t afford steep learning curves when you need a solution now.
- Low overhead, as we do not want to create significant extra load for an already stressed system.
While I am biased, I think Coroot is a fantastic solution if this is the situation you find yourself in
- Coroot is very simple to install, taking just few lines of code for the whole Kubernetes cluster, or one simple line per node for Cloud,VM or Bare Metal installations. As Coroot uses eBPF it is able to provide very deep insights with zero agent configuration.
- Coroot also automatically discovers and covers all the services in your environments and communication between them, leaving no blindspots
- Coroot provides you actionable insights rather overwhelming number of dashboards, many other observability solutions provide, meaning you will find the root cause of the problem in no time
- Coroot comes with very low overhead and low resource requirements, adding no significant additional strain for your system
To learn more about Coroot you can check the Overview or explore the Demo, let me however include couple of screenshots of features you will find the most critical if you deployed your observability solution in emergency
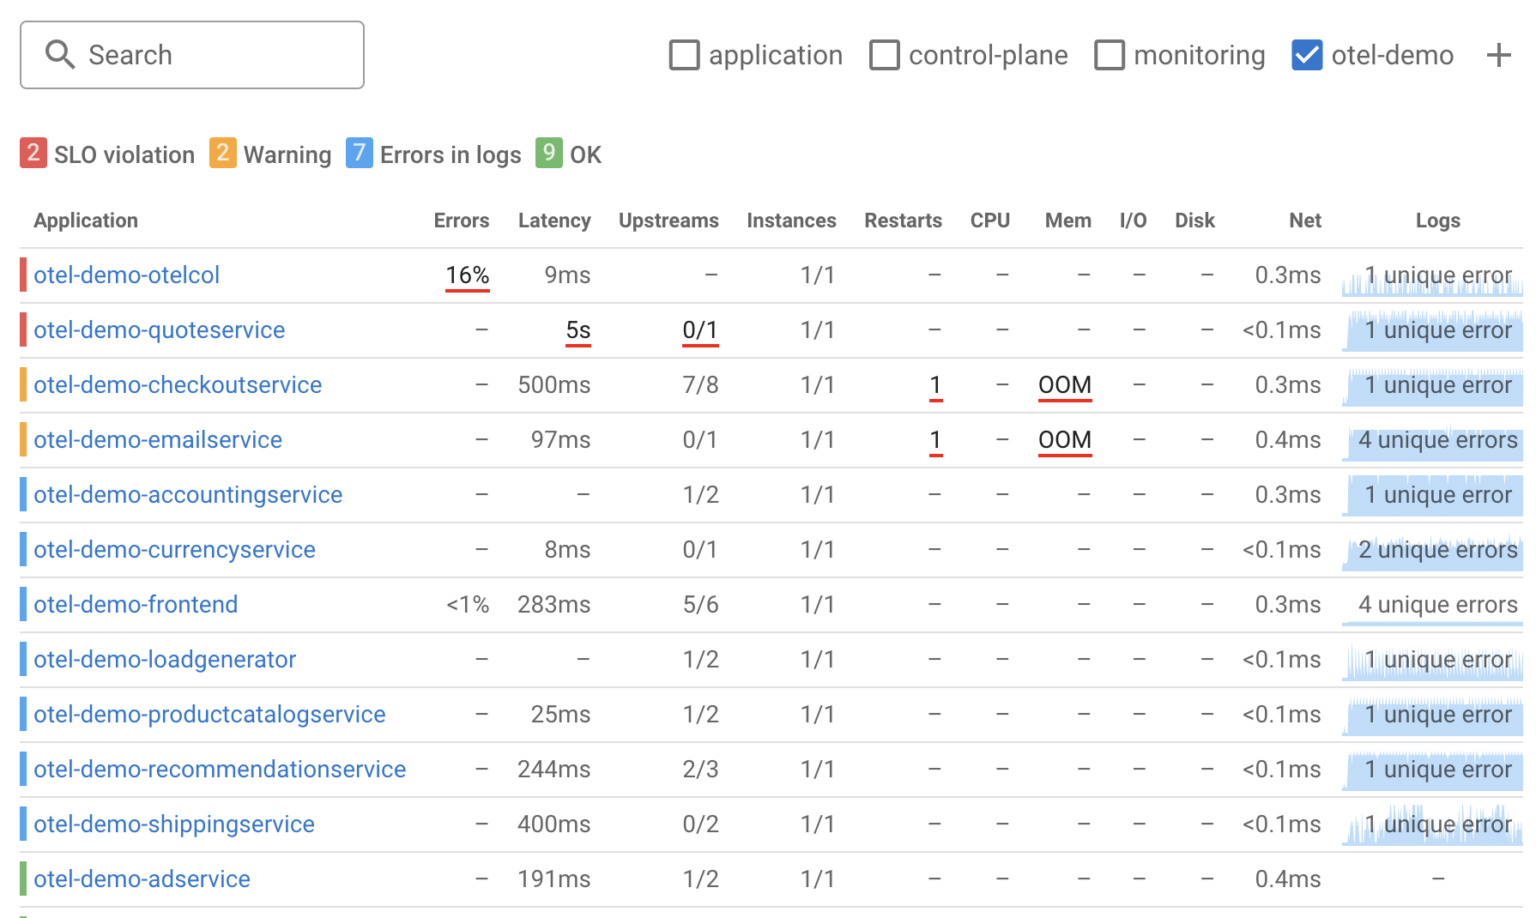
Application health summary is awesome at automatically floating up the most problematic applications/services so you will instantly know what needs attention
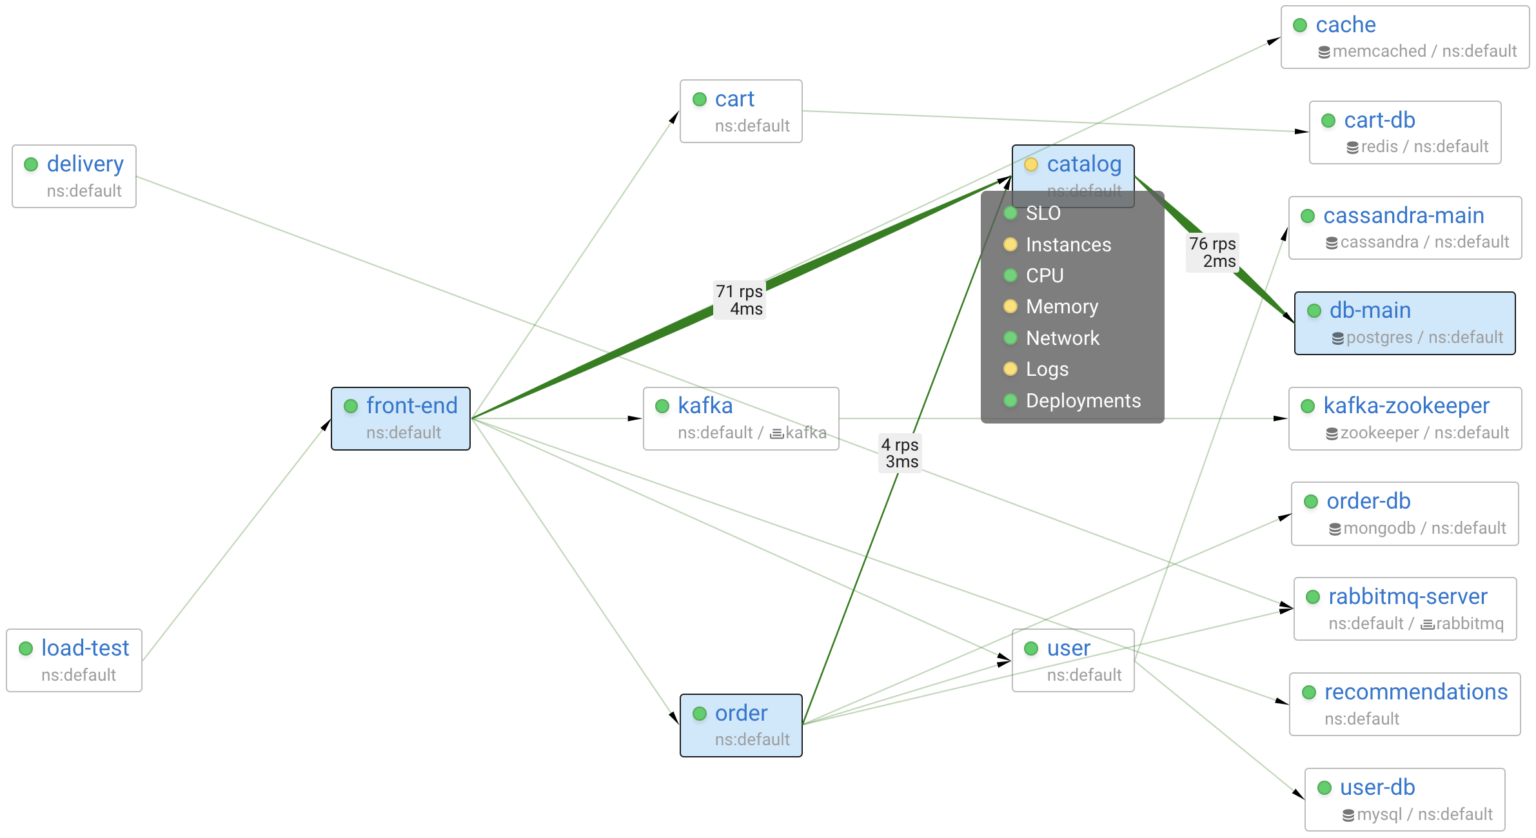
The Actual Service Map will show you what services are running, how they are communicating with each other and where errors or high latency take place.
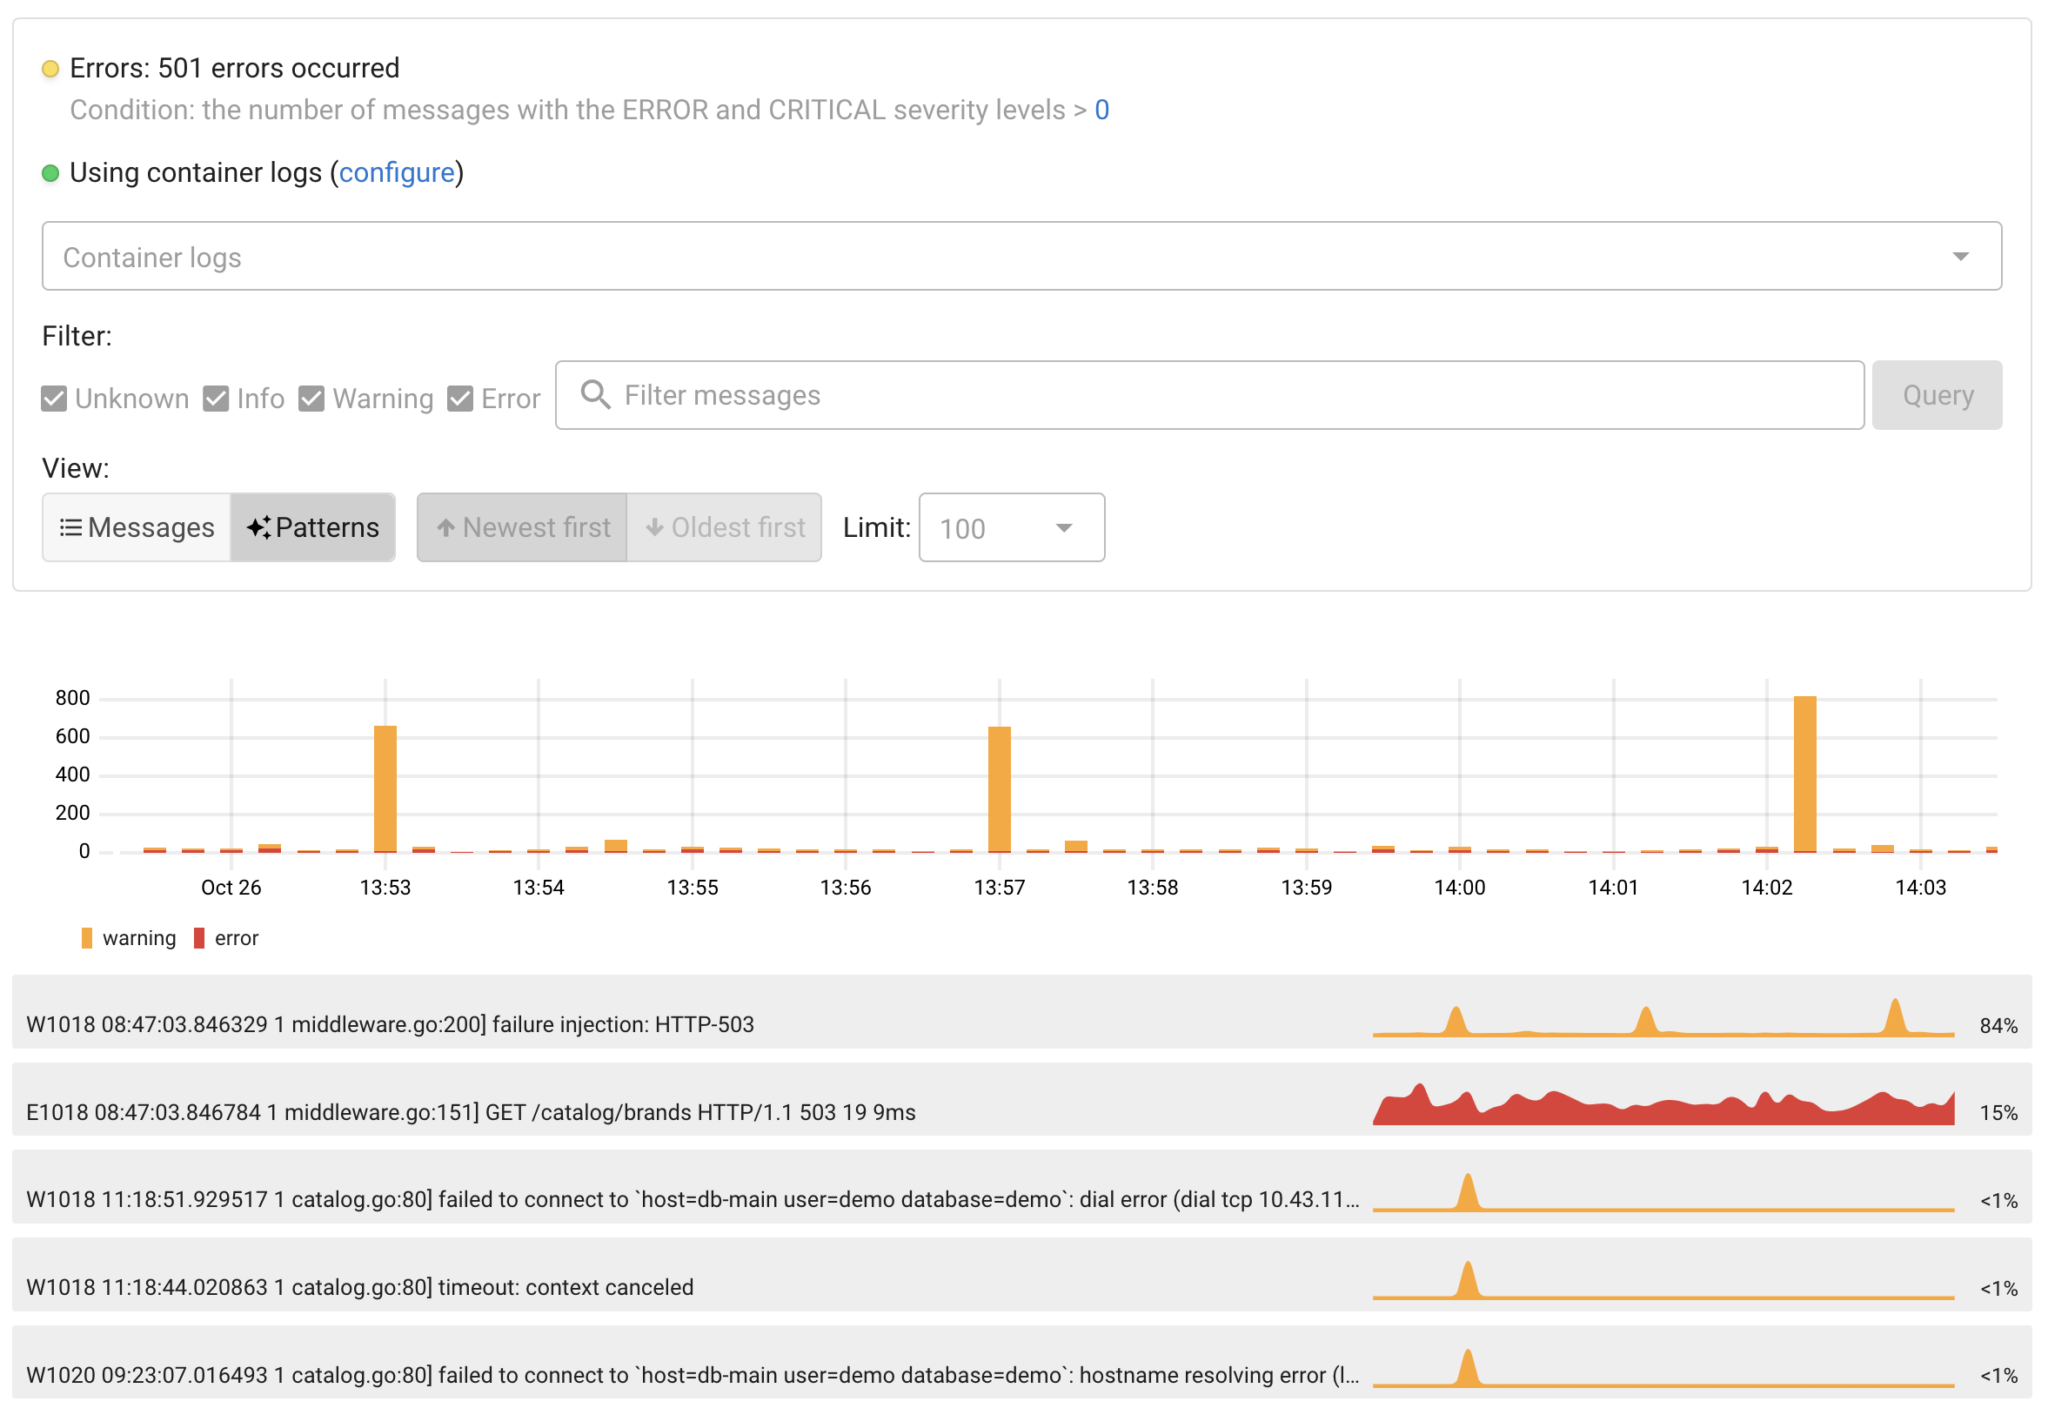
Explore logs and clearly see if there are errors responsible for issues you’re facing. Coroot automatically discovers logs and groups error messages together with zero configuration!
While Coroot is an outstanding tool for firefighting and ongoing issue, it is a much better idea to have state of art observability ready to use before you need it.
So do not delay, install Coroot now. Even if your system does not seem to experience any problems now, you will be surprised how many problems waiting to happen and opportunities for optimizations and cost savings you will find with Coroot!

