In this blog post we will look at filetop command. It is available in BCC tool collection.
Background
Disk IO is one of the key activities happening on the system, especially for data intensive systems running databases or serving files. Disk IO can frequently be a bottleneck, impacting performance of the system, it also can be an important cost driver – higher IO demands may require more expensive storage provisioned in the Cloud, where on prem it can impact storage choices, such as endurance requirements for SSD Drivers. If we want to optimize Disk IO we need to understand it. Some systems have good instrumentation, helping us to understand how much of Disk IO they drive and why, others not so much.
Problem
You need a tool allowing you to understand what processes are causing Disk IO and to what files are affected.
Filetop Usage
Filetop command works similar to top command familiar to most Linux users. Yet instead of showing most active processes it shows most active files. This command instruments logical disk IO, so it does not show how many reads and writes are hitting physical disk versus being cached.
# filetop-bpfcc 10
19:13:28 loadavg: 1.44 3.14 3.79 23/310 926427
TID    COMM             READS  WRITES R_Kb    W_Kb    T FILE
352    systemd-journal  6      0      12285   0       R cmdline
919266 ib_buf_lru-0     0      196    0       12272   R #ib_16384_1.dblwr
919265 ib_pg_flush_co   0      121    0       7408    R #ib_16384_0.dblwr
9468   pmm-agent        383    0      6114    0       R mysql1-slow.log
919310 connection       169    0      2704    0       R sbtest1.ibd
919306 connection       169    0      2704    0       R sbtest1.ibd
919308 connection       164    0      2624    0       R sbtest1.ibd
919309 connection       162    0      2592    0       R sbtest1.ibd
919307 connection       160    0      2560    0       R sbtest1.ibd
919301 connection       159    0      2544    0       R sbtest1.ibd
919390 connection       155    0      2480    0       R stock1.ibd
919313 connection       152    0      2432    0       R sbtest1.ibd
919272 ib_log_writer    0      2906   0       2288    R #ib_redo23351
919302 connection       143    0      2288    0       R sbtest1.ibd
919312 connection       134    0      2144    0       R sbtest1.ibd
919311 connection       134    0      2144    0       R sbtest1.ibd
919366 connection       120    0      1920    0       R stock1.ibd
728    pmm-agent        107    0      1708    0       R mysql1-slow.log
919334 connection       106    0      1696    0       R stock1.ibd
919345 connection       93     0      1488    0       R stock1.ibd
In the output we can see threads responsible for IO and the file which they interact with, sorted by default by total IO bandwidth. We can see same file can be in top multiple times if multiple processes accessing it. We also can see filetop is using the title assigned to a given thread, rather than the name of the process. In this example case we can see which IO is caused by MySQL threads serving user connections, versus various system threads
filetop Command Line Options
# filetop-bpfcc –help
usage: filetop-bpfcc [-h] [-a] [-C] [-r MAXROWS] [-s {all,reads,writes,rbytes,wbytes}] [-p PID] [interval] [count]
File reads and writes by process
positional arguments:
interval output interval, in seconds
count number of outputs
optional arguments:
-h, –help show this help message and exit
-a, –all-files include non-regular file types (sockets, FIFOs, etc)
-C, –noclear don’t clear the screen
-r MAXROWS, –maxrows MAXROWS
maximum rows to print, default 20
-s {all,reads,writes,rbytes,wbytes}, –sort {all,reads,writes,rbytes,wbytes}
sort column, default rbytes
-p PID, –pid PID trace this PID only
examples:
./filetop # file I/O top, 1 second refresh
./filetop -C # don't clear the screen
./filetop -p 181 # PID 181 only
./filetop 5 # 5 second summaries
./filetop 5 10 # 5 second summaries, 10 times only
Related features in Coroot
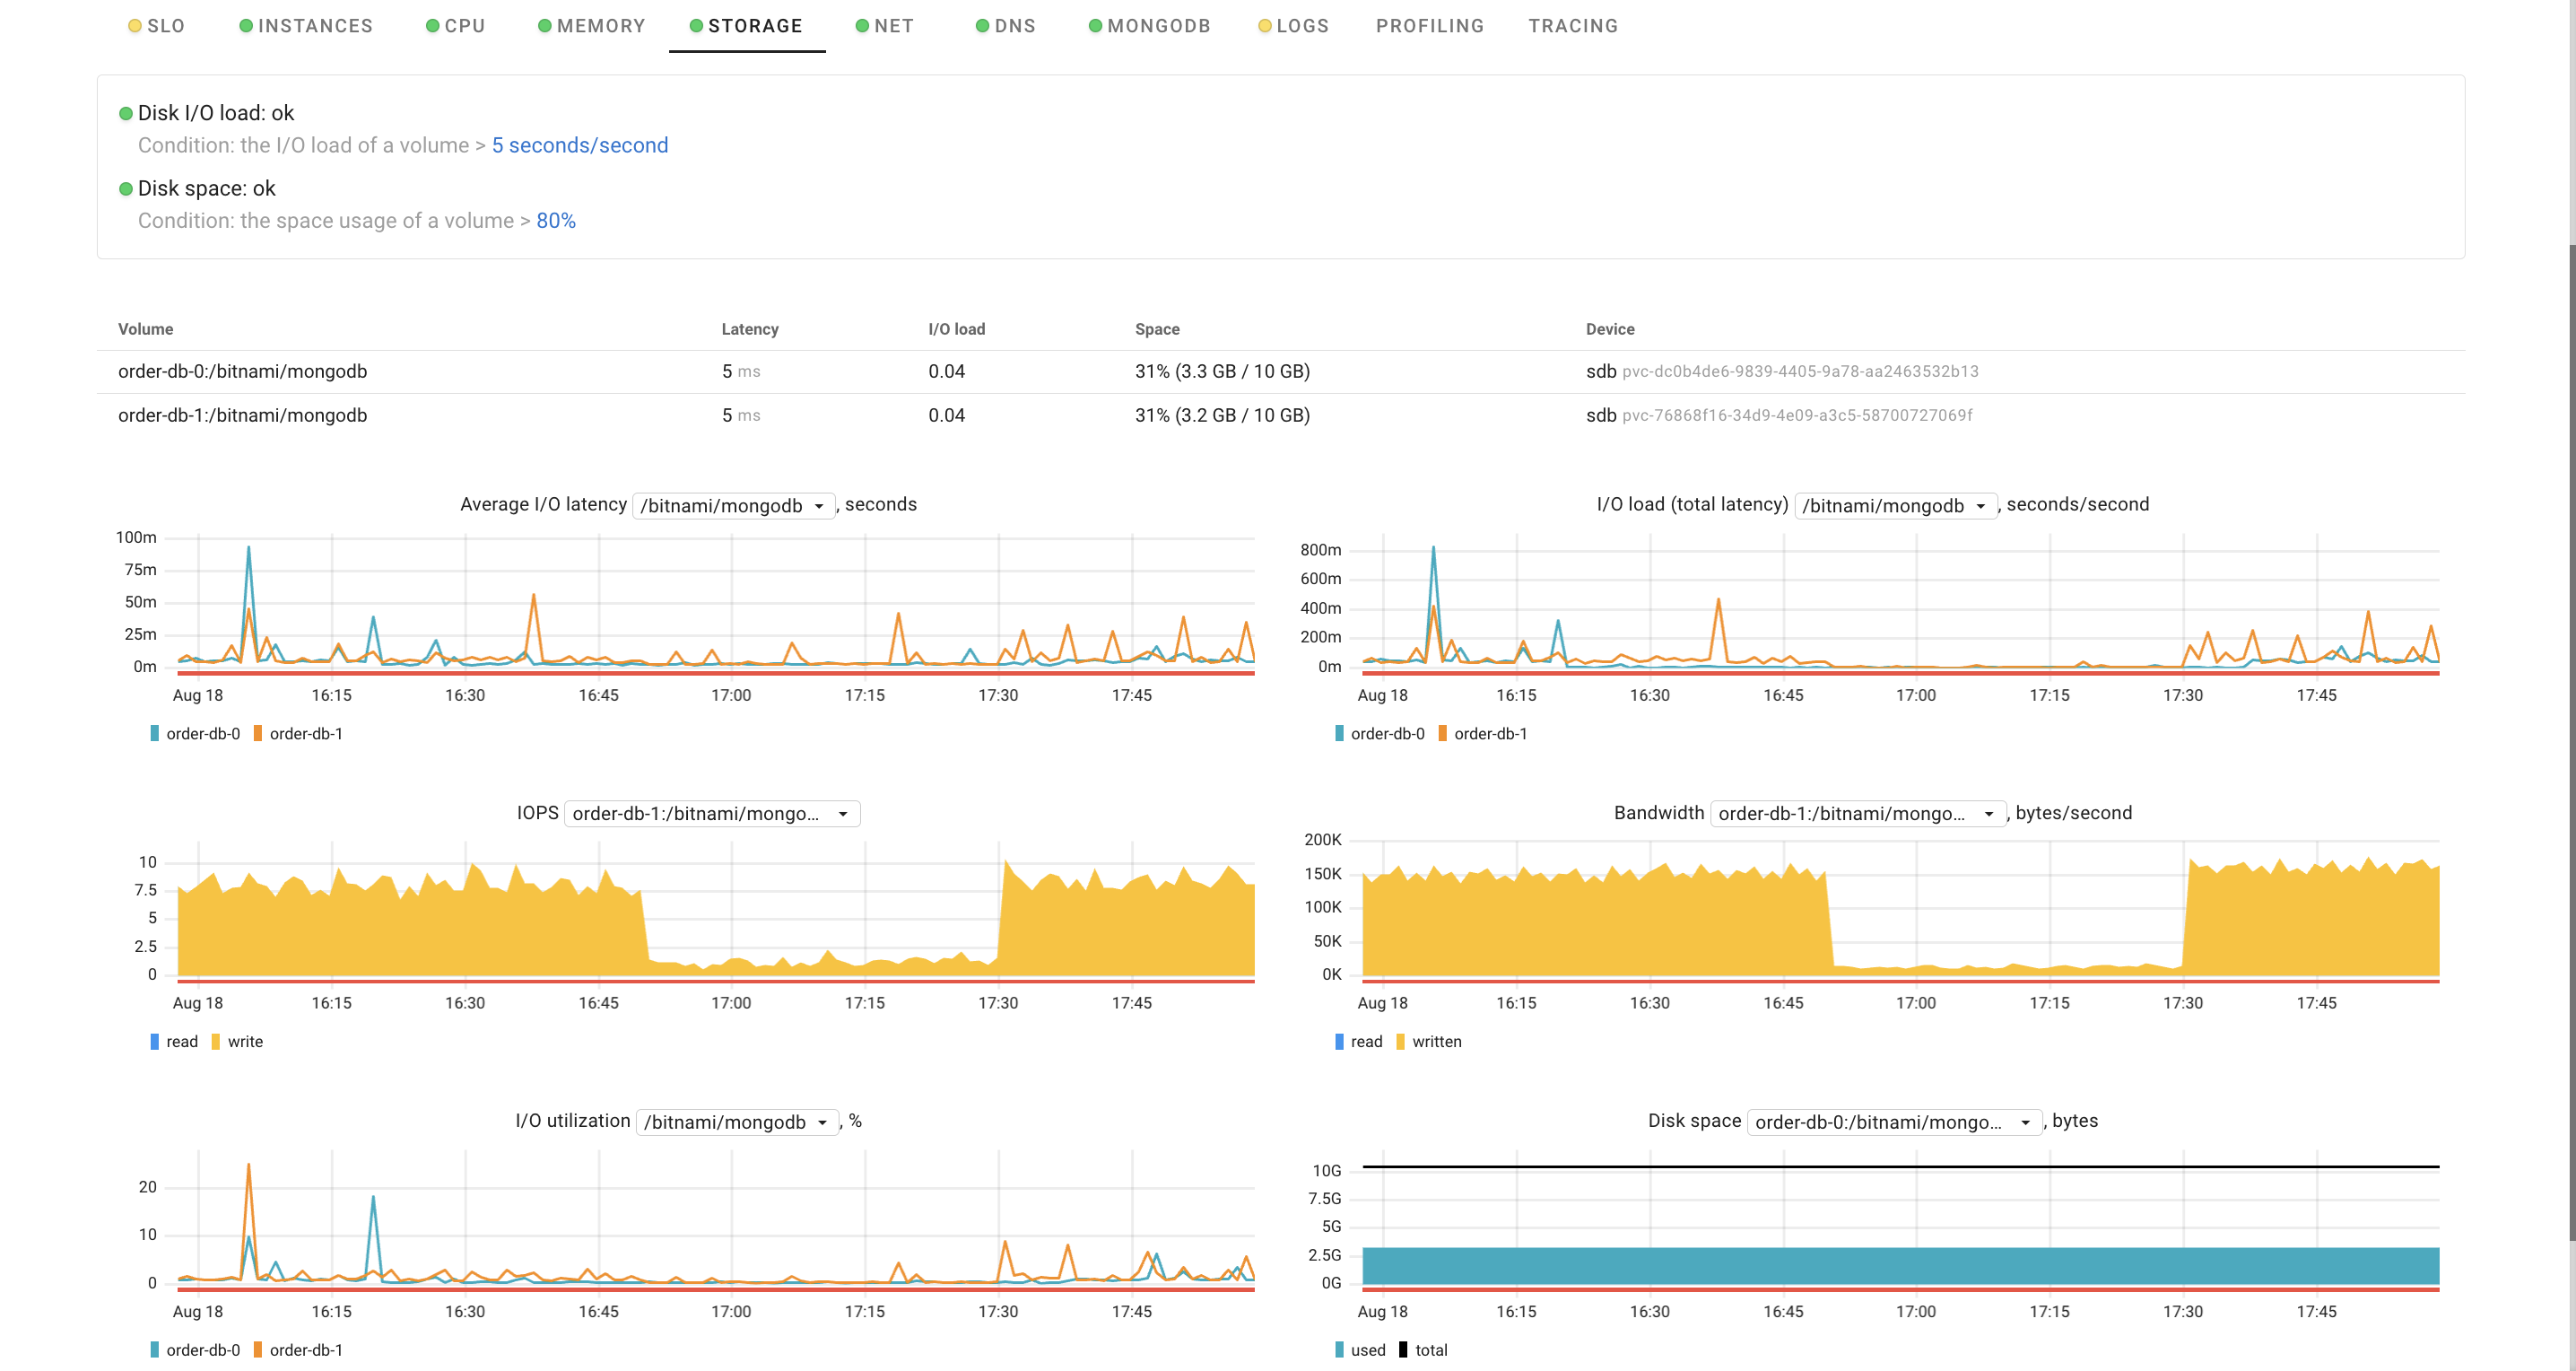
Coroot does not monitor Disk IO on file level, making filetop a great compliment for Coroot features. What Coroot can help you with is to identify which applications are causing disk IO, which application instances are causing IO and on what storage volumes. Once you have discovered the offending node and application instance, you can use filetop to identify specific files getting a lot of disk IO and processes using them
For more eBPF Linux Command Line tools check out this article.