Like most folks, I used to be a skeptic of automated Root Cause Analysis (RCA). From my perspective, there are two primary factors that contribute to the perception of automated analysis of telemetry data as nothing more than a buzzword.
Firstly, it’s a lack of telemetry data. It’s obvious that even the most advanced AI/ML techniques, when applied to crappy metrics or empty logs, could never provide meaningful insights into the issues in a real system.
Moreover, AI lacks an understanding of the physical world and the underlying processes that metrics reflect. Without this understanding it’s not feasible to establish cause-and-effect relationships between events or metrics because “correlation does not imply causation”.
It’s important to note that both limitations don’t originate from the realm of AI/ML methods themselves but rather stem from the quality of the input data, which is why high-fidelity telemetry data is crucial for meaningful analysis.
We wanted to find out if we could solve these problems and build a tool capable of explaining anomalies in application performance. That’s how our work on Coroot began.
The right telemetry data
In a manual troubleshooting process, the typical approach involves investigating a set of hypotheses using metrics, logs, and traces. For example, when trying to determine why a service is responding slower than usual, several potential issues should be considered. These may include resource-related problems, such as CPU starvation and I/O bottlenecks. Additionally, factors like latency and availability of dependent services and databases, as well as network issues, should be taken into account during the investigation.
For instance, let’s attempt to confirm or disprove the hypothesis that the service is responding slower than usual due to a lack of CPU time.
Well, let’s see what CPU-related container metrics cAdvisor (the most popular container metrics exporter for Prometheus) exposes:
- container_cpu_system_seconds_total – cumulative system cpu time consumed
- container_cpu_usage_seconds_total – cumulative cpu time consumed
- container_cpu_user_seconds_total – cumulative user cpu time consumed
- container_cpu_cfs_periods_total – number of elapsed enforcement period intervals (for enforcing CPU limits)
- container_cpu_cfs_throttled_periods_total – number of throttled period intervals
- container_cpu_cfs_throttled_seconds_total – total time duration the container has been throttled
Unfortunately, none of these metrics can help us answer the question. In a scenario where our container has no CPU limit and another application consumes all available CPU time on the node, the mentioned metrics will only show a collateral decrease in the container’s CPU consumption.
Perhaps an anomaly detection algorithm could recognize some anomaly in these metrics. However, it falls short in helping us understand what’s going on because these metrics simply don’t reflect the processes occurring in the system.
Now, let’s find a more telling metric for this scenario.
Only a few people know that the Linux kernel has a built-in capability to track the precise amount of time each process spends waiting for a CPU. If this metric shows a CPU delay of 500ms per second for a given container, it means that the container’s performance is slowed down by 500ms every second due insufficient CPU time.
If we determine that the cause is indeed a lack of CPU time, we can then proceed to investigate the underlying reasons for this behavior. Possible factors to consider include a noisy neighbor, insufficient CPU capacity, or CPU throttling.
On the contrary, if there is no CPU delay, it ensures that this particular container is not facing a shortage of CPU time, even if the CPUs on the node are utilized at 100%.
At Coroot, we dedicate significant effort into developing agents that gather these sorts of meaningful metrics. Thanks to eBPF, we can now gather any desired metrics directly from the Linux kernel without requiring our users to instrument their code.
It should be noted that having such metrics is necessary but not sufficient to build an AI-based root cause analysis engine.
Taking the system topology into account
Let’s imagine that we have collected all the necessary metrics to validate any hypothesis regarding the root cause. What’s next?
Analyzing each metric separately is not a good idea, as there are many cases where a metric describing an individual container may not provide any valuable insights. However, combining metrics that reflect all the involved application containers can be quite revealing. Furthermore, it’s essential to acknowledge that not every issue in the system is necessarily relevant to the anomaly we are attempting to explain. Ignoring this fact can lead to a significant decrease in detection accuracy, resulting in a high number of false positives.
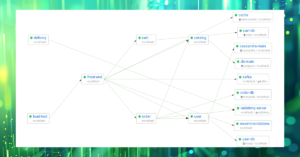
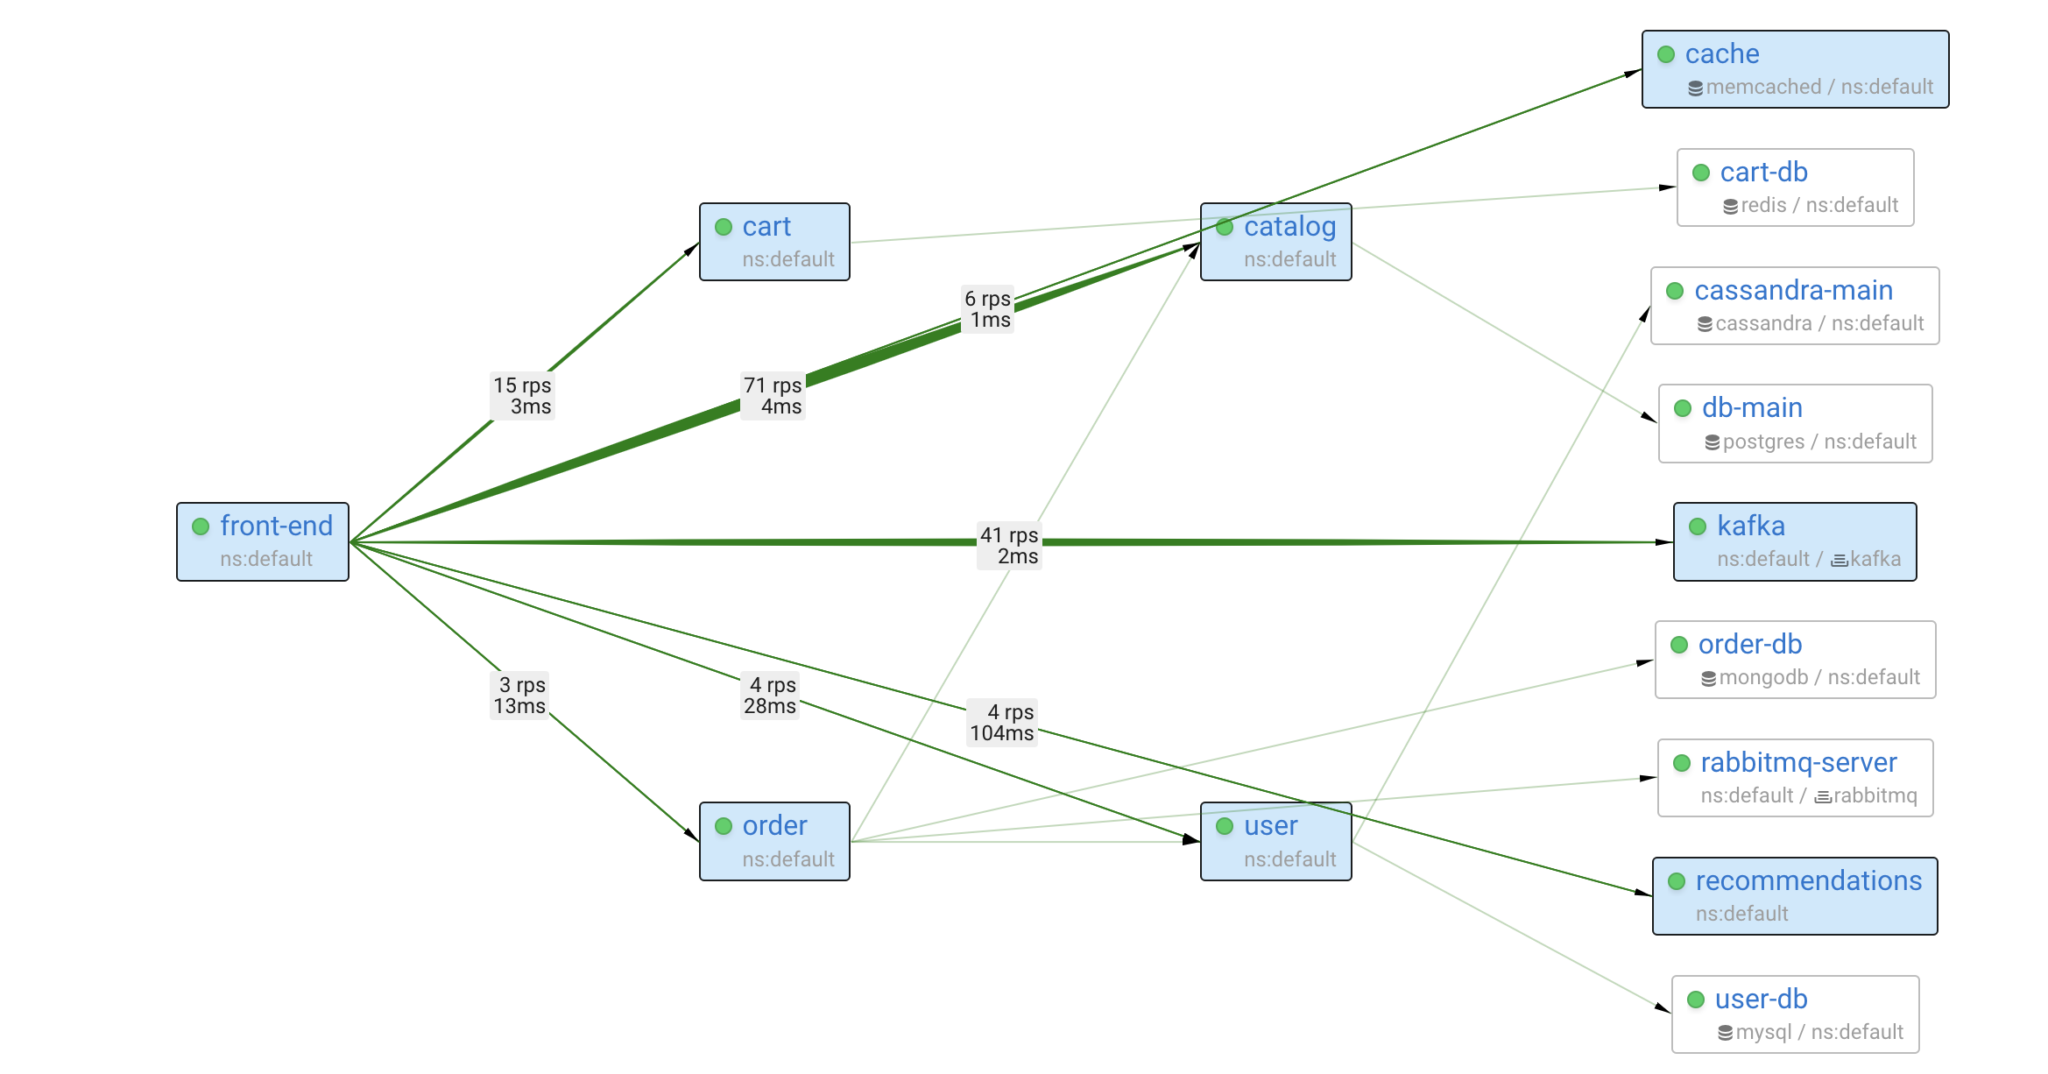
An alternative approach is to construct a model of the system and validate hypotheses by traversing the service dependency graph, starting from the affected service. By doing this, we can pinpoint the issues relevant to the anomaly and explain to the user how they affect each of the services involved.
Since Coroot builds such a model based on metrics gathered at the eBPF level, this model covers 100% of your system with no blind spots. Additionally, the model is augmented with application metadata from Kubernetes, enabling the combination of individual containers into applications, just as users want to perceive them.
The immediate question is about the model’s completeness: which subset of possible problems can it identify? This question is challenging to answer with certainty, so let’s think about it from the very beginning.
Based on the anonymous usage statistics collected from several thousand Coroot installations, the typical number of services is 50, and the average service dependency graph depth is 5. From my perspective, troubleshooting such a system can be quite challenging and time-consuming.
Even if our model only had the latency and success rate metrics of each service, Coroot would still be able to narrow the issue down to the specific problematic service. This alone can significantly reduce the time needed for root cause detection.

Now, imagine the model equipped with all the essential data to identify resource-related issues, instance and node failures, network problems between services, etc.

That sounds better, but the variety of possible failure scenarios is huge and not all of them can be detected using metrics. Well, what do engineers usually do if the metrics don’t provide a clear explanation? Right, they turn to the logs for further investigation!
We followed the same path and enhanced the model with log-based metrics, enabling Coroot to promptly find the relevant errors in the logs.
As you may have noticed, the model has all the essential data to identify even previously unknown types of issues. Yet, when compared to raw telemetry data, this model also incorporates knowledge of how the system is built, and the relationships between its components. Now we can say that the model is ready for automatic root cause analysis.
We want AI to assist us with anomaly analysis rather than anomaly detection
Now, let’s discuss how we can use this model and determine which parts of incident response would gain the most benefits from root cause analysis automation.
The most common application of AI in monitoring is anomaly detection, but I believe it’s ridiculous to ask a tool to find anomalies without defining what an anomaly is. Unsurprisingly, usually nothing of value comes out of it.
From my point of view, we actually don’t need anomaly detection for application performance monitoring. There are indeed effective alerting practices already in place, such as SLOs (Service Level Objectives) and Error budgets. These practices have been proven as highly reliable and straightforward. Therefore, there is no need for any AI involvement here.
Given that any SLO violation can be seen as an anomaly in the service’s latency and/or availability, our primary goal is to explain this anomaly by identifying its underlying causes.
OK, what do we know about each anomaly so far?
- The baseline metrics with an anomaly (Service Level Indicators – SLIs).
- The exact time when the anomaly occurred.
- The topology of the system.
- All the necessary metrics to identify most common types of issues.
- Logs for detecting unknown types of issues.
We believe that it’s possible to automate root cause analysis on top of this data using AI for it, and we also believe we have accomplished it!
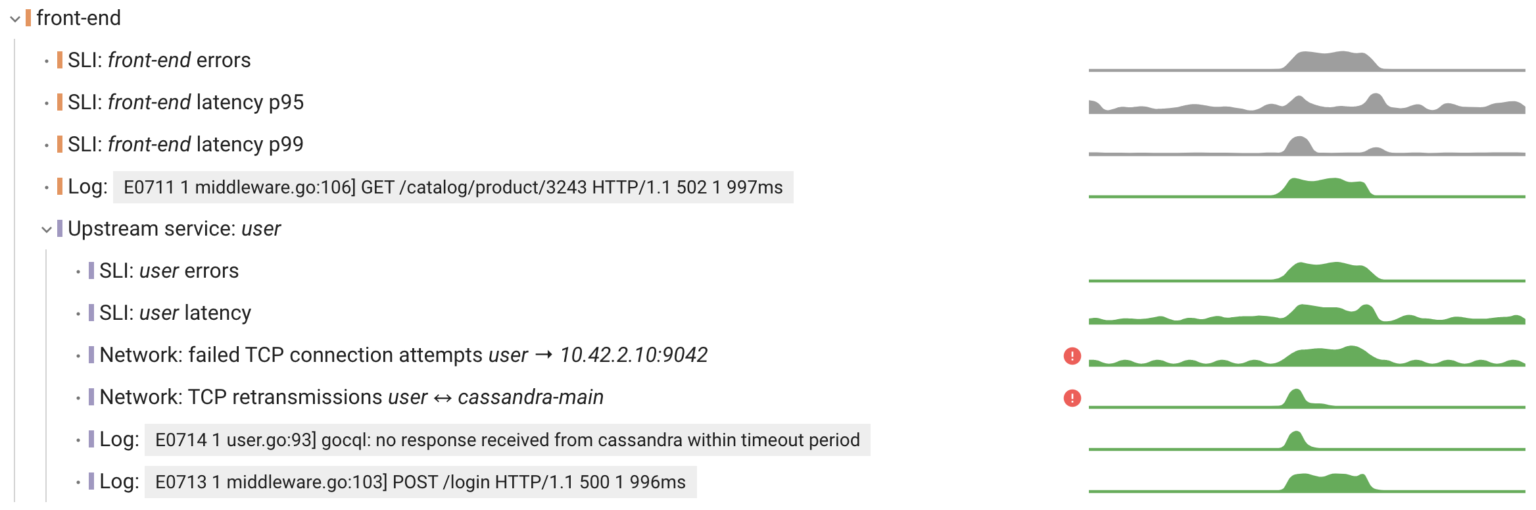
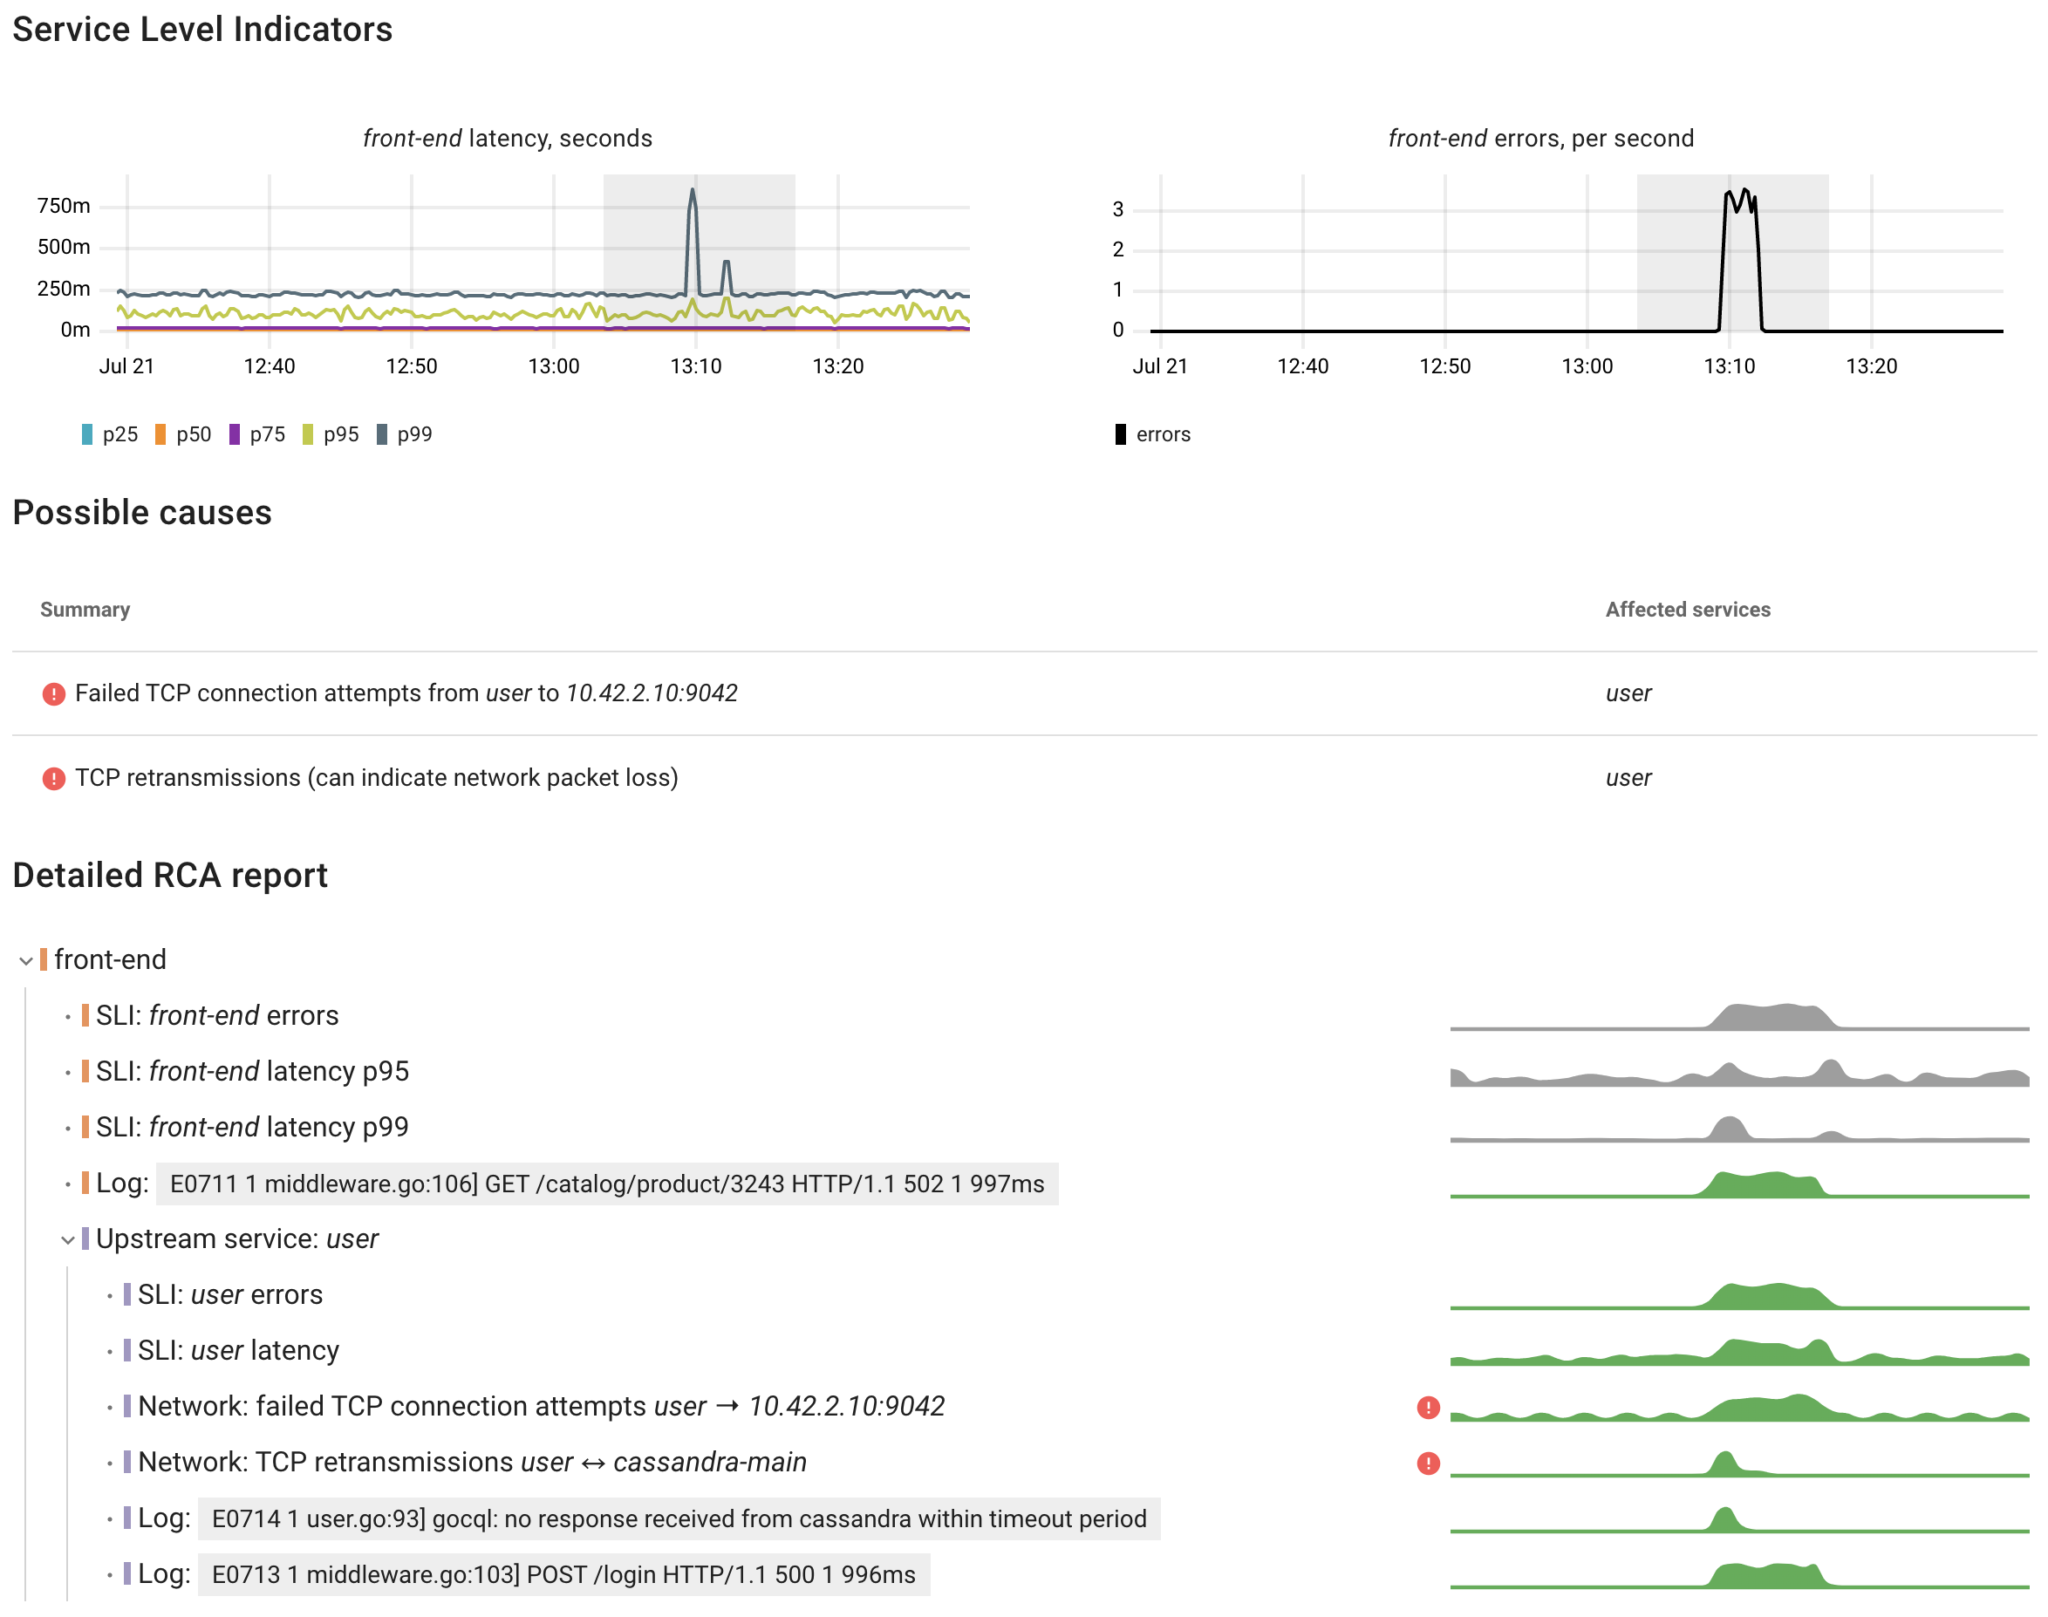
From the UI/UX perspective it looks as follows:
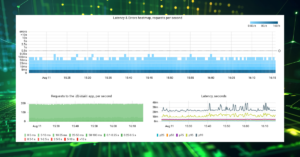
- A user selects an area with an anomaly on the charts displaying Service Level Indicators (SLIs) of any service
- Coroot traverses the model starting from this service to find the potential causes of the given anomaly
- It provides a summary and a detailed report structured in the same way we visualize distributed traces
This feature is currently not open source, but you can access the beta version through Coroot Cloud (14-day free trial is available).
What’s next?
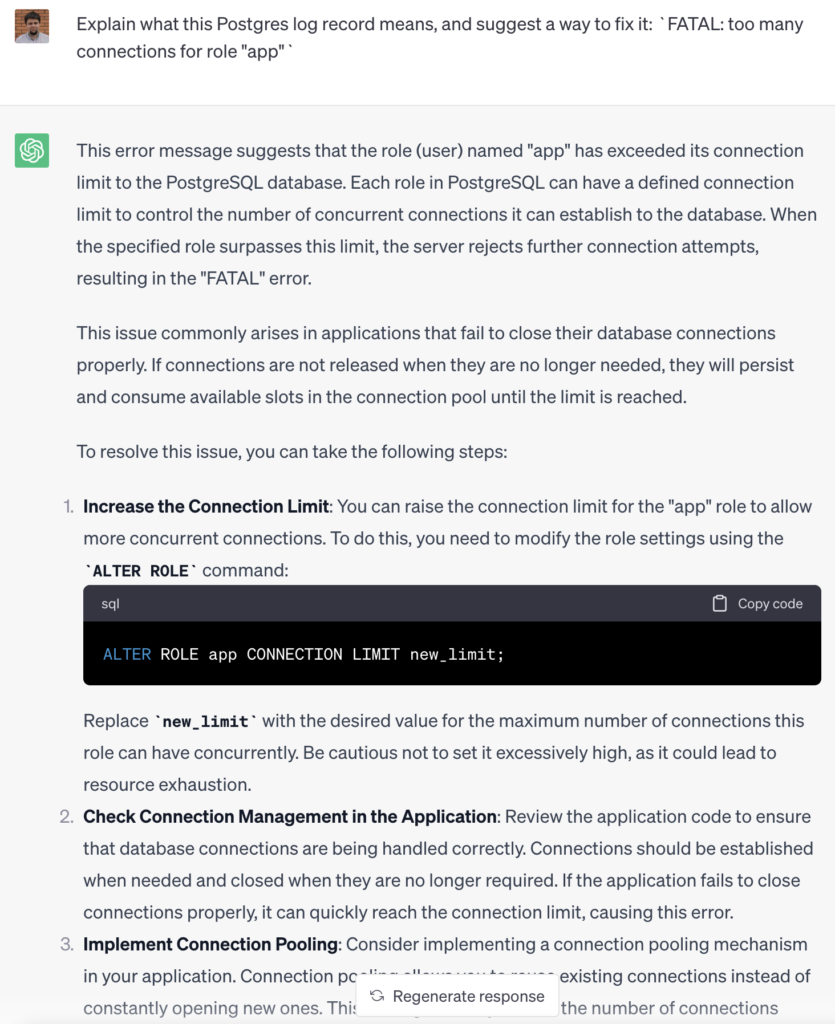
While working on Coroot, we discovered that the more our model knows about a system, the more we can enhance our users’ troubleshooting experience. Context is everything!
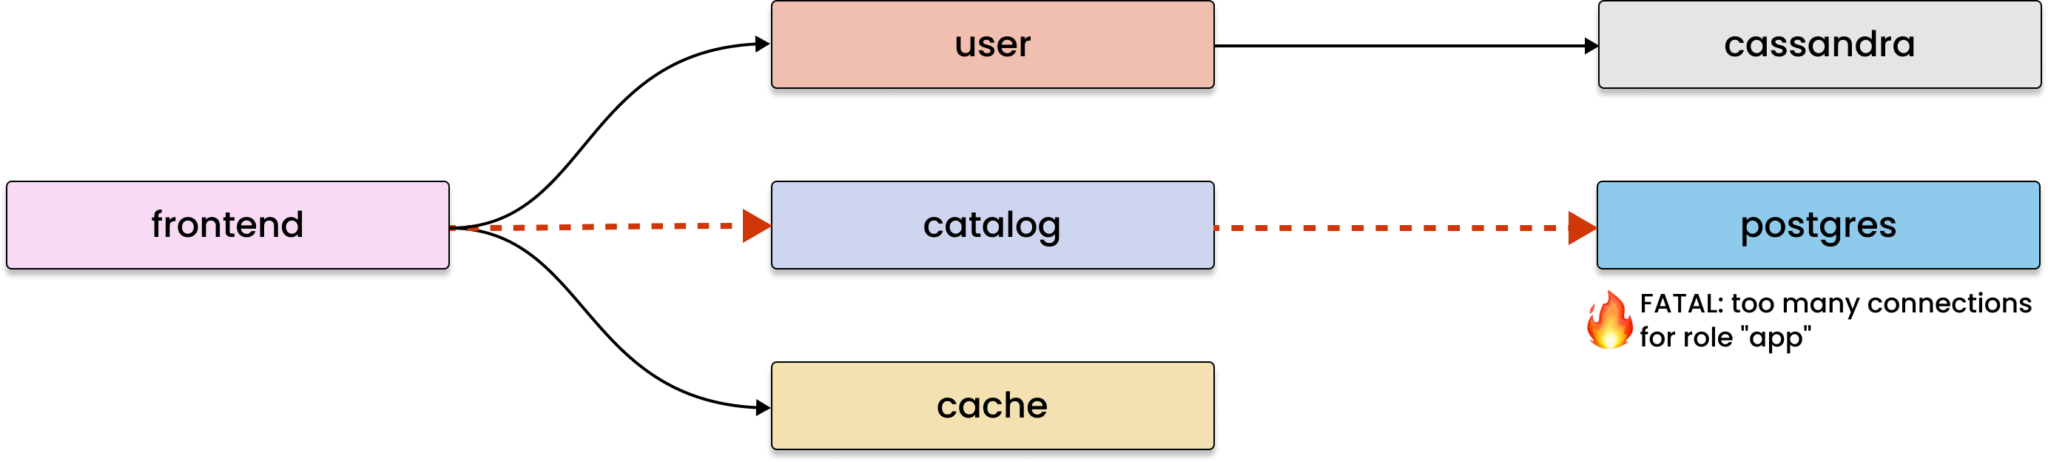
For instance, by identifying the relevant error from the logs and knowing the application type, we can leverage a Large Language Model (LLM) to provide our users with precise suggestions on how to resolve the issue:
Conclusion
At Coroot, we truly believe that AI can take troubleshooting of distributed systems to the next level. Our journey has been long, but we’ve made great strides in learning how to build better models of distributed systems, and improving our agents to gather the right metrics.
Now, we’re excited to announce a major milestone: with Coroot’s AI automated root cause analysis solution, engineers can troubleshoot even the most complex systems more efficiently than ever before!
Try Coroot Enterprise now (14-day free trial is available) or follow the instructions on our Getting started page to install Coroot Community Edition.
If you like Coroot, give us a ⭐ on GitHub️ or share your experience on G2.
Any questions or feedback? Reach out to us on Slack.