How to Reduce Your Cloud Costs with Coroot
 Alexander Lamberton
Cloud costs often grow quietly until they suddenly command everyone’s attention. Gartner estimates that companies overspend on cloud services by up to 70 percent, mostly because they lack clear visibility into where the money is actually being spent. Cloud invoices speak the language of infrastructure: nodes, instance types, regions, volumes, and egress. Engineering teams speak the language of services, deployments, and code. Bridging these two worlds is where most cost optimization efforts fall apart.
Coroot is an open-source observability platform that understands both your system’s topology and your cloud provider’s pricing. Instead of guessing which service is responsible for a bill increase, you can finally see a simple story about what each application costs and why. It takes raw infrastructure costs and translates them into clear per-application insights that every developer can understand.
How Coroot turns node-level cloud costs into per-application costs
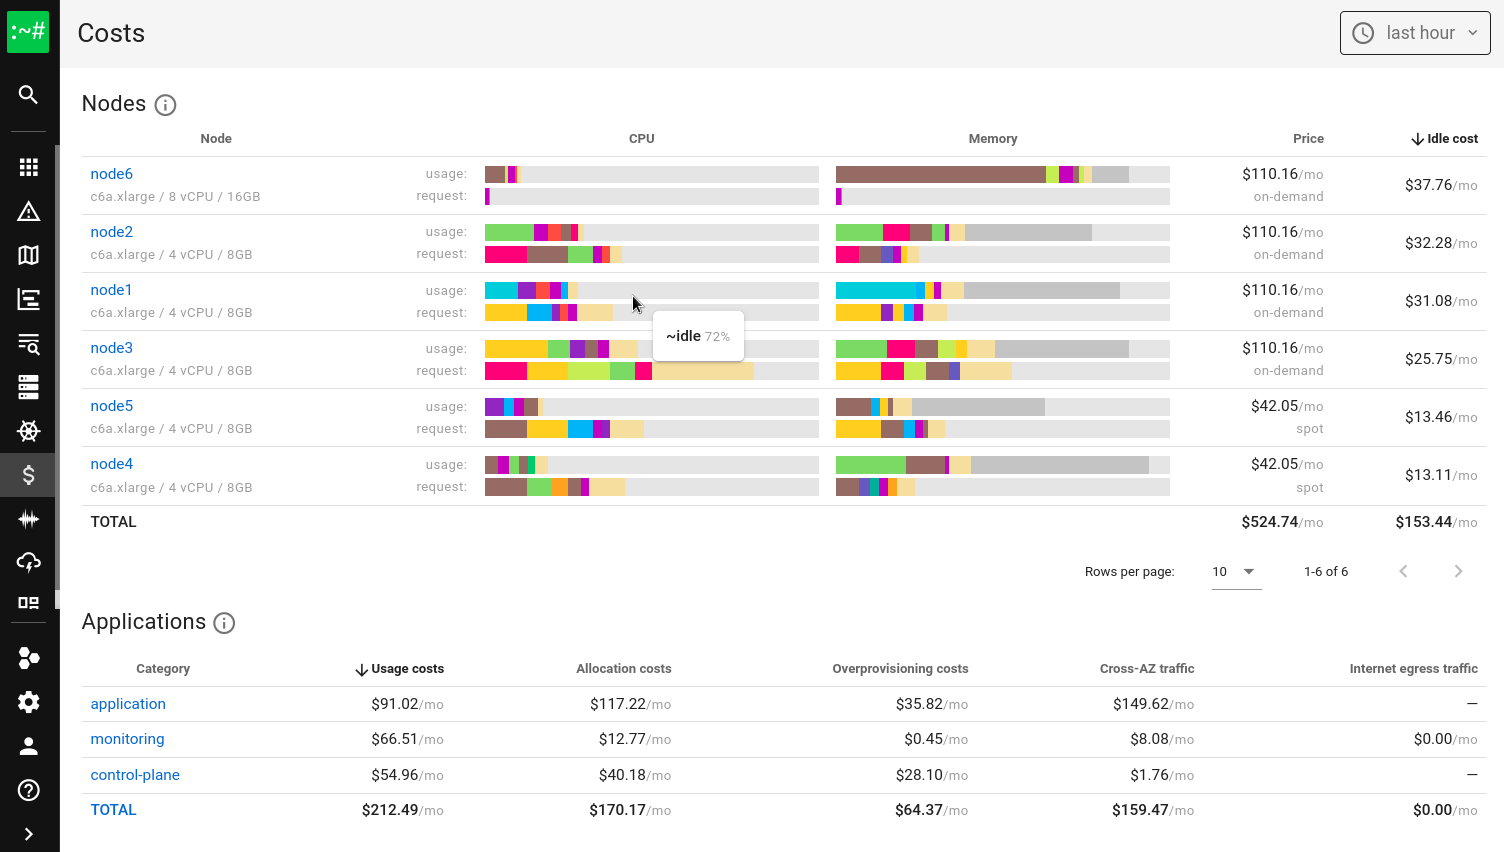
Everything starts on the machine where Coroot’s agent is running. The agent automatically discovers the full cloud context: the provider, instance type, region, availability zone, and whether you’re paying on-demand or using spot capacity. With this information, Coroot knows the exact cost of operating that node.
Coroot then breaks that cost into useful pieces. It calculates how much one CPU core and one gigabyte of memory cost on that instance, and since it continuously measures each application’s real resource usage, Coroot can convert consumption into dollar values. Resource usage stops being just numbers and becomes actual cost.
The agent also observes how applications communicate. It knows where each instance runs and how much data flows between them. If one service keeps talking to a database in another availability zone, Coroot sees the cross-AZ traffic and turns it into cost. The same goes for internet egress. If an app sends data out of the cloud, Coroot tracks the volume and the price you pay for it.
The result is a clear, intuitive breakdown of your cloud expenses by application. What used to be an opaque node-level invoice becomes a straightforward view of which applications cost the most and why.
Finding idle and underutilized resources
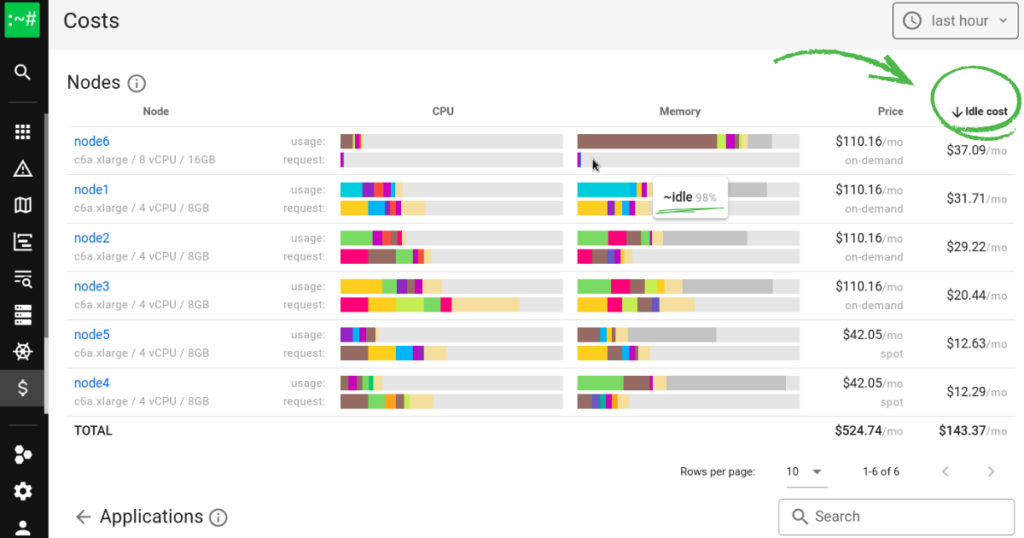
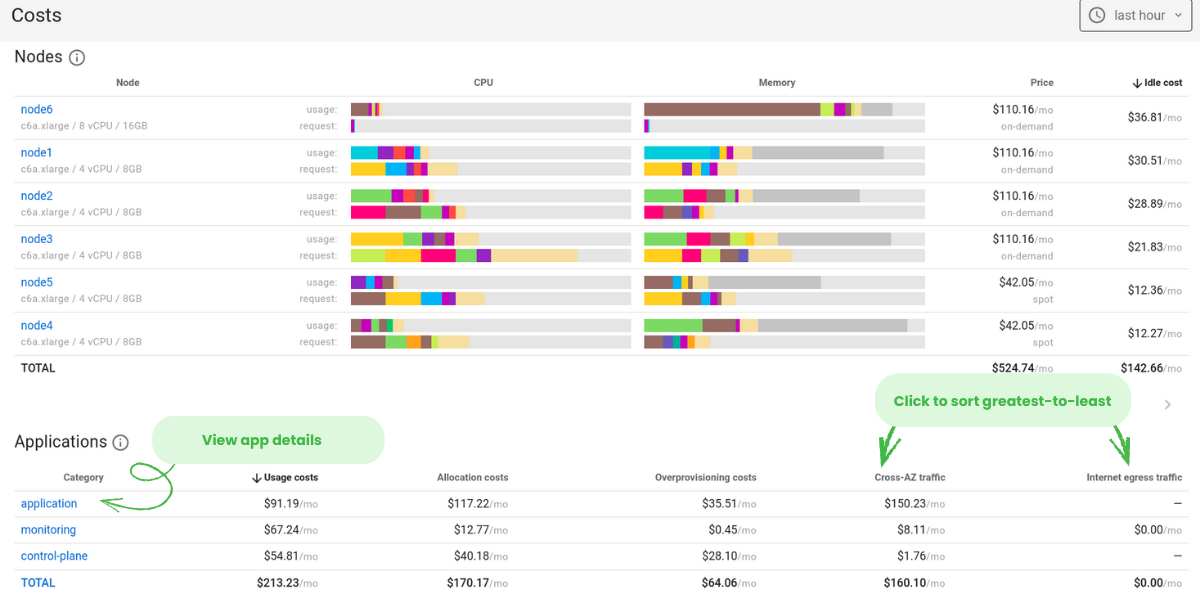
A lot of cloud waste comes from machines that are barely doing anything. To spot them with Coroot open the Nodes view and sort by Idle costs. The most wasteful nodes immediately rise to the top.
Look for nodes with high idle percentages. Anything above fifty percent is worth attention, and if you see something like ninety-eight percent idle memory, that node is basically a parked car with the engine running.
Once you identify underutilized nodes, you have a few simple options:
- Consolidate workloads onto fewer nodes
- Rightsize by choosing smaller instance types
- Use spot instances for resilient or non-critical jobs
Before acting, ensure the node can be drained safely with kubectl drain. If your cluster is highly dynamic, let a cluster autoscaler handle some of this automatically.
Cleaning up idle nodes is one of the fastest, easiest wins in cloud optimization.
Detecting over-provisioned applications
Developers often request more CPU or memory than they truly need “just in case.” Across dozens of services, this padding adds up quickly.
In Coroot’s Applications view, check the Overprovisioning costs column. This number shows exactly how much you’re paying for resources that applications reserve but never use.
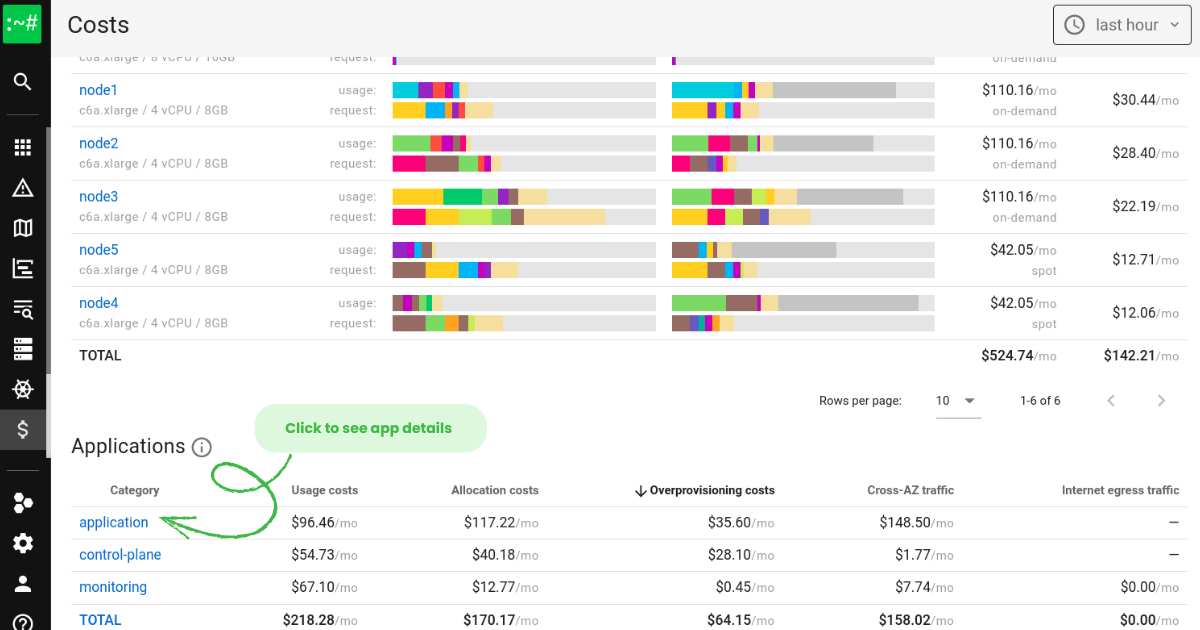
Coroot automatically groups control-plane and monitoring components so they don’t clutter the list, and you can customize groupings if needed.
Over-provisioning is one of the sneakiest sources of cloud waste. Seeing it laid out clearly makes it much easier to trim resource requests without guesswork.
Analyzing application resource usage
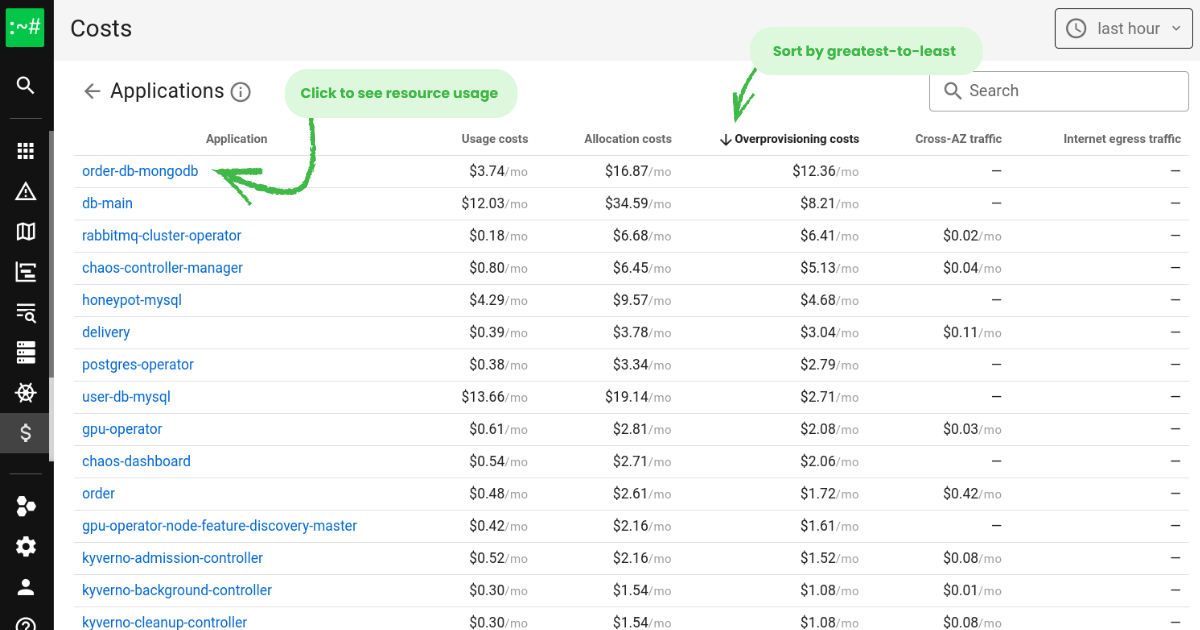
Once you spot an over-provisioned app, click the arrow in the Overprovisioning costs column to drill down. For example, you might find a service like order-db-mongodb wasting twelve dollars a month simply by reserving resources it never touches. Multiply that across your cluster, and the numbers grow quickly.
Click on any application to open its detailed view. Coroot shows real-time CPU and memory usage for each instance, along with recommended resource requests highlighted in green. You might see CPU suggestions dropping from 500 millicores to 70, or memory decreasing from 537 megabytes to 400.
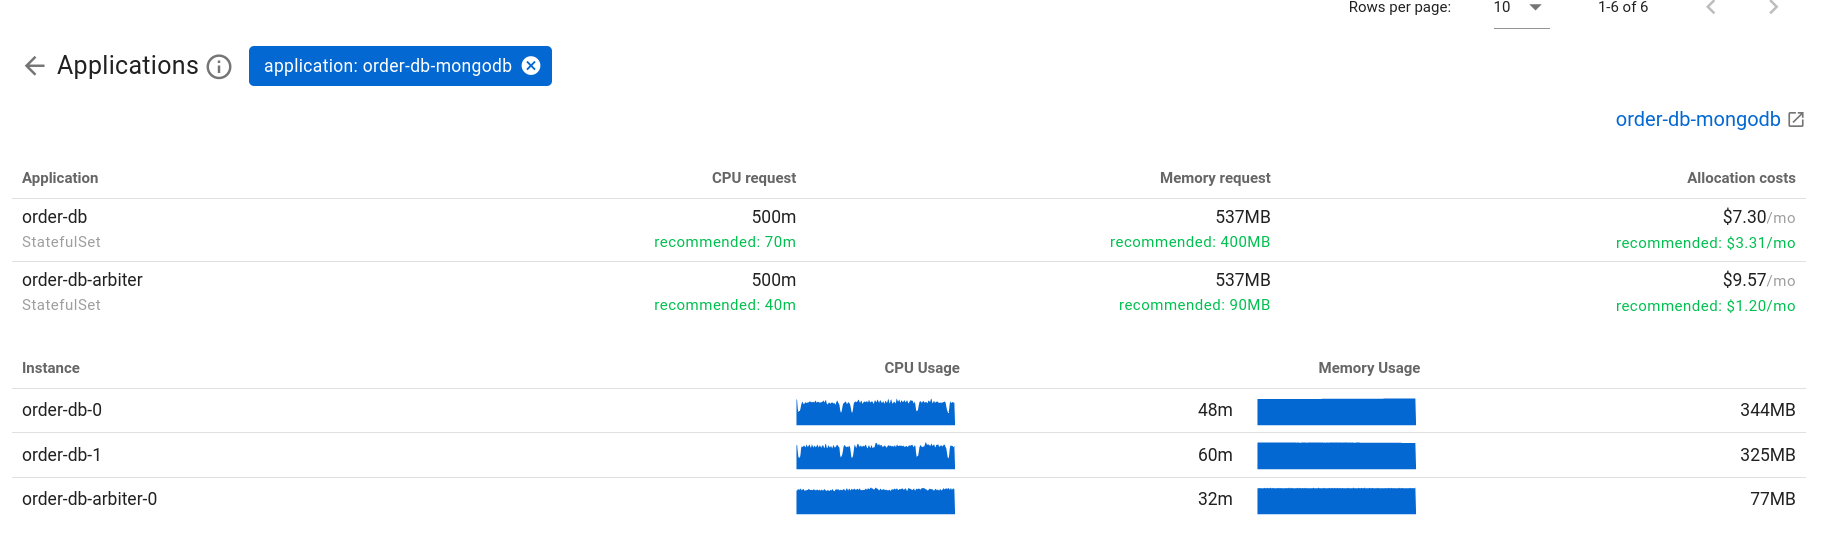
These recommendations give you a clear, data-backed path to reduce requests in your deployment manifests and reclaim meaningful savings.
Identifying expensive cross-AZ and egress traffic
Network transfer costs are easy to overlook until the bill arrives. Cross-AZ traffic, large API responses, chatty microservices, and unnecessary replication can easily become thirty percent or more of your total cloud spend.
Coroot exposes these hidden costs. In the Cost view, sort by Egress costs or AZ traffic to see which applications are responsible for the most expensive flows. Click any category to see the exact services driving those costs.
With this visibility, patterns become clear. You’ll quickly spot services talking across zones, databases replicating too aggressively, or applications sending large volumes of data to external clients.
Here are a few simple ways to reduce network costs:
- Colocate services that frequently communicate
- Add caching layers like Redis or Memcached
- Enable compression for APIs, gRPC, and databases
- Tune cross-AZ replication settings
- Review third-party tools that might be over-polling your APIs
Once you know where the traffic comes from, optimizing it becomes much easier.
Tracking deployments and their cost impact
Deployments are a common source of unexpected cost spikes. A new version might double CPU usage or drastically increase network traffic without anyone noticing.
Coroot automatically tracks every deployment and compares its resource usage against the previous version. If something suddenly consumes more CPU, memory, or bandwidth, Coroot makes it immediately visible and notifies you through Slack, Teams, PagerDuty, or whatever your team uses.
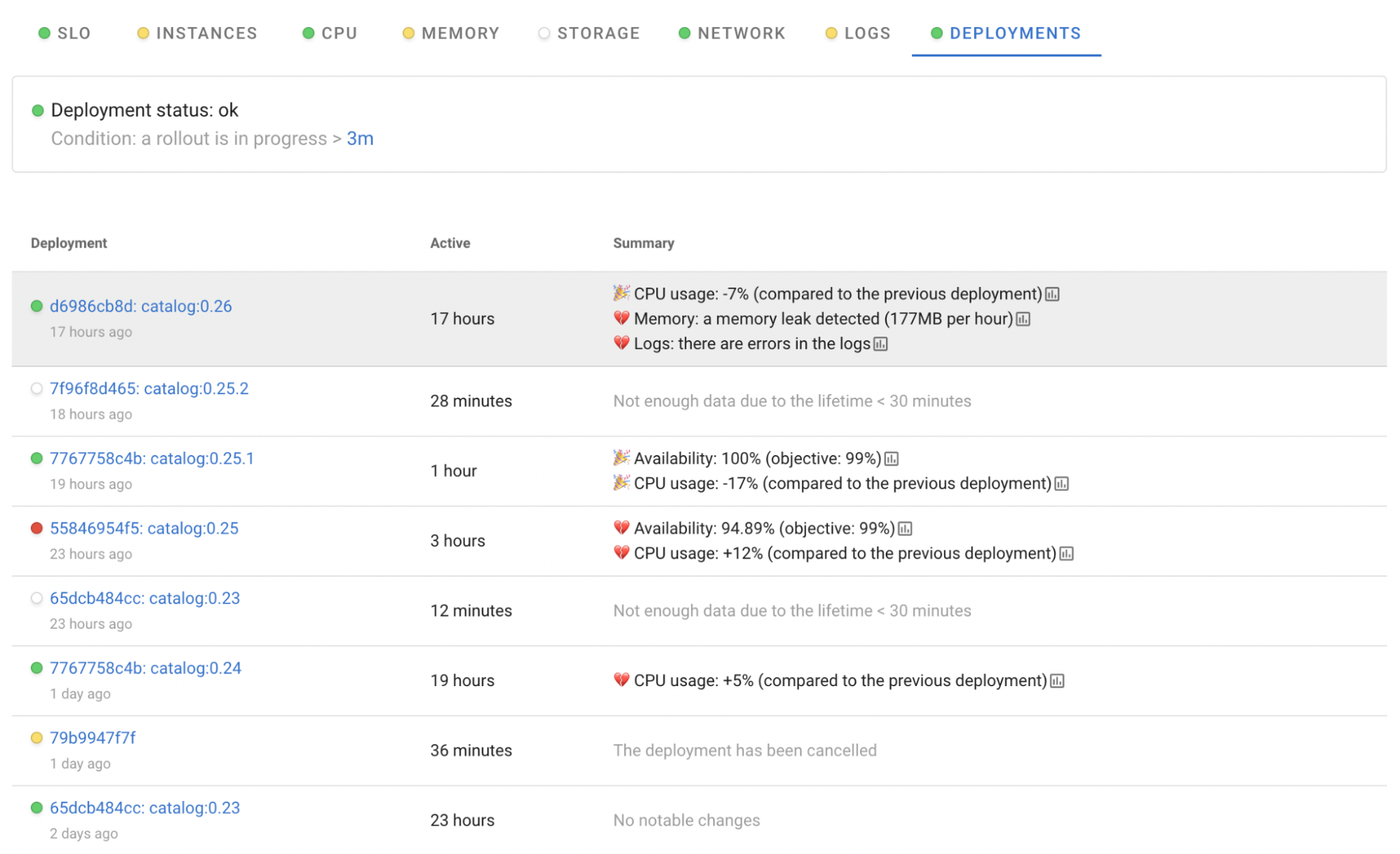
To inspect recent changes, open the service map, click a service, and head to Deployments, or open Rollouts from the Kubernetes sidebar. Look for unusual spikes introduced by a specific version and decide whether a rollback or configuration adjustment is needed.
This makes deployments safer and helps you catch cost regressions early.
Creating an ongoing cost optimization strategy
Cost optimization works best when it becomes a steady habit instead of a frantic cleanup when the bill spikes. Here are a few examples of weekly and monthly review schedule we recommend, alongside a few tips for automation:
Weekly reviews
- Check the top idle nodes
- Review cost trends by application category
- Identify applications producing heavy cross-AZ or egress traffic
Monthly checks
- Detect newly over-provisioned applications
- Apply Coroot’s CPU and memory recommendations
Automation opportunities
- Use HPA or VPA powered by Coroot metrics
- Move fault-tolerant workloads to spot instances
- Scale down non-production environments at night
With a few regular checks and a bit of automation, cloud waste becomes far easier to manage.
Conclusion
Cloud cost optimization starts with visibility, and visibility starts with observability. Coroot gives you a clear window into how your applications consume compute, memory, and network resources and how that translates into real cloud spend.
Spot idle nodes, trim over-provisioned workloads, uncover expensive traffic paths, and understand how deployments affect your budget. Once you have this level of insight, building a sustainable cost optimization strategy becomes simple.
A few minutes each week can prevent unexpected bills and keep your cloud spend comfortably under control. With the right observability, cost optimization stops being a guessing game and becomes something you can confidently manage.