Implementing RED Method with Distributed Tracing
 Peter Zaitsev
The RED (Rate, Errors, Duration) method is a popular approach to instrument and troubleshoot microservices applications. In Coroot – Open Source observability platform – we have designed an effective interface allowing to use RED method with Distributed Tracing and OpenTelemetry (OTEL) generated data.
Let’s start from the system’s overview
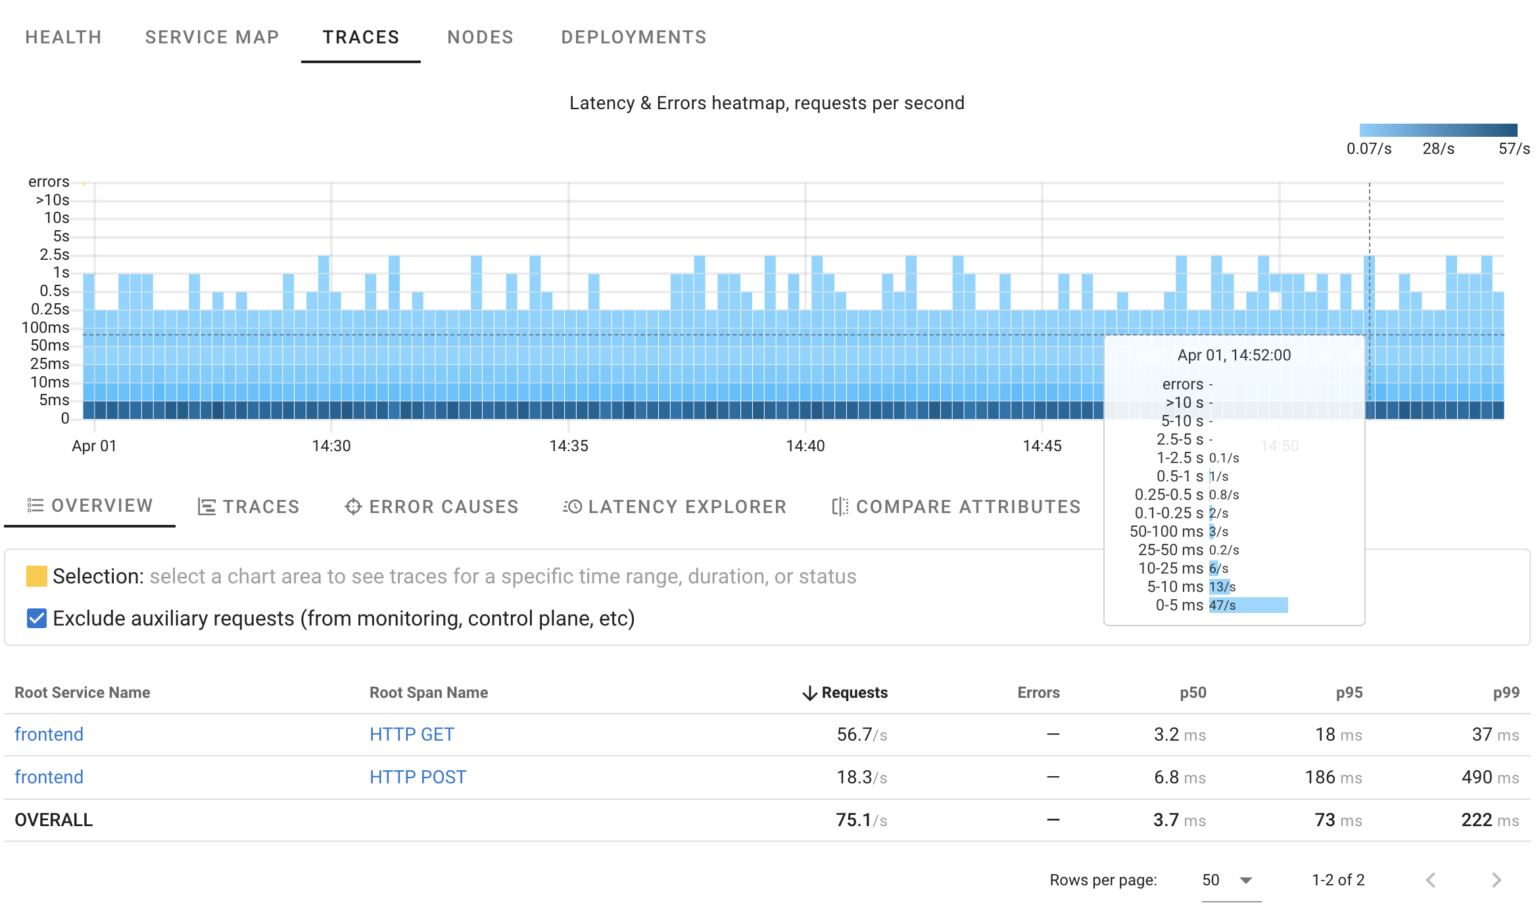
This summary gives us everything you need to apply RED method to the application – we can see the system is handling roughly 70 requests per second with p99 latency below 250ms and no errors.
Errors
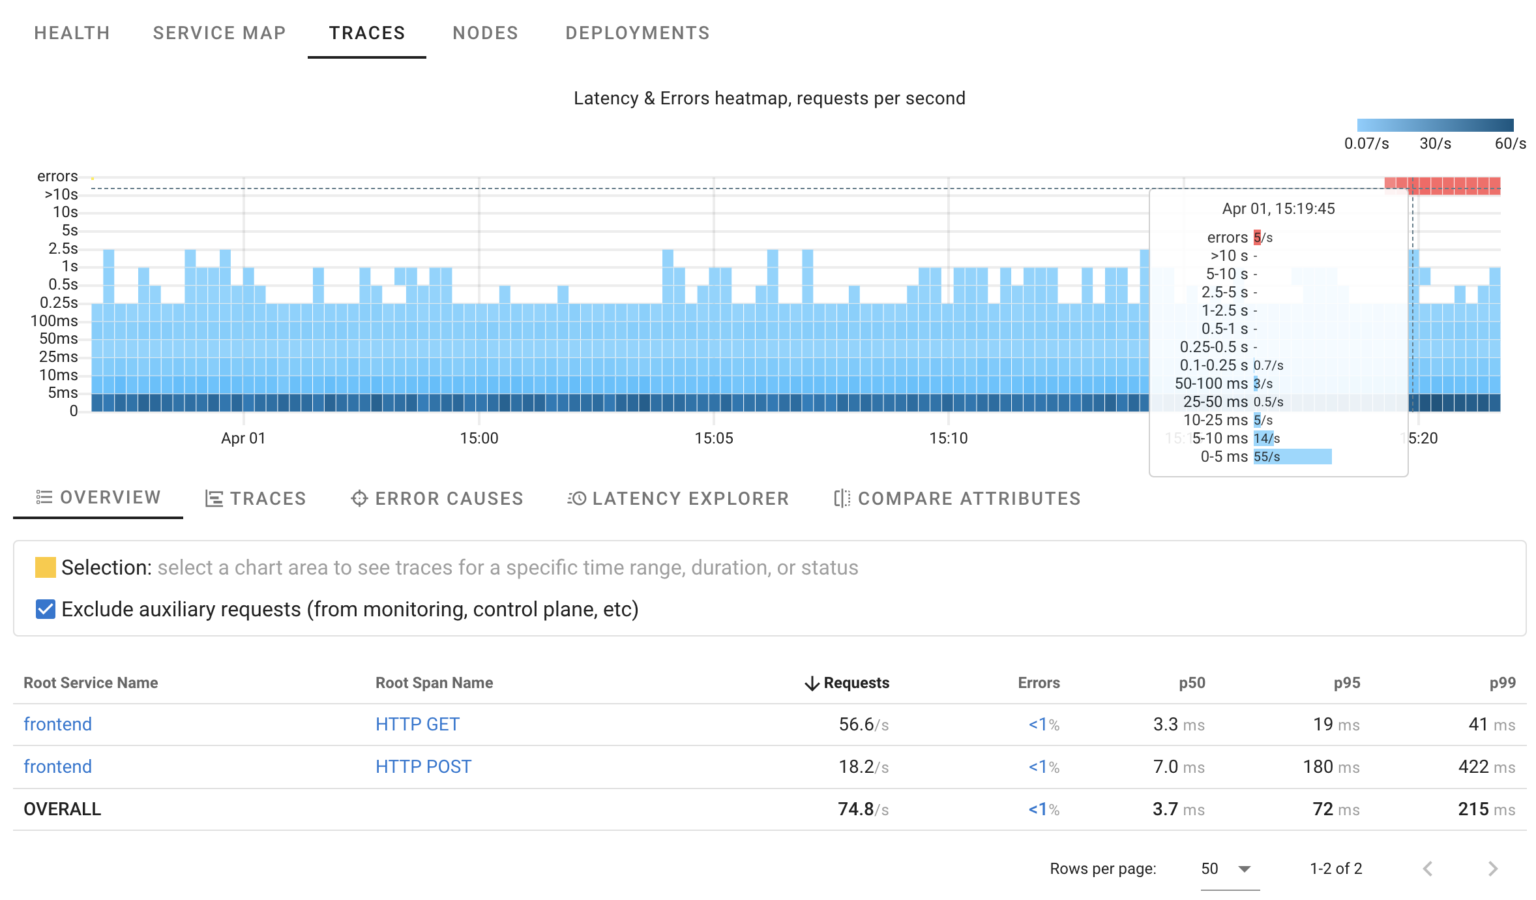
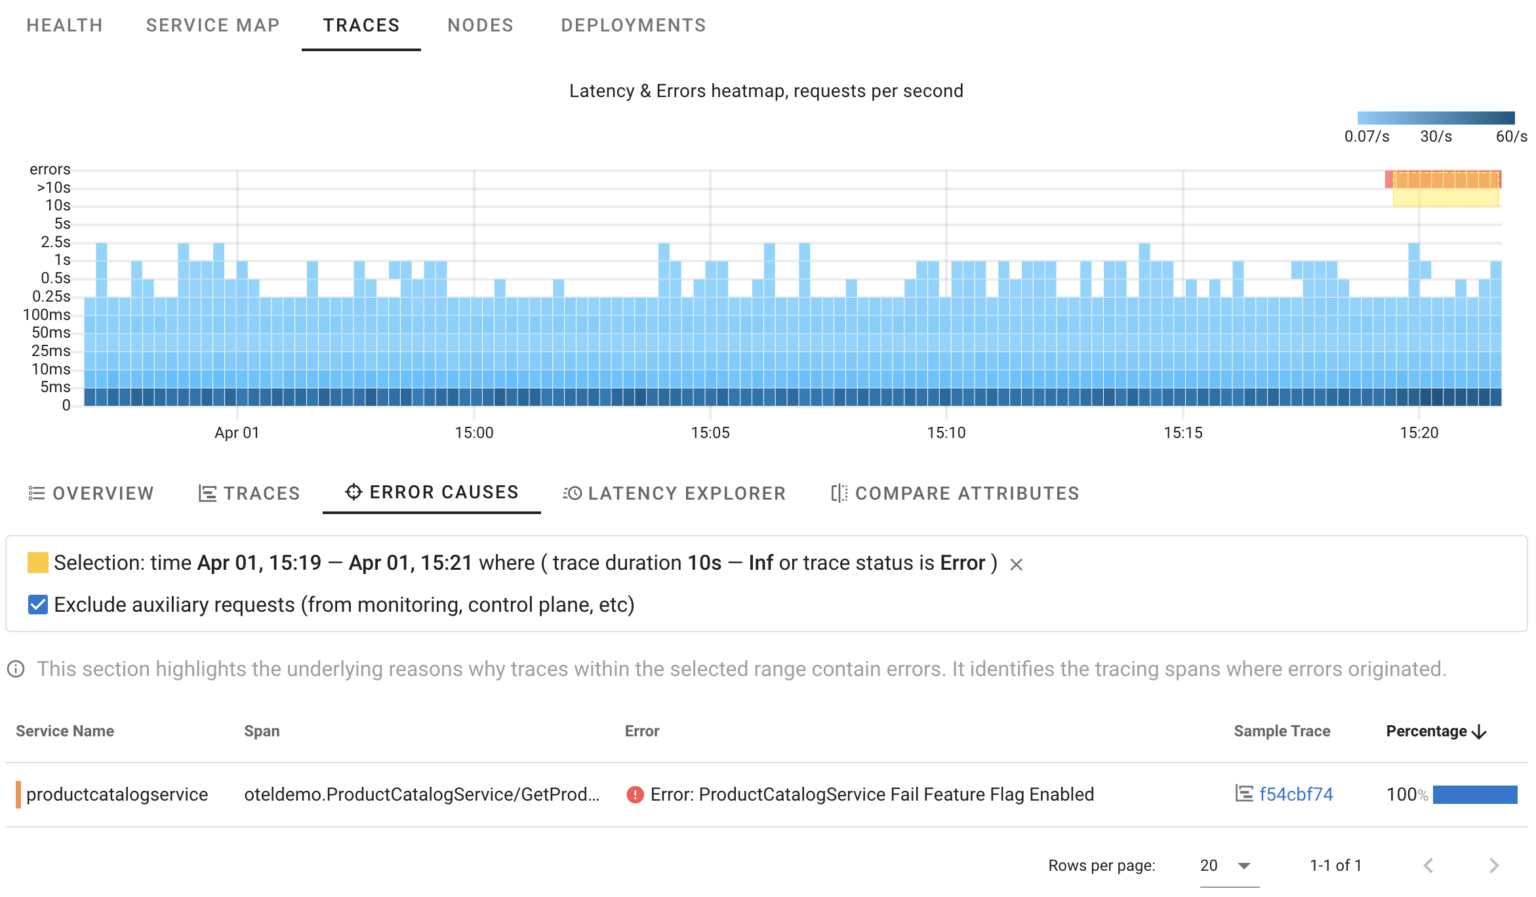
What if there are errors? You can clearly see errors in the overview interface – about 5 errors/sec in this case. What is causing them? Select the relevant range on the graph to find the causes – Coroot automatically analyzes all affected requests and pinpoints spans where errors are originated.
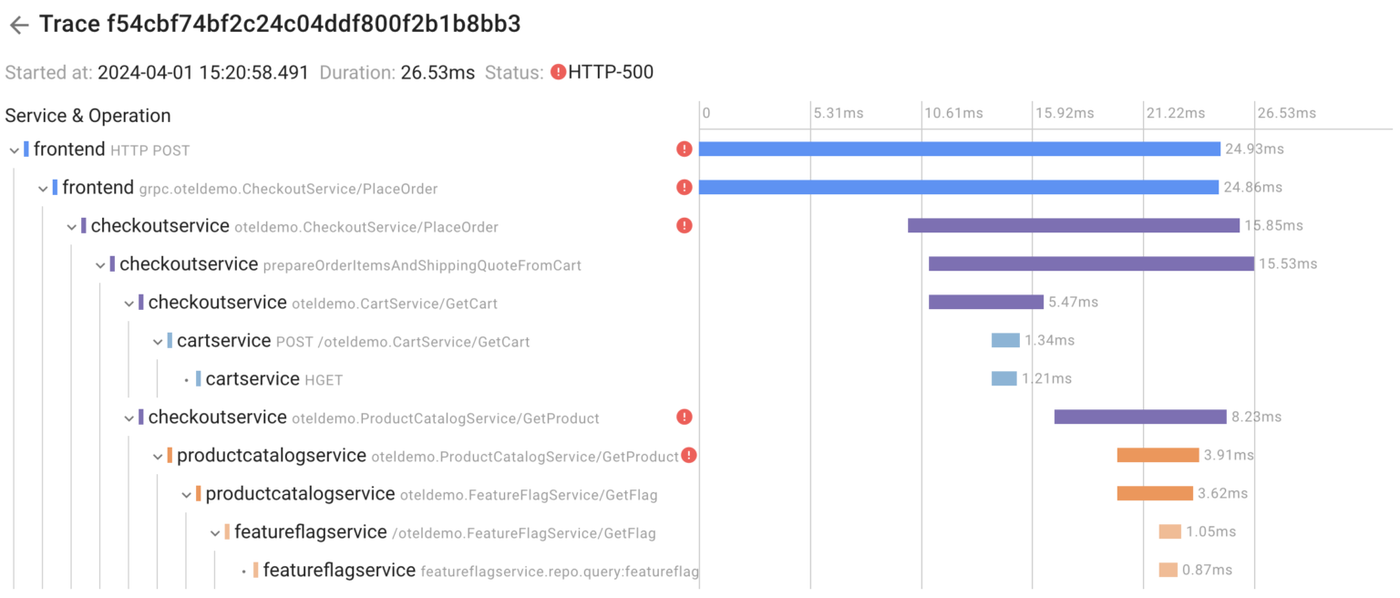
Want to double check if this is indeed the case? You can click on the “Sample Trace”:
Compare and Contrast
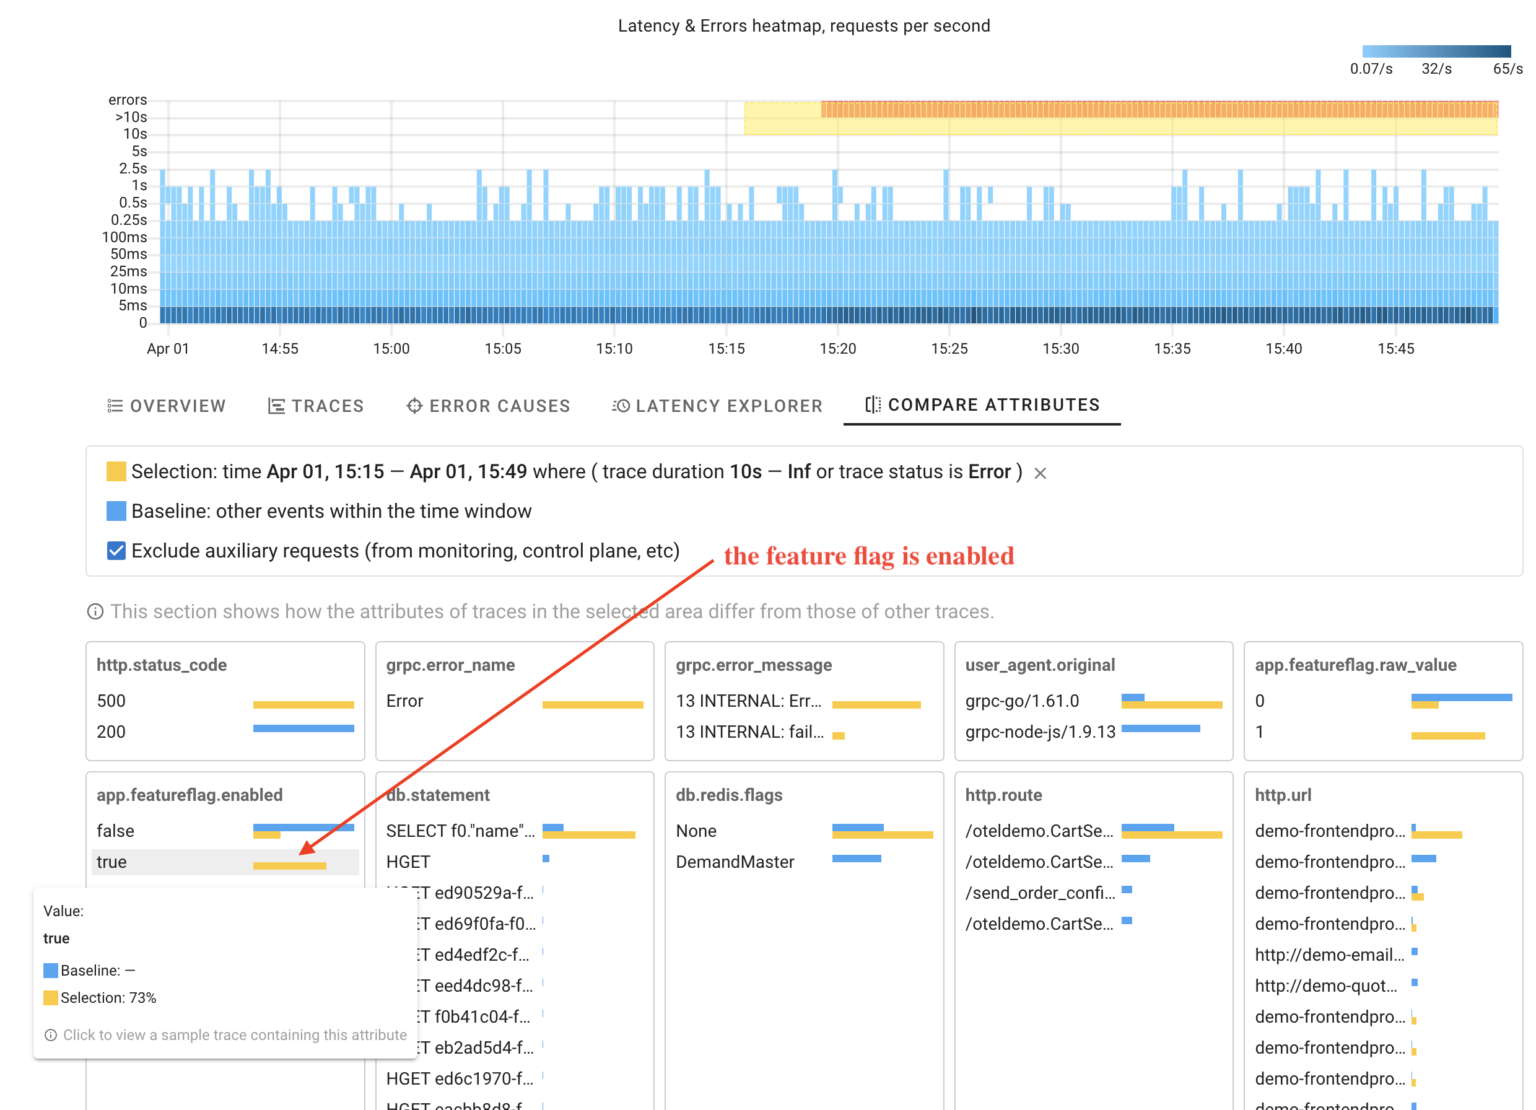
Another thing which is very helpful to understand Why Errors or high latency is happening is to be able to compare and contrast the difference between the normal baseline and when errors are happening – Coroot allows you to do just that with its “Compare Attributes” feature:
Latency Outliers
Another kind of issue we often diagnose with RED method is slow requests or in other words latency outliers. With “Latency Explorer” Coroot analyzes all the traces to highlight where specifically elevated latency comes from:
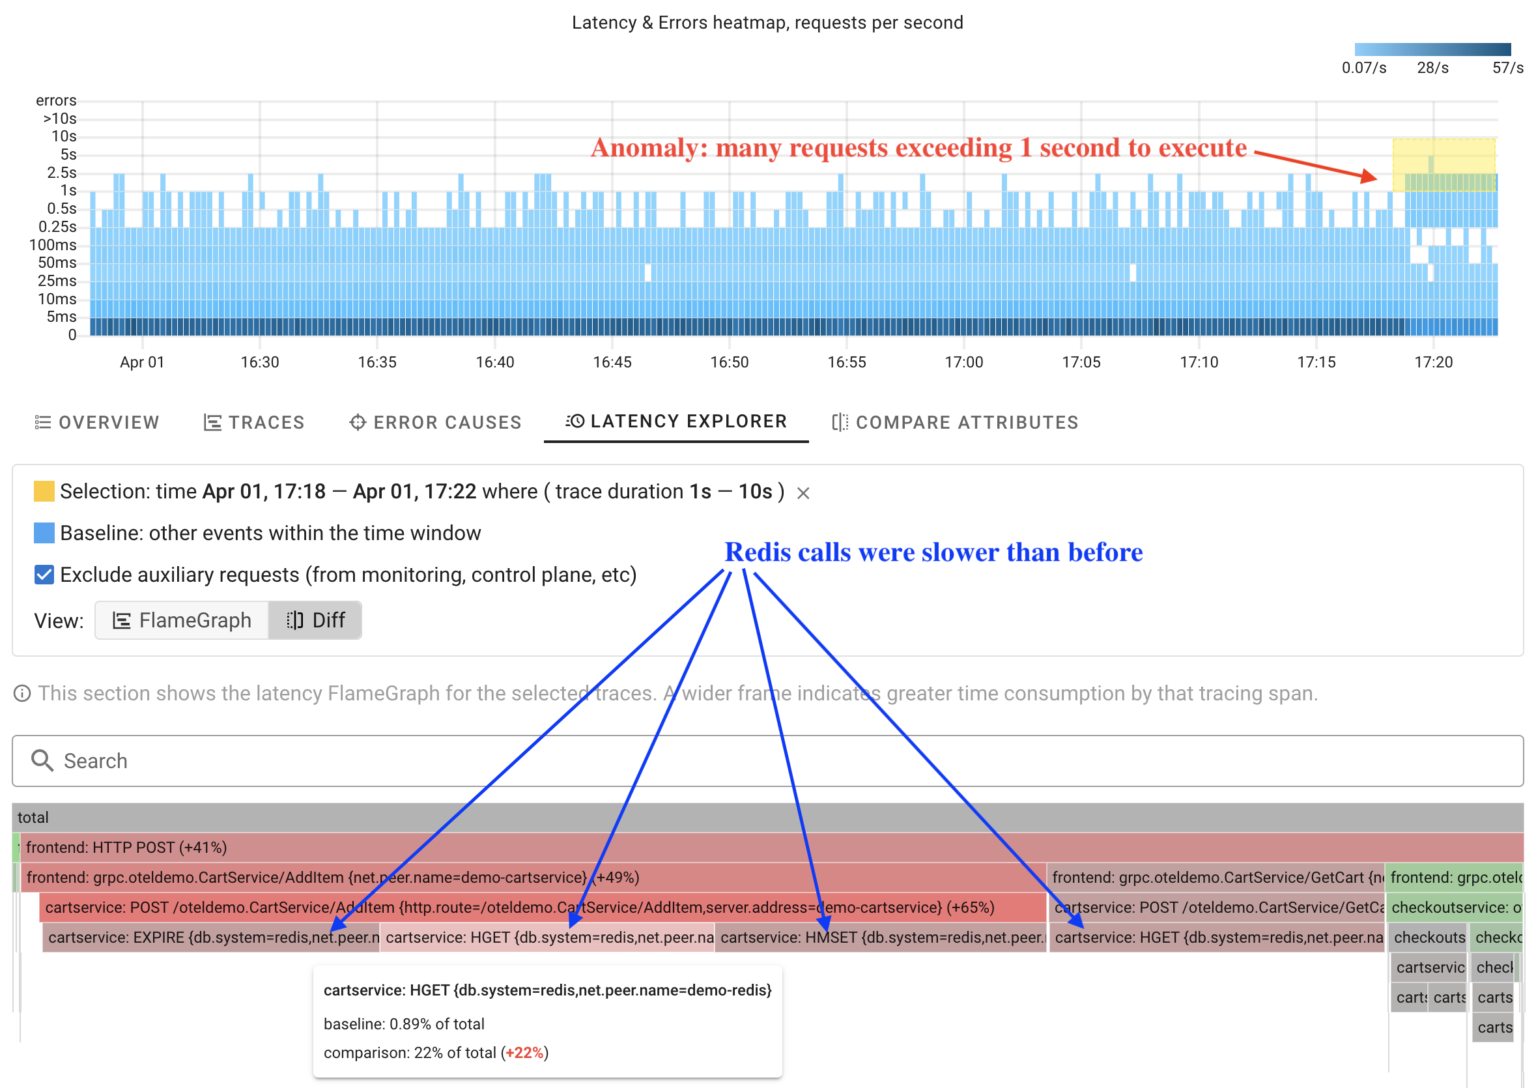
Coroot visualizes latency as Flamegraph where wider frames means higher contribution to the latency and operations highlighted in red in comparison mode are taking more time than before. This makes it very easy to pinpoint where specifically the increased latency is coming from.
Conclusion
Coroot makes distributed tracing easy, allowing you to diagnose the most common issues, enabled by OpenTelemetry Traces in just a couple of clicks. It also can do much more. Check out the Coroot Overview for details.
Try Coroot Enterprise now (14-day free trial is available) or follow the instructions on our Getting started page to install Coroot Community Edition.
If you like Coroot, give us a ⭐ on GitHub️ – it helps us reach more engineers and improve our product for you.
Any questions or feedback? Reach out to us on Slack.