Instrumenting the Node.js event loop with eBPF
 Nikolay Sivko
Recently, I was testing Coroot’s AI Root Cause Analysis on failure scenarios from the OpenTelemetry demo. One of them, loadgeneratorFloodHomepage, simulates a flood of excessive requests. As expected, it caused a latency degradation across the stack.
Coroot’s RCA highlighted how the latency cascaded through all dependent services. At the same time, we noticed a moderate increase in CPU usage for the frontend service and the node itself. But there was still plenty of CPU capacity available, so simply adding more nodes would not have helped.
CPU profiling didn’t show any single hot spot either, usage was increasing proportionally across the code, which is exactly what you’d expect under load. The trick here is that Node.js runs on a single-threaded event loop. Even if the node has multiple free CPU cores, the event loop is bound to one core.
Yes, Node.js can offload some CPU-bound tasks to its internal thread pool. But when the main loop is close to saturating one CPU core, performance falls off a cliff. What we really need is a metric that tells us how much time the event loop is blocked. Ideally, we want this without changing the application code.
That’s where eBPF comes in. By instrumenting the Node.js event loop, we can get exactly this signal. But first, we need to understand how the event loop works.
How the Node.js event loop works
The event loop in Node.js is powered by libuv, a C library that handles asynchronous I/O. The main entry point is uv_run():
int uv_run(uv_loop_t* loop, uv_run_mode mode) {
    while (/* loop has work */) {
        uv__run_timers(loop);
        uv__run_pending(loop);
        uv__io_poll(loop, timeout);
        uv__run_check(loop);
        uv__run_closing_handles(loop);
    }
}
The most important function here is uv__io_poll(). It does two things:
- Waits for events (via
epoll_wait() on Linux). This part is idle and does not block the loop in the “bad” sense. - Runs I/O callbacks synchronously. If one of these callbacks takes 500ms, the whole event loop is stuck for 500ms. This is the part that causes latency.
So we need to measure:
- Time outside uv__io_poll (housekeeping like timers and checks).
- Time inside synchronous callbacks within uv__io_poll (the real blocking time).
eBPF-based instrumentation
Here’s a simplified view of an iteration:
uv_run()
 ├── uv__run_timers()
 ├── uv__run_pending()
 ├── uv__io_poll()
 │     ├── epoll_wait()      ← waiting, ignore
 │     ├── uv__stream_io()   ──┐
 │     ├── uv__async_io()      │ synchronous callbacks
 │     ├── uv__poll_io()       │ (blocking happens here)
 │     ├── uv__server_io()     │
 │     └── uv__udp_io()      ──┘
 ├── uv__run_check()
 └── uv__run_closing_handles()
To measure blocking:
- Outside uv__io_poll: record timestamp at uv__io_poll exit, subtract from timestamp at next uv__io_poll entry.
- Inside synchronous callbacks: attach uprobes/uretprobes to functions like uv__stream_io, uv__async_io, uv__poll_io, uv__server_io, uv__udp_io, and measure their execution times.
Counters, not events
The probes themselves do almost nothing: on every event they just increment per-PID counters in an eBPF map. This is extremely lightweight, the kernel keeps track of accumulated nanoseconds of blocking time per process, without pushing every single measurement up to userland.
To expose these metrics in the Prometheus format, the userland part of our agent periodically:
- Iterates over the eBPF maps.
- Reads the per-PID counters.
- Refreshes the exported metrics.
Compared to perf events (where each measurement generates an event passed to userland), this approach is far more efficient. Instead of flooding the system with events, we simply maintain counters in the kernel and scrape them at a steady interval.
The result: low overhead, production-ready instrumentation that works transparently for any Node.js process on the host.
Validating the metric
To validate this new metric, I reran the same failure scenario (loadgeneratorFloodHomepage) from the OpenTelemetry demo, but this time with the Node.js event loop blocked time metric enabled.
Here’s what Coroot’s RCA showed:
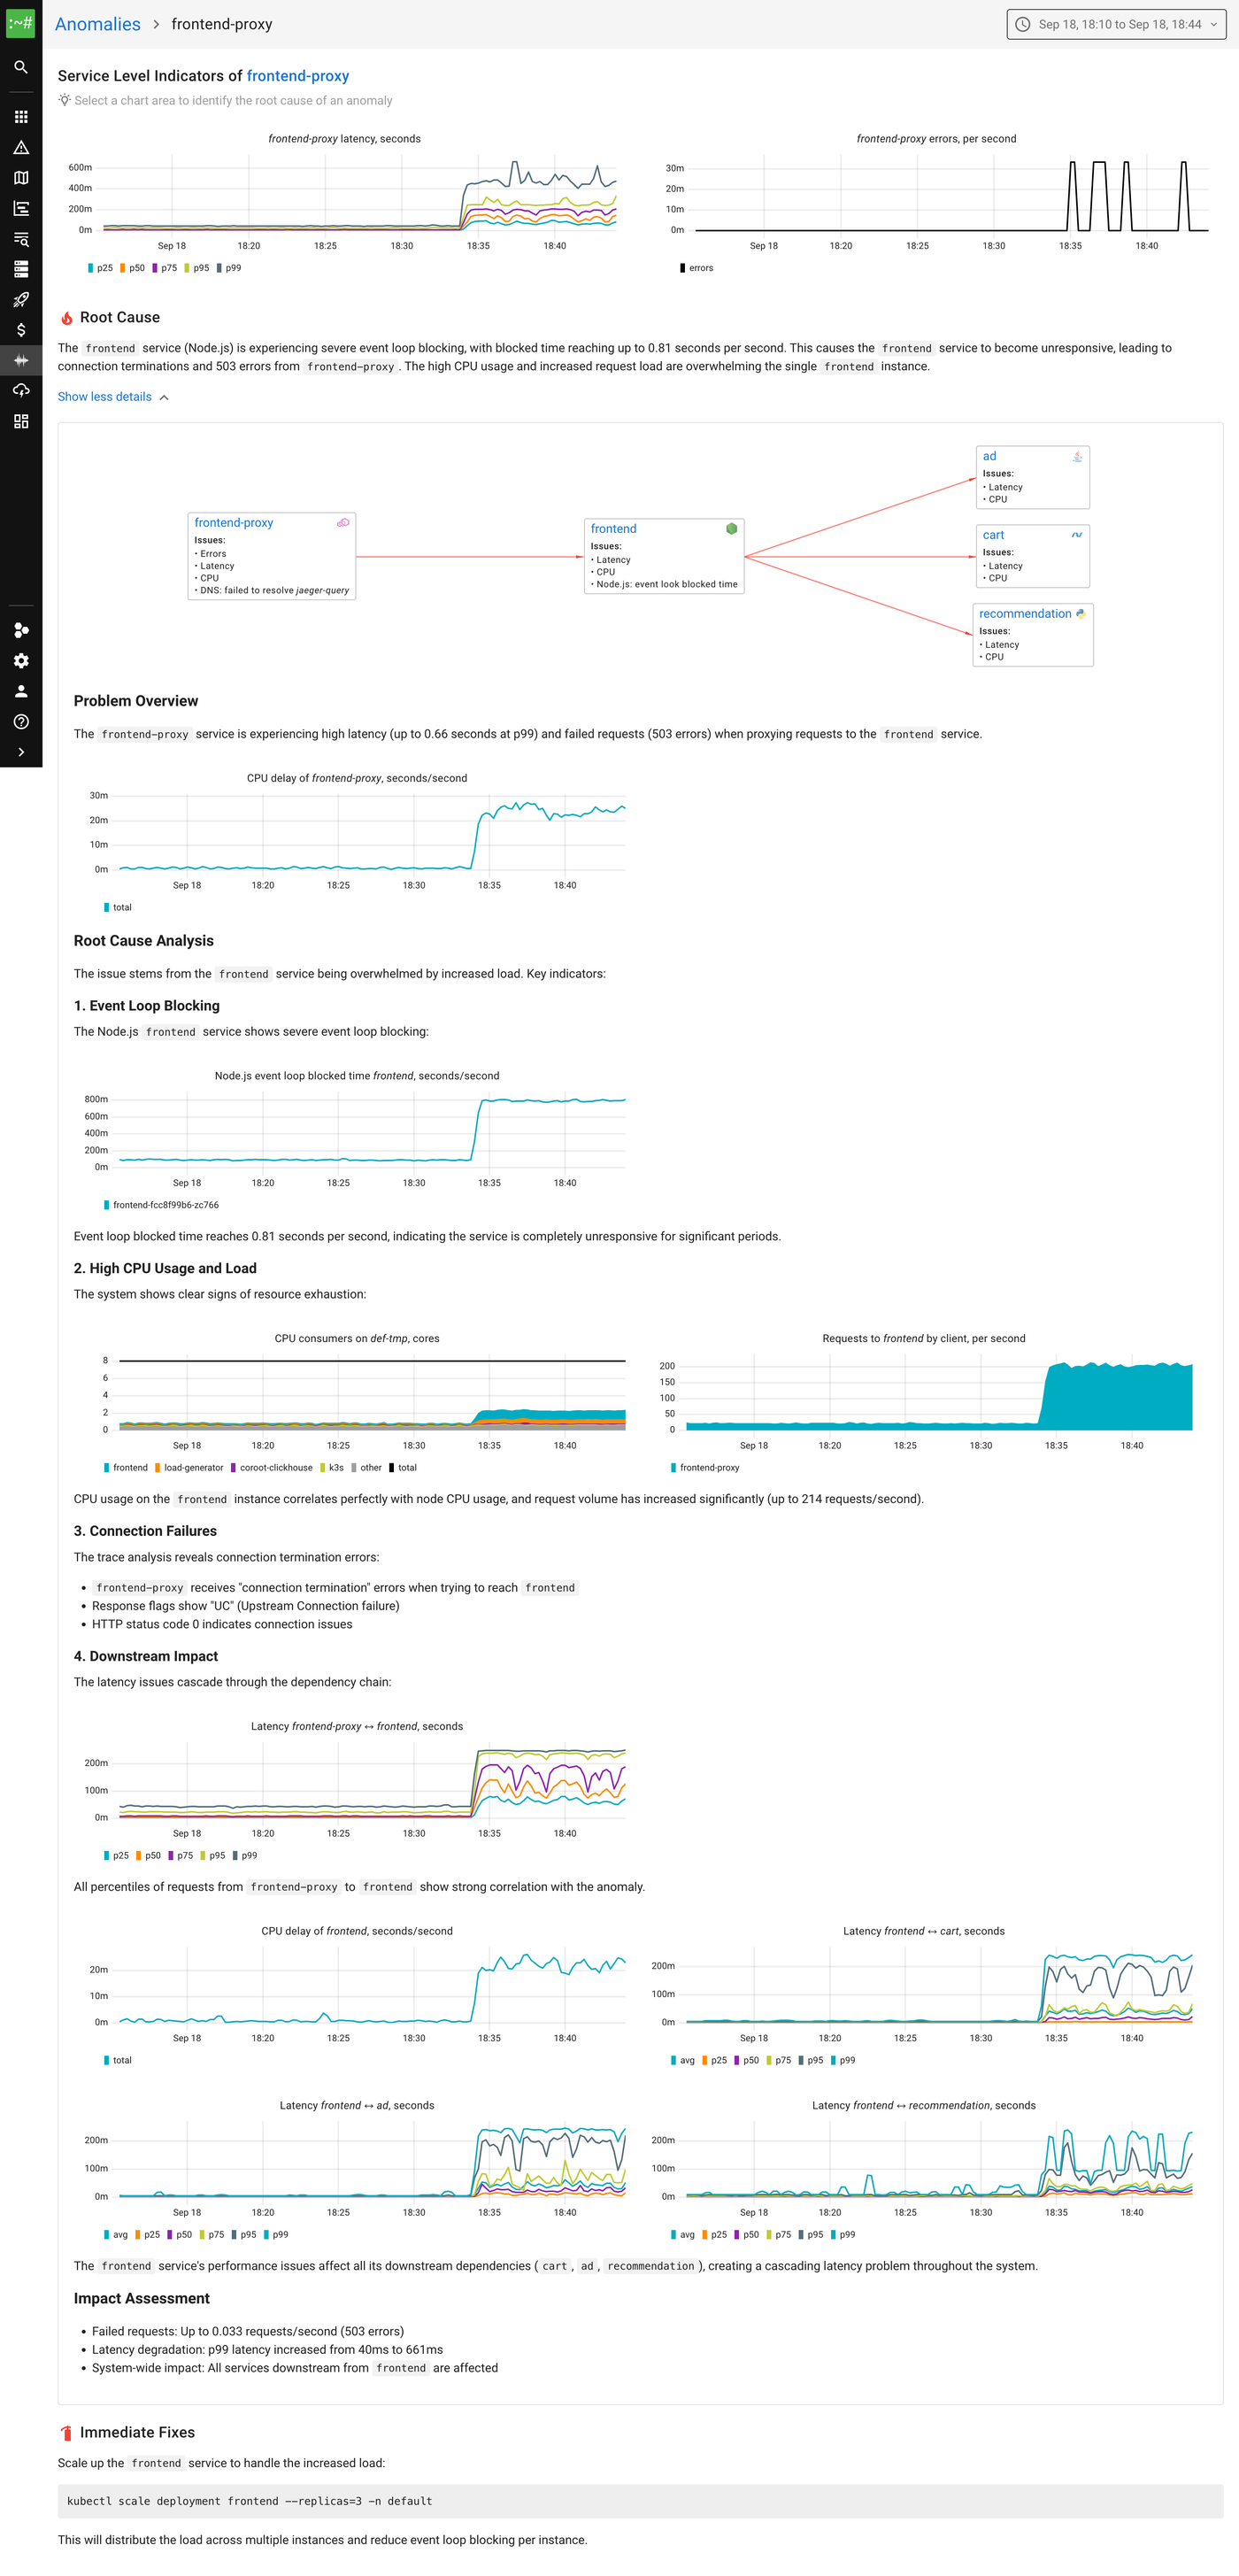
With this metric in place, the root cause is immediately obvious:
- The frontend service shows event loop blocked time reaching up to 0.81 seconds per second.
- This explains why the service became unresponsive, despite the node still having available CPU capacity.
- The RCA now highlights this metric directly, making the cause clear without digging into CPU profiling or traces.
And the suggested fix is correct: scale the frontend deployment so the load is spread across multiple instances. Each one runs its own event loop, which lets the service use multiple CPU cores instead of being stuck on just one.
Wrapping up
By instrumenting the Node.js event loop with eBPF, we finally get a metric that shows when the loop is blocked, something CPU usage alone can’t reveal.
In the OTel flood scenario, it made the root cause clear: the frontend service hit its single-core event loop limit. The fix was just to add more replicas and spread the load across multiple event loops.
Now, instead of guessing, we can see exactly when a Node.js service is stuck and know how to fix it.
This metric is already integrated into both Coroot Community and Enterprise Edition, so you can use it out of the box to catch Node.js bottlenecks before they take down your services.