Let's make alerting great again
 Nikolay Sivko
Why alerts exist
No one has time to watch dashboards all day. Alerts exist to tell us when something goes wrong or is starting to go wrong, so we can act early. In theory, it sounds simple. Define a rule, set a threshold, get notified when it is crossed.
In practice, it rarely works that smoothly.
The threshold trap
Most alerting today is threshold based. CPU above 80 percent. Error rate above 5 percent. A specific log line appears. Every team writes the same rules. Then rewrites them. Then tunes them again.
Soon the real struggle begins. Silence versus noise.
If alerts are too sensitive, you get constant interruptions. If they are too relaxed, you miss important signals. After every incident, new rules are added. After every noisy week, some are muted. Thresholds get adjusted. Durations get extended. Alerting turns into continuous maintenance.
The issue is not that alerts are useless. The issue is that they lack context. A metric spike does not always mean a problem. A warning event does not always require action. Classical alerting treats every symptom as equally important, even when it is not.
What we did at Coroot
At Coroot, we focus on understanding systems as a whole, not just individual signals. By analyzing metrics, logs, traces, profiling data, and Kubernetes signals, we help thousands of teams troubleshoot and understand what is really happening inside their systems. Until recently, we only alerted on significant SLO violations, when user impact was clear. That approach kept noise low, but it also meant alerts arrived late.
Many teams asked for earlier signals. Not just SLO violations, but classical symptom based alerts that help them react before users feel the impact.
So we added them.
Symptom based alerts in Coroot
We did not simply add another rule engine on top of Coroot.
Coroot already had dozens of predefined inspections covering common failure scenarios. Resource contention. Memory pressure. Network issues. DNS resolution problems. Database internals. These inspections were already analyzing telemetry and detecting unhealthy patterns with context.
We turned them into alerts.
This changes the quality of the signal completely. Instead of alerting on something like “catalog: high network latency to 1.2.3.4”, Coroot can say “catalog: high in-cluster network latency (5 dependencies affected)”. The alert is attached to the application. It explains the scope. And it includes the supporting evidence directly in the alert details.
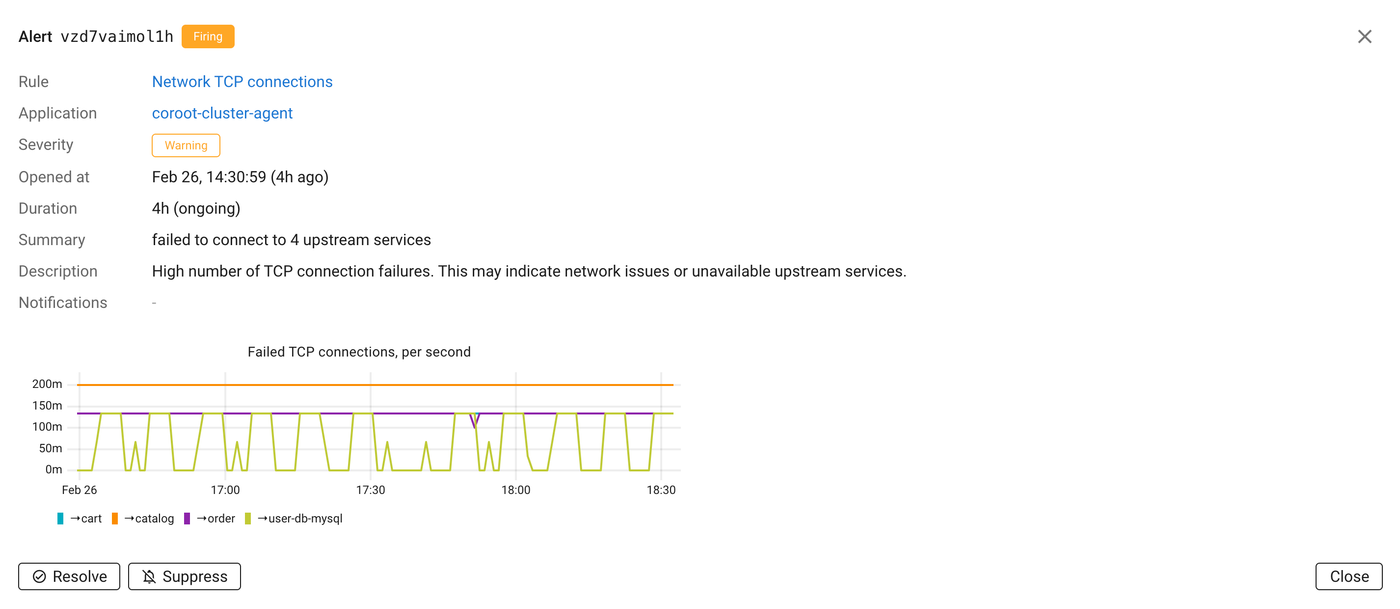
Because inspections already understand the system, alerts inherit that understanding.
Another important piece is threshold management. We allow adjusting thresholds globally, per cluster, or per application. Different environments have different baselines. A staging cluster and a production cluster should not behave the same way. A latency sensitive service and a batch job should not share identical limits. This flexibility makes alerts practical instead of rigid.
And finally, suppression is simple. If a specific alert instance is not a real problem, users can explain that to the system with a single click and suppress that instance. Not the entire rule. Just this case. Alerting should learn what matters in your environment instead of forcing you to rewrite rules.
Log based alerts that highlight new error patterns
Even with many predefined inspections, we know it is impossible to cover every possible failure scenario out of the box. Logs are the next obvious signal.
The classical approach to log alerting is straightforward. Users define a log query. If something matches, they get paged. This works, but it requires constant rule writing and maintenance. If you ask SREs what they actually want, the answer is often different. They want to be paged on any new serious errors in their logs.
That is a much harder problem.
Coroot agents already transform logs into structured patterns. Instead of treating ten thousand log lines as ten thousand separate events, we extract repeating patterns and count their occurrences. We might detect that there are five distinct error types and track how frequently each one appears.
We turned this capability into alerts.
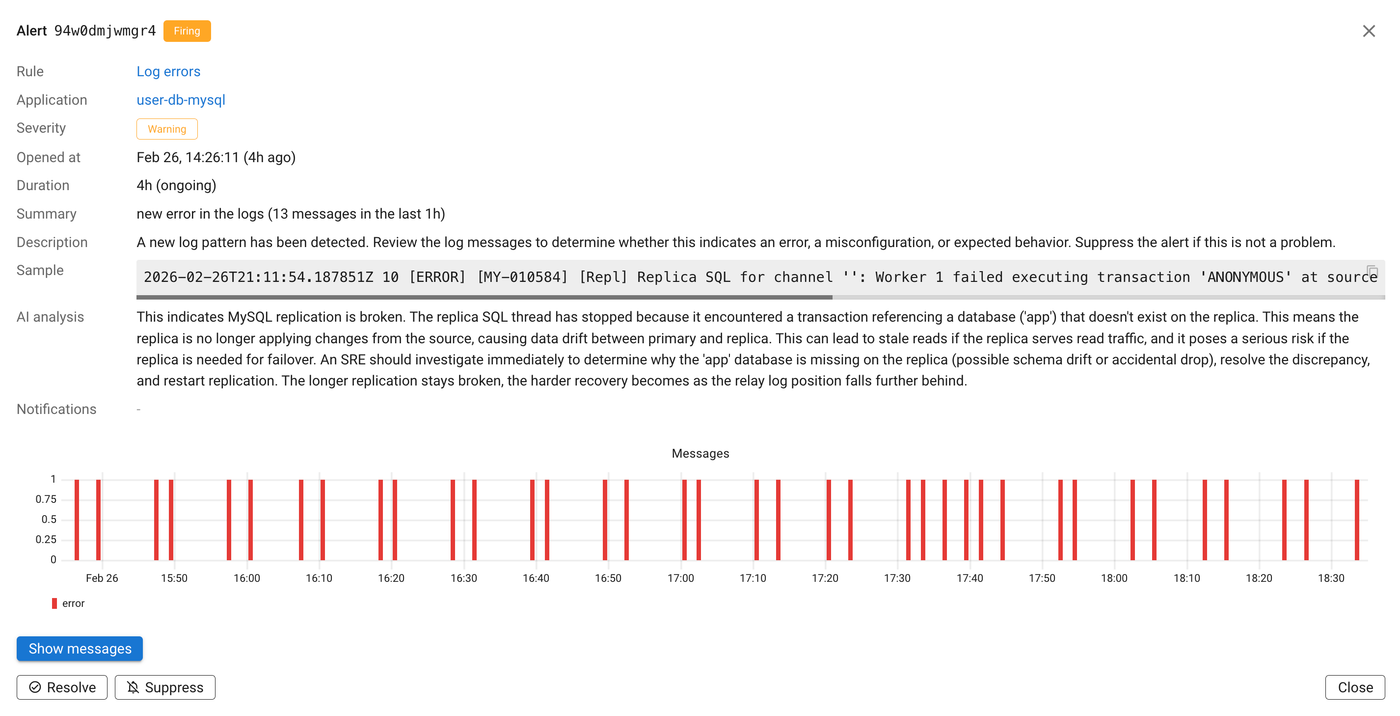
Coroot ignores already known error patterns and notifies only when a new log pattern appears. This dramatically reduces noise and focuses attention on what changed.
We also use LLMs to evaluate whether an error pattern is serious enough to wake someone up at 2 a.m. Models have broad contextual knowledge. They can recognize that a message related to an SSH brute force attempt is likely background noise rather than an application failure.
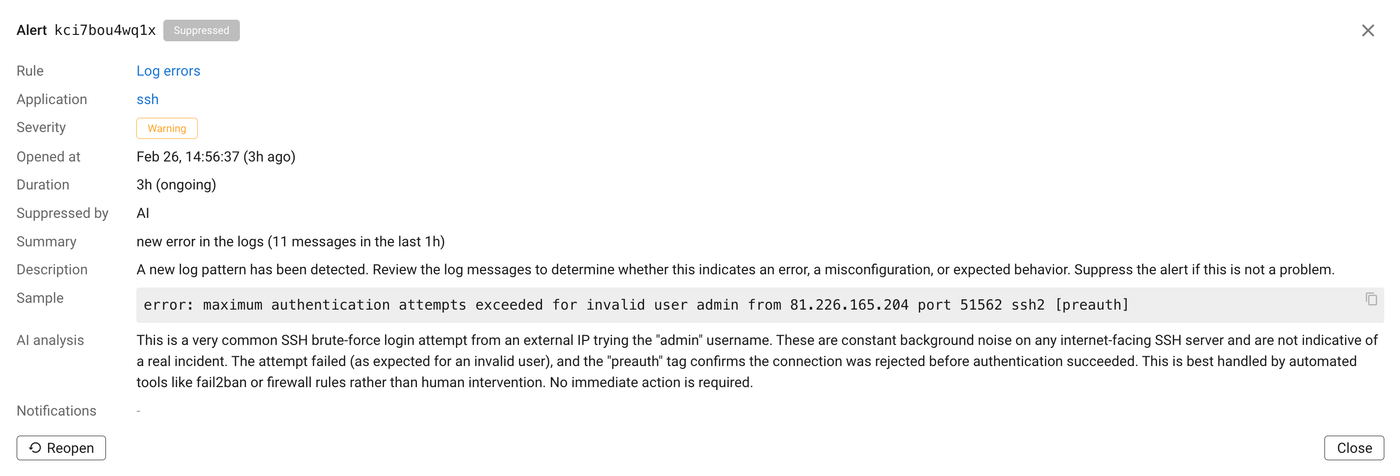
Again, suppression is one click away. If something is not relevant in your environment, you can tell Coroot. The system adapts without disabling the entire detection logic.
Kubernetes events without event storms
Kubernetes events are another valuable but noisy signal. Events are similar to logs. They are granular and often repetitive. A single underlying issue can generate dozens or hundreds of pod level events.
We aggregate pod level events to the application level. Instead of receiving an alert for every affected pod, you get a single meaningful signal attached to the application.
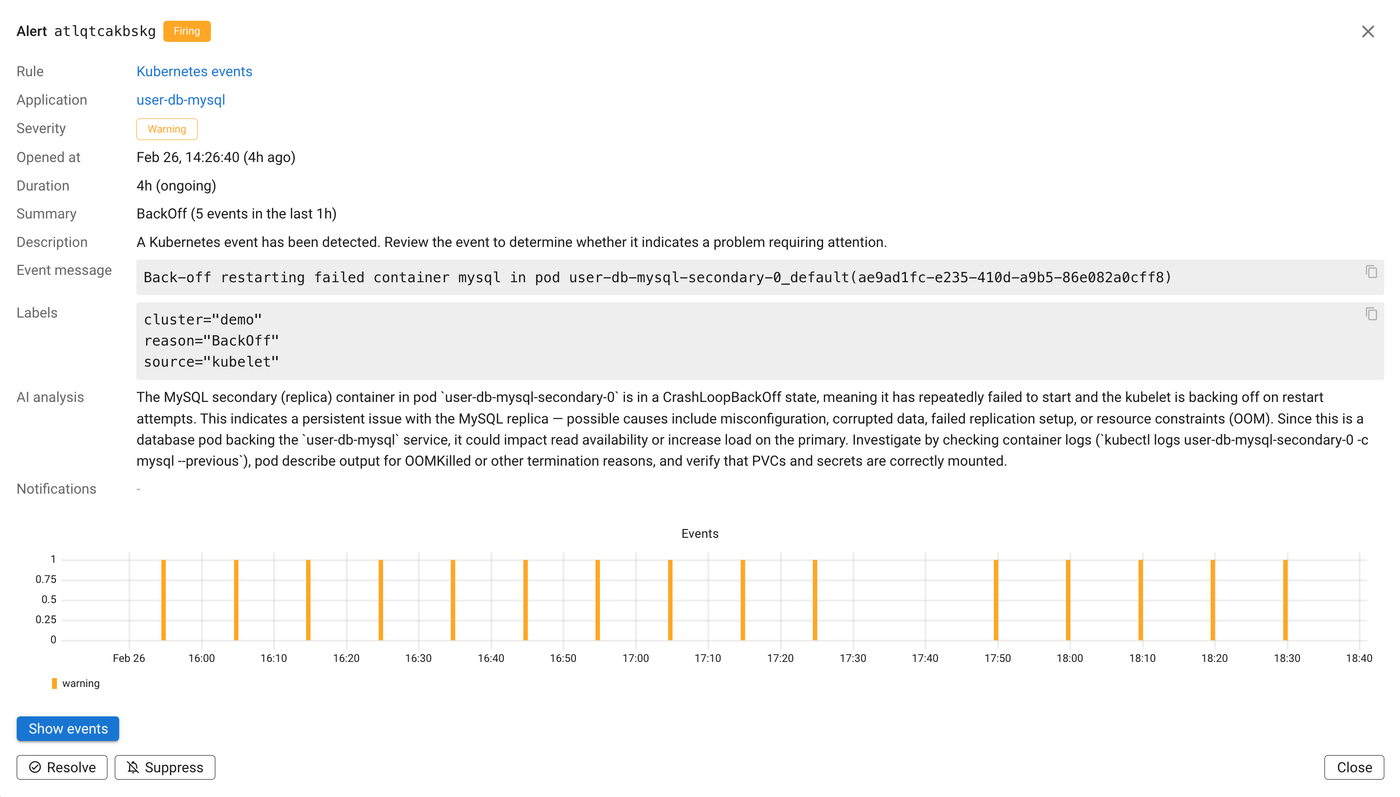
We also understand how Kubernetes generates events internally. For example, the node controller can emit many pod related events when a node becomes unavailable. Without proper aggregation, this can create an alert storm. Coroot groups these events appropriately so users do not have to deal with the mechanics of Kubernetes internals.
The result is actionable signals instead of raw event noise.
Custom rules when you need them
We understand that no predefined system can cover everything. That is why we also support custom PromQL based alerts. There is nothing revolutionary about this part. If you need a specific expression evaluated, you can define it.
The difference is that even custom alerts benefit from Coroot’s application context and the same simple suppression workflow. Alerts remain attached to the services you care about and can be silenced per instance when they are not relevant.
Final thoughts
Alerting should not be a constant battle between silence and chaos.
Traditional alerting creates endless toil. Teams write rules, tune thresholds, suppress noise, and keep fixing gaps after every incident.
With Coroot, most of this is already done for you. Inspections, log pattern detection, and Kubernetes event aggregation are preconfigured out of the box. Minutes after installation, you already have a meaningful alerting setup without writing a single rule.
From there, you just adjust. Tune thresholds globally, per cluster, or per application. Suppress specific alert instances when needed. Add custom rules if required.
No rebuilding alerting from scratch. Just useful signals, ready to go.
Install Coroot Community Edition or start a free trial of Coroot Enterprise Edition today to get full access to AI based features. And if you like what we are building, give us a star on GitHub.