Memory stall: the agony before OOM
 Nikolay Sivko
When we set a memory limit for a container, the expectation is simple: if the app leaks memory, the OOM killer steps in, the container dies, Kubernetes restarts it, done.
But reality is messier. As a container gets close to its memory limit, allocations don’t just fail instantly. They get slower. The kernel tries to reclaim memory inside the cgroup, and that takes time. Instead of being killed right away, your app just crawls.
How bad this slowdown gets depends on how much memory is used and how fast new allocations come in. Sometimes it’s barely noticeable. Other times… it drags on painfully.
A quick example
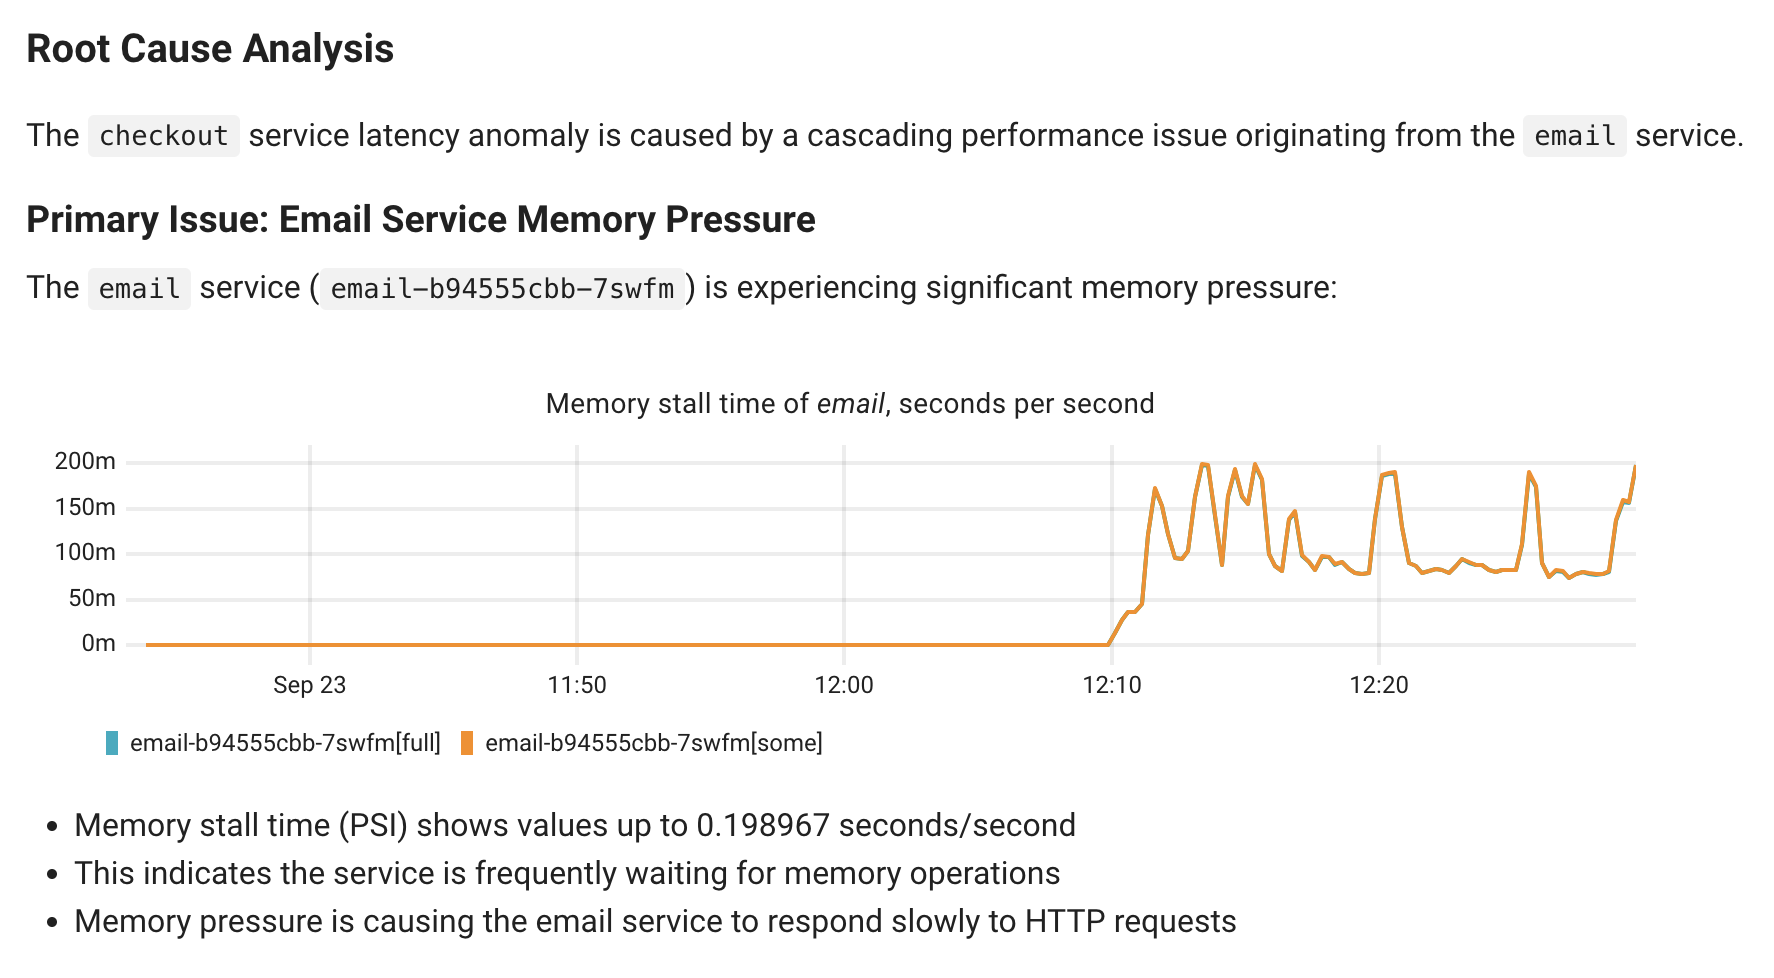
In my demo environment, the email service had a 200 MB limit. Memory usage climbed up, and at some point latency went through the roof.
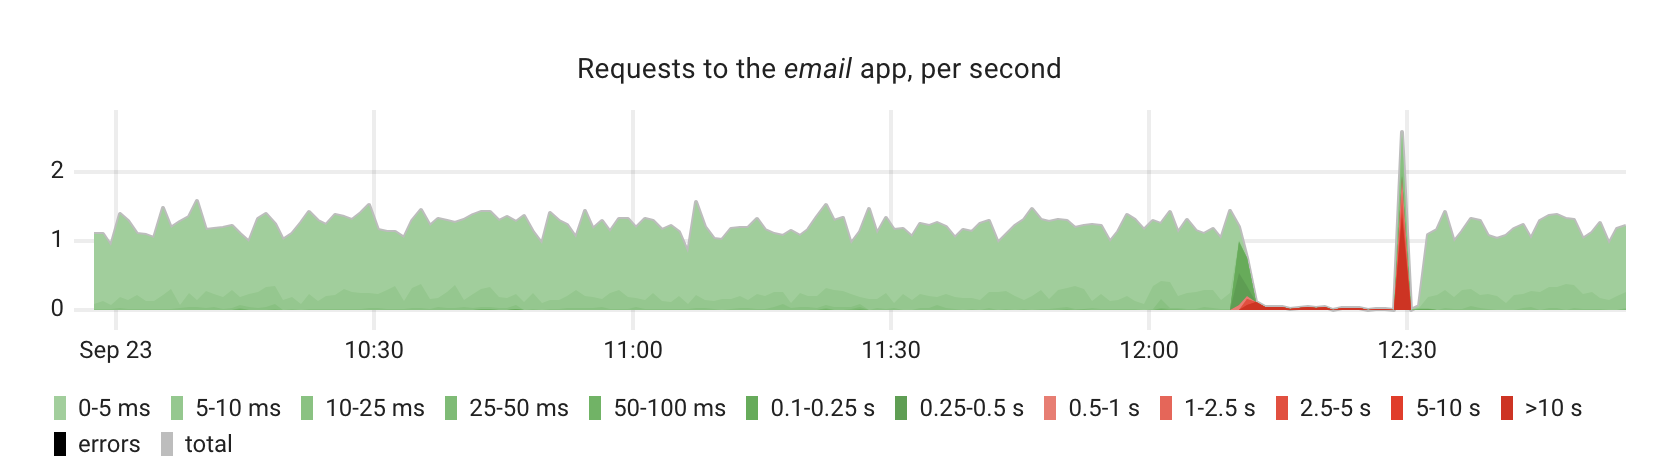
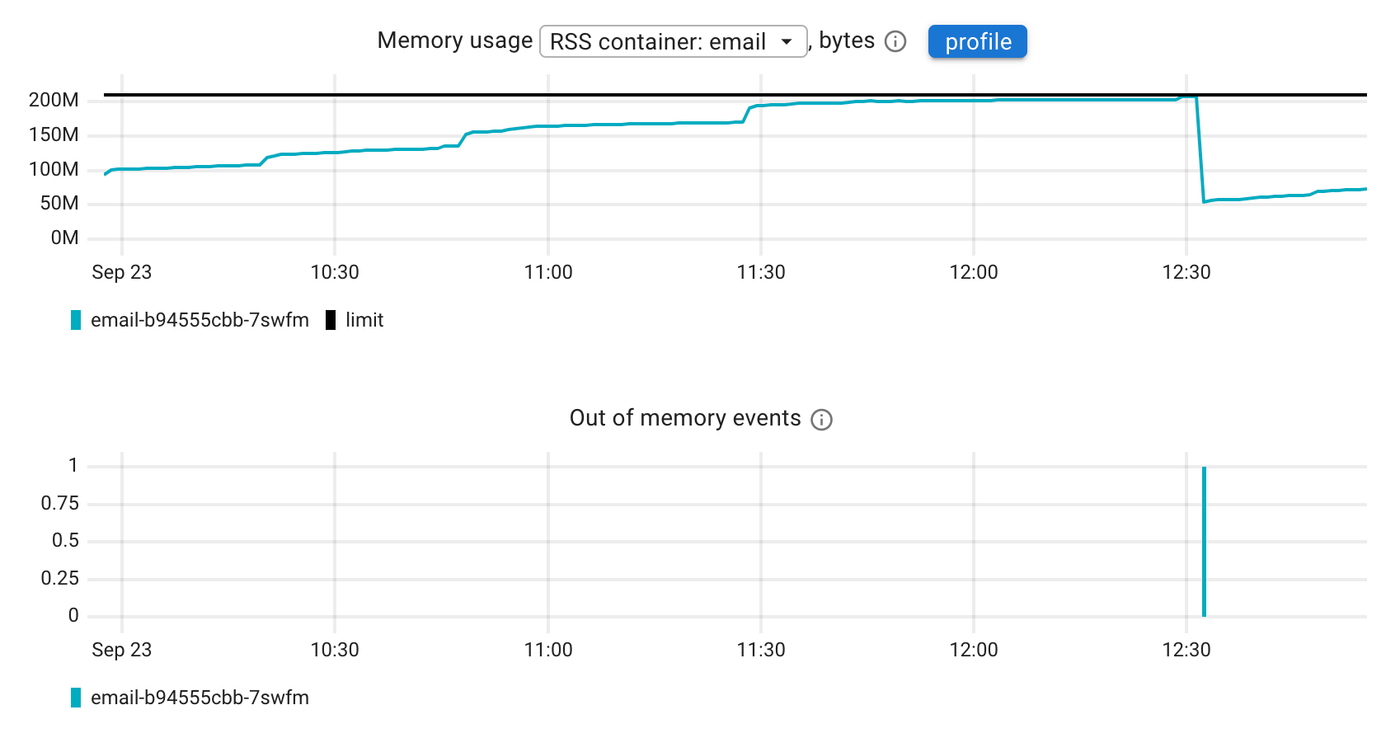
The container was eventually killed and restarted, but only after 22 minutes of degraded performance and downtime
The missing metric
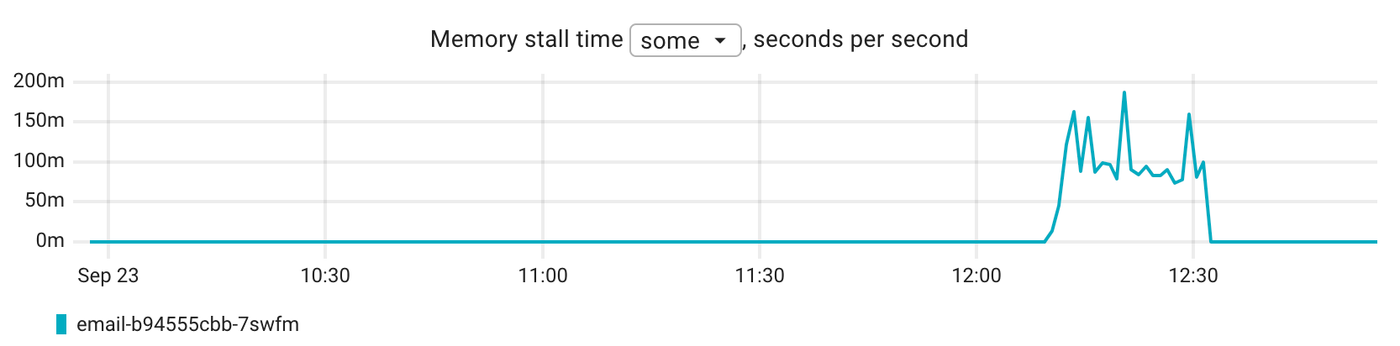
Watching just memory usage doesn’t tell you this story. What we really need is a metric for the “agony phase” before OOM. That metric already exists: PSI (Pressure Stall Information).
It shows how much time processes are stuck waiting for resources:
- some → at least one process stalled
- full → all processes stalled
For memory, that means: how many seconds per second processes were waiting for allocations.
With cgroup v2, PSI is available per cgroup in the memory.pressure, cpu.pressure, and io.pressure files. Each reports:
- rolling averages for the last 10s, 1min, and 10min,
- plus the total stall time in microseconds.
Example:
some avg10=0.00 avg60=0.00 avg300=0.00 total=952401989
full avg10=0.00 avg60=0.00 avg300=0.00 total=947479586
We’ve added support for these metrics in coroot-node-agent, so it exports the per-container total stall time directly.
From metrics to insight
In this case, memory PSI told us exactly what was going on – the app was stalling long before the OOM killer terminated it.
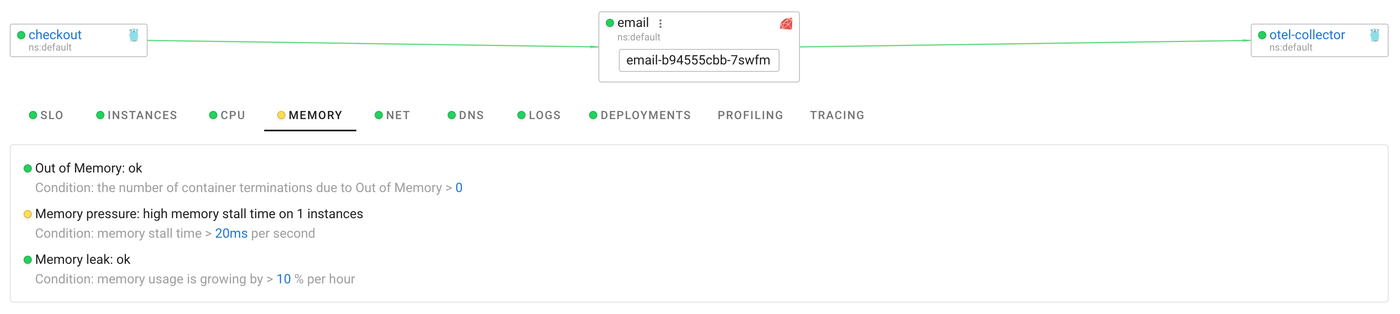
Coroot also has a built-in inspection for this: it flags the issue if memory stall time goes over 20 ms/s (you can tune that).
AI-powered Root Cause Analysis will also point to memory stall as the root cause:
Takeaways
- OOM kills don’t happen right away, apps can stall for a long time first.
- PSI shows that hidden stall phase.
- Coroot exports PSI per container and highlights stalls as root causes.