Missing metrics required to gain visibility into Postgres performance
 Nikolay Sivko
Most methodologies for analyzing the performance of any system lie on two basic metrics: success rate and latency of requests. I wonder, why this simple and straightforward approach isn’t applied in database management? Every monitoring integration for Postgres I’ve seen collects tons of metrics, but neither the success rate nor the latency of queries is among them. It’s probably because it’s hard to do properly. In this post, I’ll explain how we implemented gathering said metrics in our open-source exporters.
Postgres query statistics
There are few data sources in Postgres where you can get query statistics.
pg_stat_statements— stores statistics about successfully completed queries. If a query is failed or canceled, its statistics will not be taken into account.

pg_stat_activity— shows the currently running queries

- Log — contains all the errors that occurred and statistics of the queries that executed longer than
log_min_duration_statement

As seen in the diagrams above, we can’t get a full picture based on just one of these sources.
Coroot-pg-agent combines statistics from pg_stat_activity and pg_stat_statements, so the resulting metrics reflect the actual latency of both completed queries and those still in progress. Implementation of such a combination is challenging for several reasons:
- We need a key to join statistics related to a particular query from these two views.
pg_stat_activitydoesn’t containquery_idin versions prior to 14.0. We aim to support Postgres starting from version 9.6, so the agent uses normalized query text as the key. - The specific query is present either in
pg_stat_activityor inpg_stat_statementsat a specific point in time. However, we cannot simply sum the counters taken from these views, because the resulting counter will decrease if the query fails or is canceled. To avoid this, the agent returns the previous value of a counter if its value has decreased.

pg_stat_statements.total_exec_timeis a wall-clock timer, it doesn’t take into account that a query could be executed in parallel.pg_stat_activity, on the contrary, contains multiple rows for a query that uses multiple workers. As a result, the agent calculates the execution time based only on the connections withbackend_type = ‘client backend’.
Quantiles calculation
Having combined the statistics from pg_stat_statements and pg_stat_activity, now it’s time to calculate a summary of Postgres latency. For a particular type of query, we can only calculate the average execution time as total_execution_time / calls. However, each Postgres server usually performs many different queries, so we can use the average execution time of each query to calculate overall latency quantiles. Let’s see how it works using the example below.
A server performed four types of queries. We know the number of queries of each type and the total execution time, so we can calculate the average query time for each group:
| Query | Calls | Total Time | Average Time |
|---|---|---|---|
| query-1 | 100 | 500ms | 5ms |
| query-2 | 150 | 300ms | 2ms |
| query-3 | 200 | 2000ms | 10ms |
| query-4 | 500 | 500ms | 1ms |

In this case, the server served 100+150+200+500=950 queries. We can assume, that the latency of each individual query from a group is the average latency of this group. As a result, we get:
- 0.5 quantile is the latency of the 475th element: 1 ms
- 0.75 quantile is the latency of the 712th element: 5 ms
- 0.95 quantile is the latency of the 902nd element: 10 ms
This rather simple approach works more accurately in a real environment where the number of query groups is much higher than in my example.
Errors
Unfortunately, Postgres does not report in any system view the number of errors that occurred. Therefore, the only way to count errors is to parse the log.
Our Prometheus exporters node-agent and aws-agent parse logs and expose the log-based metrics container_log_messages_total and aws_rds_log_messages_total. Since these metrics are broken down by message severity and pattern, we can easily calculate the number of errors in the Postgres log regardless of whether the instance is RDS or self-managed.
# HELP aws_rds_log_messages_total Number of messages grouped by the automatically extracted repeated pattern
# TYPE aws_rds_log_messages_total counter
aws_rds_log_messages_total{rds_instance_id: "us-east-2/pg-main-1", level: "critical", sample: "FATAL: connection to client lost",  pattern_hash: "4174a0b78f3a79718ab011317c9f413b"} 11
aws_rds_log_messages_total{rds_instance_id: "us-east-2/pg-main-1", level: "error", sample: "ERROR: canceling statement due to user request", pattern_hash: "13f3416616c667c6d36d9a4bcf742008"} 22
Service Level Objectives (SLOs) for databases
Now we have metrics that are the basic SLIs (Service Level Indicators) of a Postgres server. Let’s try to define SLOs (Service Level Objectives) — the target levels of each indicator.
Choosing a universal threshold for database latency is a complicated task since application requirements can significantly vary from one app to another. For example, some apps need to execute queries in less than a millisecond, while for others 100ms is more than enough.
At Coroot, we realized that the SLOs of any database depends on the SLOs of its consumers. For each database client not meeting its SLOs, we check the correlation between their affected SLIs and the SLIs of the database. The existence of a strong correlation between them means that this database has an issue affecting an app.
On the one hand, this approach detects even the slightest performance degradations that are affecting the database clients. On the other hand, the probability of false positives is slim since such checks are not fired if all database clients meet their SLOs.
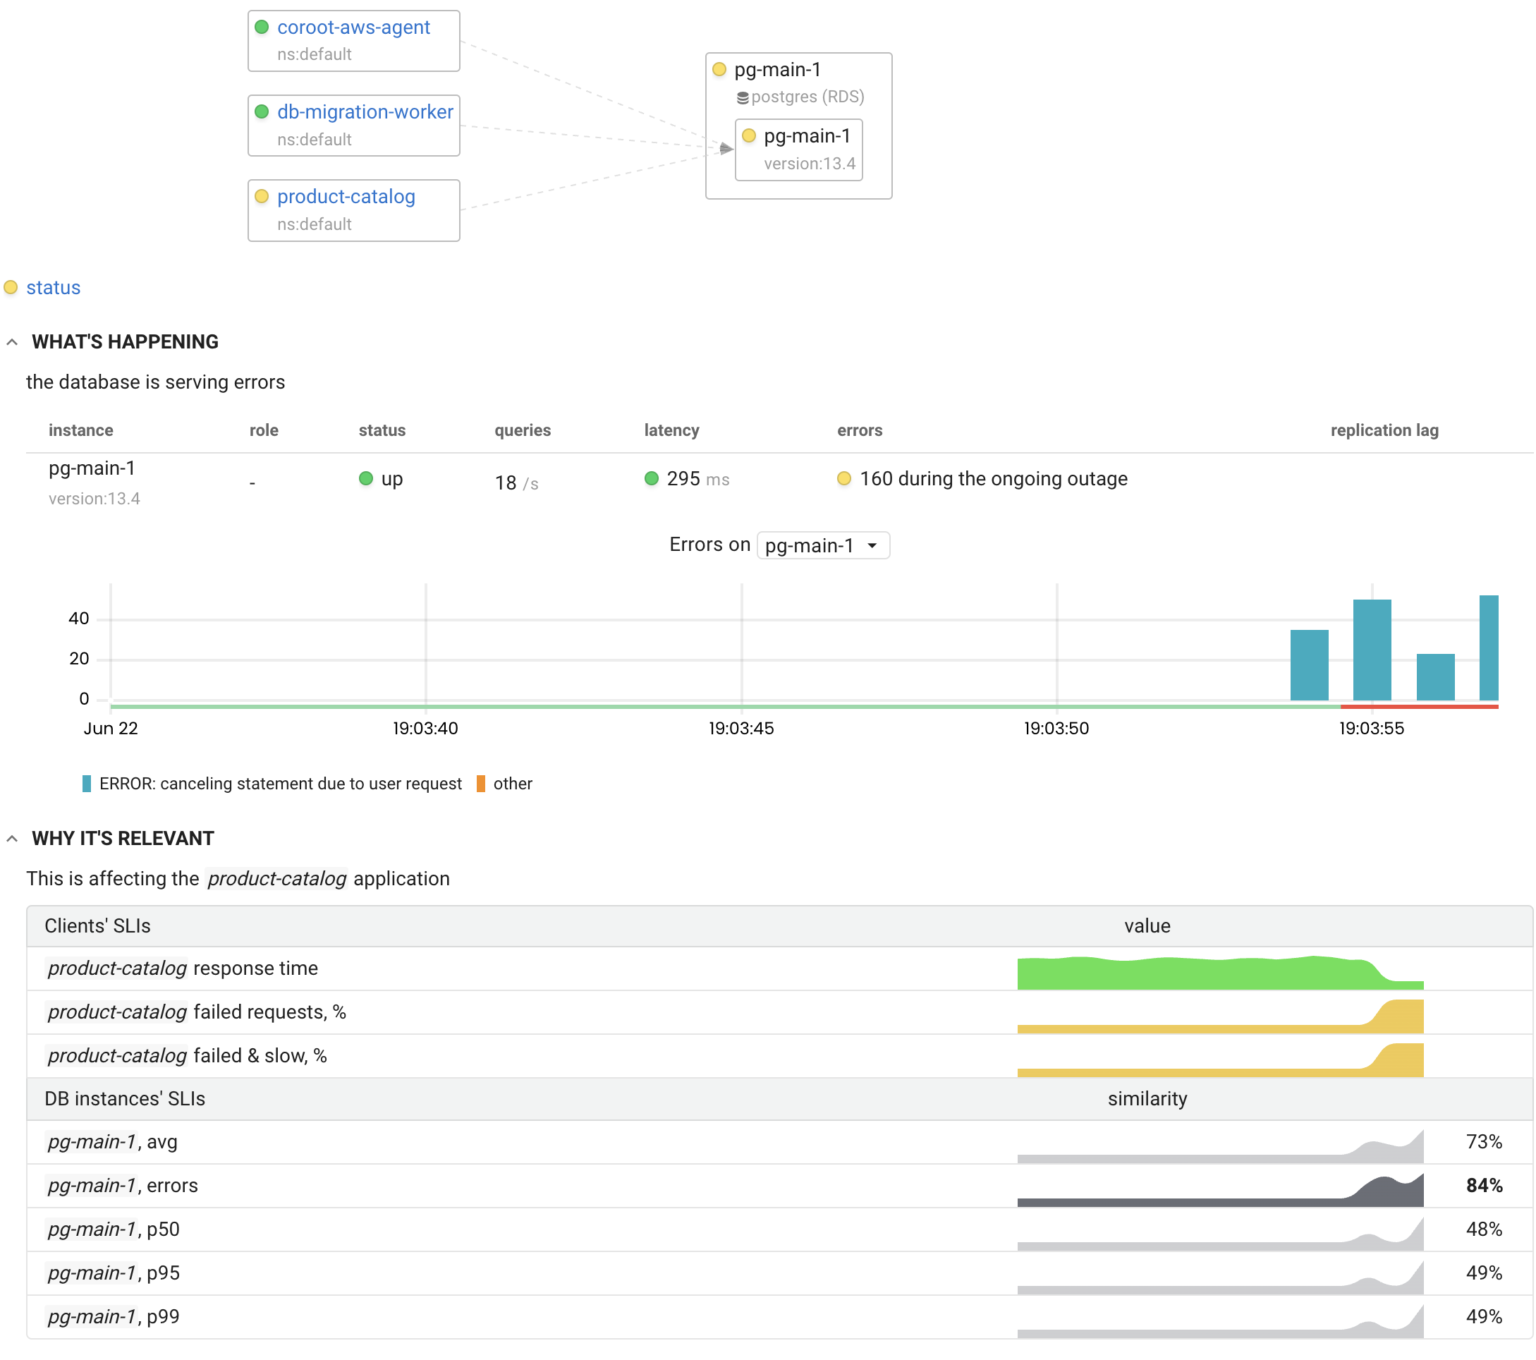
The example below shows how the SLIs of the client application correlate with the SLI of the Postgres server:
Conclusion
SRE practices, such as SLIs & SLOs, are quite applicable to databases. The success rate and latency of queries are great basic SLIs of any database server. Our open-source Prometheus exporters can help you in collecting these and many other useful metrics.
- Get started with Coroot
- pg-agent (Apache-2.0 License)
- node-agent (Apache-2.0 License)
- aws-agent (Apache-2.0 License)