Size-capped telemetry storage with ClickHouse and Coroot
 Nikolay Sivko
Cloud platforms make it incredibly easy to store data. Object storage feels endless, and block volumes can be resized anytime. That’s great, until you check the cost.
In some cases, like financial transactions, storage costs are tiny compared to the value of the data. But observability is a different story. Logs, traces, and profiles can be extremely detailed and often take up more space than the actual business data.
Yes, there are situations where logs need to be kept for compliance reasons. But for many teams, logs and traces are mostly used for troubleshooting. In those cases, it makes a lot more sense to store what is recent, not necessarily what is 30 days old.
Most observability tools let you define how long to keep data. For example, you can say “keep logs for 7 or 30 days” and the system will delete older data automatically. That sounds good in theory, but in practice, estimating how much disk space you will need for 30 days of logs is tricky. Telemetry volume can change dramatically based on traffic, errors, or unexpected load.
Java stack traces at 500 requests per second? Say goodbye to your disk space 💥
At Coroot, we talk to engineers all the time to understand what observability looks like in the real world. Coroot stores logs, traces, events, and profiles in ClickHouse. ClickHouse supports TTLs that delete rows older than a certain age, which works well in many cases. But we kept hearing the same request from users:
We want to store the last 10 TB of data, no matter how many days fit into that
ClickHouse does not currently support size-based retention out of the box. But it does give you everything you need to build it yourself.
When you create a table in ClickHouse, you usually partition it by date using something like PARTITION BY toDate(Timestamp). That means each day of data goes into its own partition. You can list and inspect those partitions easily. Even better, you can delete an entire partition with one command. This is much more efficient than deleting individual rows.
Here is what a telemetry table in Coroot might look like:
SHOW CREATE TABLE otel_logs

 ┌─statement─────────────────────────────────────────────────────────────────────────────────────────┐
 │ CREATE TABLE coroot_tbuzvelk.otel_logs                                                            │
 │ (                                                                                                 │
 │     `Timestamp` DateTime64(9) CODEC(Delta(8), ZSTD(1)),                                           │
 │     `TraceId` String CODEC(ZSTD(1)),                                                              │
 │     `SpanId` String CODEC(ZSTD(1)),                                                               │
 │     `TraceFlags` UInt32 CODEC(ZSTD(1)),                                                           │
 │     `SeverityText` LowCardinality(String) CODEC(ZSTD(1)),                                         │
 │     `SeverityNumber` Int32 CODEC(ZSTD(1)),                                                        │
 │     `ServiceName` LowCardinality(String) CODEC(ZSTD(1)),                                          │
 │     `Body` String CODEC(ZSTD(1)),                                                                 │
 │     `ResourceAttributes` Map(LowCardinality(String), String) CODEC(ZSTD(1)),                      │
 │     `LogAttributes` Map(LowCardinality(String), String) CODEC(ZSTD(1)),                           │
 │     INDEX idx_trace_id TraceId TYPE bloom_filter(0.001) GRANULARITY 1,                            │
 │     INDEX idx_res_attr_key mapKeys(ResourceAttributes) TYPE bloom_filter(0.01) GRANULARITY 1,     │
 │     INDEX idx_res_attr_value mapValues(ResourceAttributes) TYPE bloom_filter(0.01) GRANULARITY 1, │
 │     INDEX idx_log_attr_key mapKeys(LogAttributes) TYPE bloom_filter(0.01) GRANULARITY 1,          │
 │     INDEX idx_log_attr_value mapValues(LogAttributes) TYPE bloom_filter(0.01) GRANULARITY 1,      │
 │     INDEX idx_body Body TYPE tokenbf_v1(32768, 3, 0) GRANULARITY 1                                │
 │ )                                                                                                 │
 │ ENGINE = ReplicatedMergeTree('/clickhouse/tables/{shard}/coroot_tbuzvelk/otel_logs', '{replica}') │
 │ PARTITION BY toDate(Timestamp)                                                                    │
 │ ORDER BY (ServiceName, SeverityText, toUnixTimestamp(Timestamp), TraceId)                         │
 │ TTL toDateTime(Timestamp) + toIntervalDay(7)                                                      │
 │ SETTINGS index_granularity = 8192, ttl_only_drop_parts = 1                                        │
 └───────────────────────────────────────────────────────────────────────────────────────────────────┘
And to see how much space each partition takes, you can run:
SELECT
    partition_id,
    database,
    `table`,
    formatReadableSize(sum(bytes_on_disk)) AS size,
    min(min_time) AS oldest_record
FROM system.parts
WHERE `table` = 'otel_logs'
GROUP BY
    database,
    `table`,
    partition_id
ORDER BY partition_id ASC

 ┌─partition_id─┬─database────────┬─table─────┬─size───────┬───────oldest_record─┐
 │ 20250731     │ coroot_tbuzvelk │ otel_logs │ 395.69 MiB │ 2025-07-31 00:00:00 │
 │ 20250801     │ coroot_tbuzvelk │ otel_logs │ 399.83 MiB │ 2025-08-01 00:00:00 │
 │ 20250802     │ coroot_tbuzvelk │ otel_logs │ 400.81 MiB │ 2025-08-02 00:00:00 │
 │ 20250803     │ coroot_tbuzvelk │ otel_logs │ 400.54 MiB │ 2025-08-03 00:00:00 │
 │ 20250804     │ coroot_tbuzvelk │ otel_logs │ 399.58 MiB │ 2025-08-04 00:00:00 │
 │ 20250805     │ coroot_tbuzvelk │ otel_logs │ 286.37 MiB │ 2025-08-05 00:00:00 │
 └──────────────┴─────────────────┴───────────┴────────────┴─────────────────────┘
Once you know which partition is the oldest, removing it is simple. For single-node setups:
ALTER TABLE otel_logs DROP PARTITION ID '20250731';
For clusters, you either run the same query on each replica or use the ON CLUSTER clause:
ALTER TABLE coroot_tbuzvelk.otel_logs ON CLUSTER coroot DROP PARTITION ID '20250731';
Coroot now uses this exact mechanism to manage disk space automatically. It checks how full each ClickHouse disk is, and once it passes a threshold (like 70%), it starts dropping the oldest partitions until usage falls back under the limit. You can also define a minimum number of partitions to keep, so for example, you always retain at least three days of data.
This gives you predictable storage without needing to predict the unpredictable.
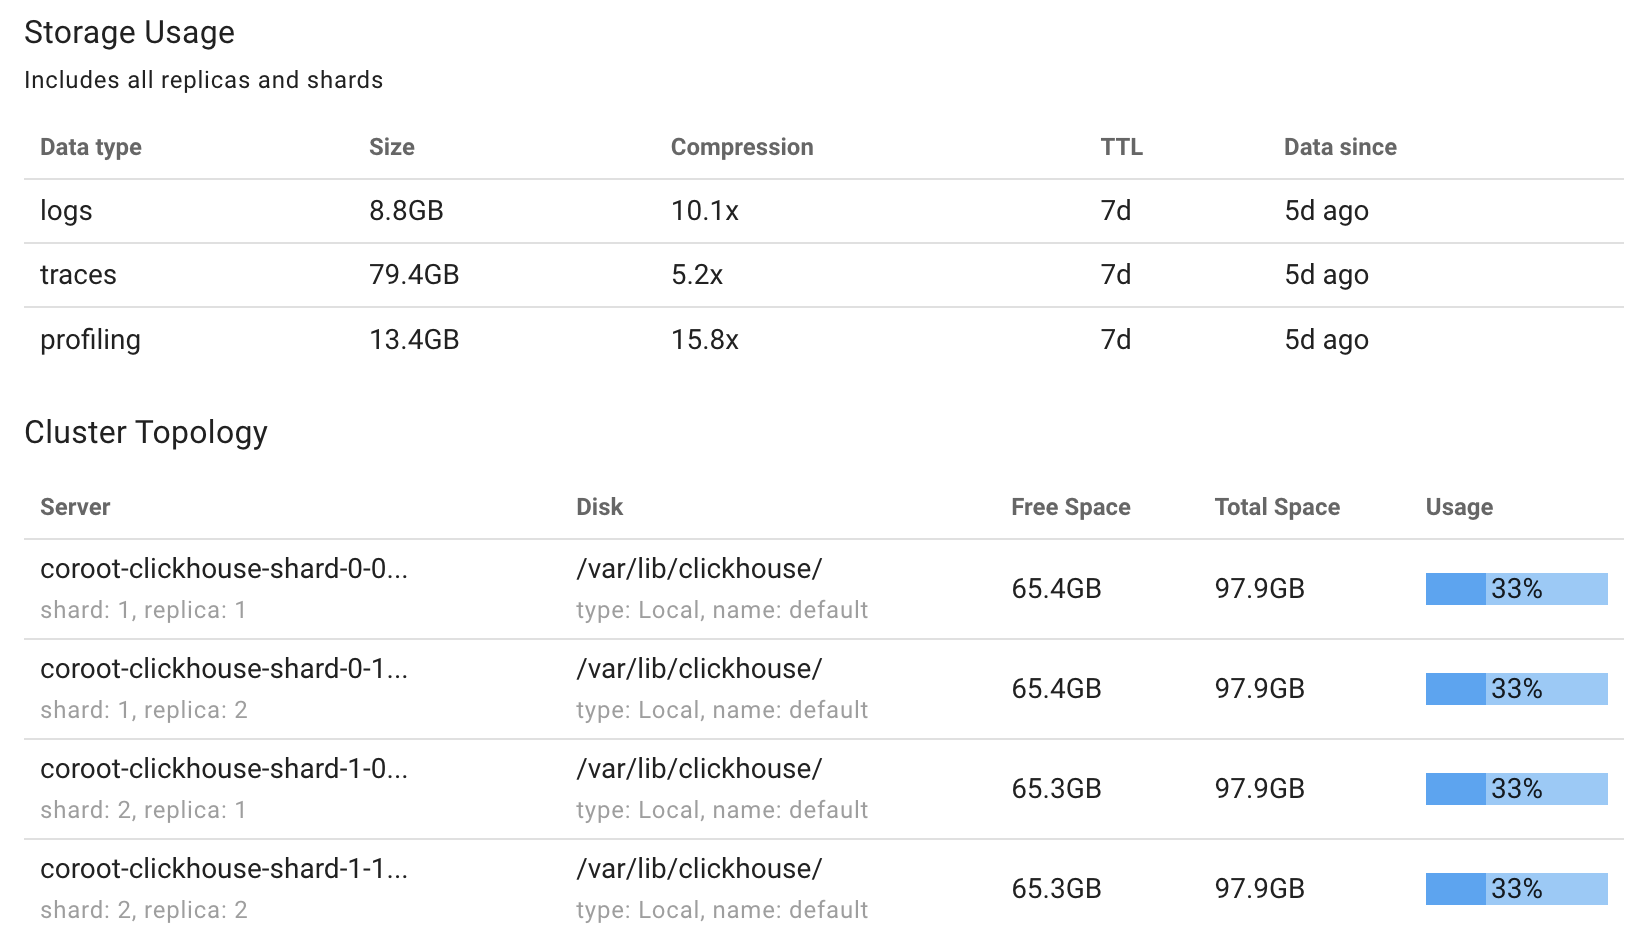
Storage stats
Since retention is now based on size, not time, we added new storage stats to Coroot. You can see how much data is stored by type, what the compression ratio looks like, and how deep your telemetry history goes.
Turn it off if you don’t need it
This feature is enabled by default. It kicks in when disk usage goes above 70 percent and makes sure at least one partition is always kept.
If you prefer to handle retention manually using ClickHouse’s built-in TTLs or external cleanup processes, you can disable automatic cleanup by setting this flag:
--disable-clickhouse-space-manager
You can also adjust the usage threshold and the minimum number of partitions to retain:
--clickhouse-space-manager-usage-threshold=80
--clickhouse-space-manager-min-partitions=3
Full configuration options and documentation are available here.
This gives you full control if you need a different retention strategy or want to integrate with existing cleanup tools.
Final Thoughts
Observability data is noisy, unpredictable, and grows quickly. One day everything’s calm, the next, a service crashes and floods your disk with stack traces. With this update, Coroot makes telemetry storage a lot less stressful. Just set a storage budget, and it takes care of the rest.
Try it out and see how much smoother your observability stack runs when it manages itself.