Monitoring a Docker Homelab with Open Source
 Arie Van Den Heuvel
Arie van den Heuvel is an engineer, a System and Application Management Specialist, and a valued member of our community. You can read more of Arie’s writing and support the resource articles he has contributed to open source on his blog. If you have a story or open source project you would like to share with our community next, you can write to us.
When running a home server consisting of one or more nodes with some or all services in Docker, you may find yourself wanting to monitor your environment. Or even better, attain full observability.
The frequent recommendation for this is a combination of Prometheus with Grafana. But this solution requires a lot of work to fully configure, in addition to work on one’s applications and setup for full visibility. Another possibility is to use the free tier of NewRelic, which has the advantage of remote insights on metrics and logs. Again, this requires additional work on containers or applications to have a more refined visibility of your services.
For those not running Linux, an honourable mention to use as a solution would be Beszel. Beszel can be run as a local service or in docker. It consists of a web front-end and an agent that can be used on multiple systems that run Windows and MacOS. Installation is an easy job in docker. Once it’s running, Beszel provides insightful information with system metrics, docker services, and even logs.
My personal choice for monitoring a home server system is Coroot. In the following blog, I’ll detail how I used Coroot to set up observability for my homelab, which you can then adopt for your own setup.
Observability with Coroot
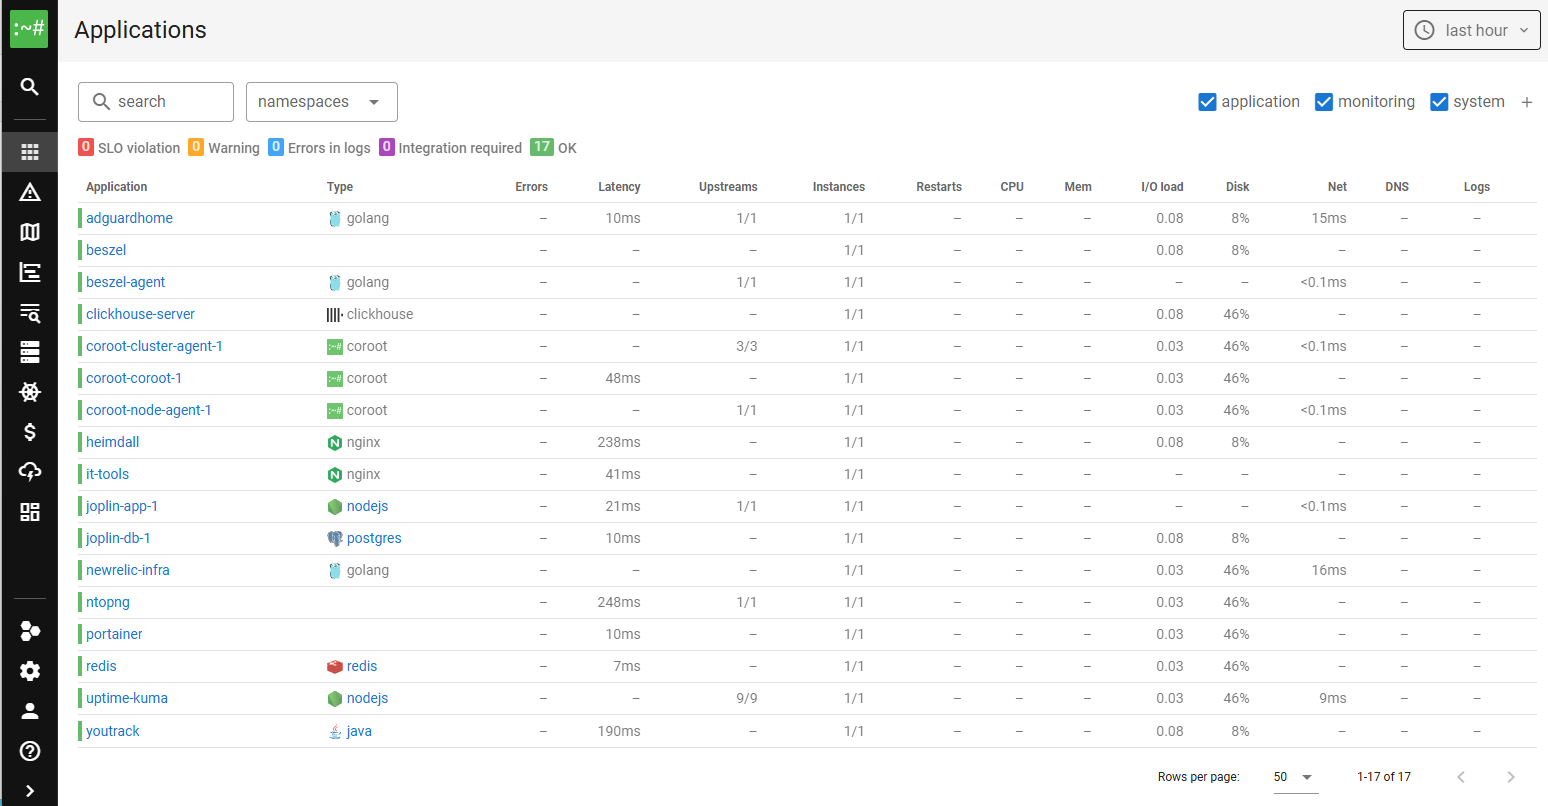
In my current setup on a Rocky Linux 9.x system, Coroot runs on a Clickhouse server to store metrics, logs, traces and profiles, in addition to the Coroot node-agent and Coroot cluster-agent. The Coroot node-agent automatically collects all service metrics and logs using eBPF, while the cluster-agent provides detailed information on databases like MySQL, Postgres or Redis.
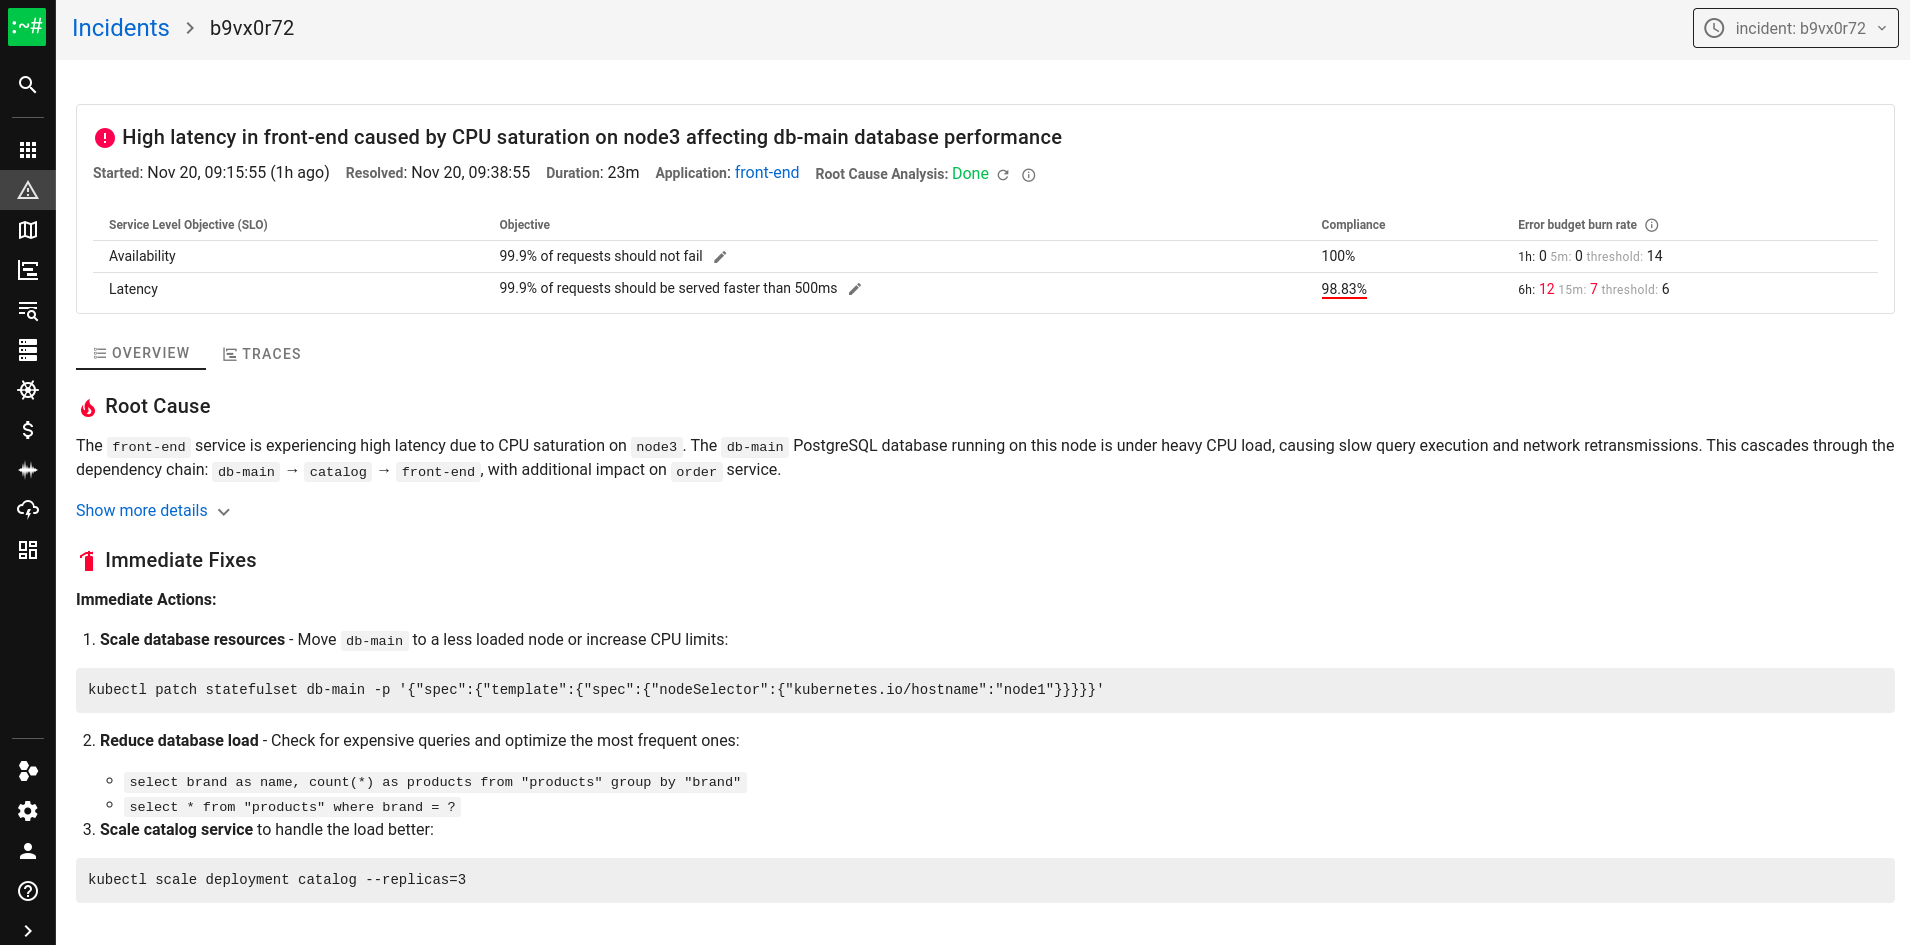
Another advantage Coroot presents is the use of AI-powered Root Cause Analysis, which provides instantaneous and helpful insights for investigating incidents. With a Coroot Enterprise, you will have ten helpful analyses for free each month. Even without AI, the data presented with Coroot with standard alerts based on best metric practices is pretty insightful and helps to make your setup even better.
Coroot services run in docker through a docker-compose file. In a normal Coroot setup Prometheus is used, but in this setup I have configured Clickhouse, which is a supported alternative.
Clickhouse as a Local Service
I have Clickhouse running as a local service. This setup allows for better control and convenience when scaling down memory usage of Clickhouse, scaling down logging on disk and the database, and simplifies making changes to the data. The only downside to note is this setup requires updating Clickhouse manually with yum/dnf.
Installing Clickhouse
Installing Clickhouse is easily achieved by adding the repo, installing Clickhouse, and making a few quick adjustments before starting it up.
sudo dnf install -y yum-utils
sudo dnf-config-manager --add-repo https://packages.clickhouse.com/rpm/clickhouse.repo

sudo dnf install -y clickhouse-server clickhouse-client
Before starting the service create file /etc/clickhouse-server/config.d/z_log_disable.xml and insert the following content in the file:
<?xml version="1.0"?>
<clickhouse>
  <asynchronous_metric_log remove="1"/>
  <metric_log remove="1"/>
  <latency_log remove="1"/>
  <query_thread_log remove="1"/>
  <query_log remove="1"/>
  <query_views_log remove="1"/>
  <part_log remove="1"/>
  <session_log remove="1"/>
  <text_log remove="1"/>
  <trace_log remove="1"/>
  <crash_log remove="1"/>
  <opentelemetry_span_log remove="1"/>
  <zookeeper_log remove="1"/>
</clickhouse>
After this adjust cache sizes in /etc/clickhouse-server/config.xml:
<mark_cache_size>268435456</mark_cache_size>
<index_mark_cache_size>67108864</index_mark_cache_size>
<uncompressed_cache_size>16777216</uncompressed_cache_size>
Adjust memory usage ratio in /etc/clickhouse-server/config.xml:
<max_server_memory_usage_to_ram_ratio>0.75</max_server_memory_usage_to_ram_ratio>
Lower the tread pool size in /etc/clickhouse-server/config.xml:
<max_thread_pool_size>10000</max_thread_pool_size>
And starting things up:
sudo systemctl deamon-reload
sudo systemctl enable clickhouse-server
sudo systemctl start clickhouse-server
Installing Coroot
First, check if your Linux system is using kernel 5.1 or later (although 4.2 is also supported.) This installation is different from the original docker-compose file.
Prometheus is not used in this setup, and Clickhouse runs as a local service. Another distinction is the retention of the data, which is normally set to seven days for traces, logs, profiles and metrics. Coroot also typically stores its own local cache for metrics for 30 days.
In this setup, the data retention stored in Clickhouse is set up for 14 days. With eighteen local and docker services, the amount of data kept for all of this is 3GB on average in my system.
Coroot, its node-agent, and cluster-agent, run as a docker service with a docker-compose that you create locally. This is achieved by inserting the following content in a locally created docker-compose.yaml:
name: coroot

volumes:
  node_agent_data: {}
  cluster_agent_data: {}
  coroot_data: {}

services:
  coroot:
    restart: always
    image: ghcr.io/coroot/coroot${LICENSE_KEY:+-ee}
    pull_policy: always
    user: root
    volumes:
      - coroot_data:/data
    ports:
      - 8080:8080
    command:
      - '--data-dir=/data'
      - '--bootstrap-refresh-interval=15s'
      - '--bootstrap-clickhouse-address=127.0.0.1:9000'
      - '--bootstrap-prometheus-url=http://127.0.0.1:9090'
      - '--global-prometheus-use-clickhouse'
      - '--global-prometheus-url=http://127.0.0.1:9090'
      - '--global-refresh-interval=15s'
      - '--cache-ttl=31d'
      - '--traces-ttl=21d'
      - '--logs-ttl=21d'
      - '--profiles-ttl=21d'
      - '--metrics-ttl=21d'
    environment:
      - LICENSE_KEY=${LICENSE_KEY:-}
      - GLOBAL_PROMETHEUS_USE_CLICKHOUSE
      - CLICKHOUSE_SPACE_MANAGER_USAGE_THRESHOLD=75
      - CLICKHOUSE_SPACE_MANAGER_MIN_PARTITIONS=2
    network_mode: host

  node-agent:
    restart: always
    image: ghcr.io/coroot/coroot-node-agent
    pull_policy: always
    privileged: true
    pid: "host"
    volumes:
      - /sys/kernel/tracing:/sys/kernel/tracing
      - /sys/kernel/debug:/sys/kernel/debug
      - /sys/fs/cgroup:/host/sys/fs/cgroup
      - node_agent_data:/data
    command:
      - '--collector-endpoint=http://192.168.1.160:8080'
      - '--cgroupfs-root=/host/sys/fs/cgroup'
      - '--wal-dir=/data'

  cluster-agent:
    restart: always
    image: ghcr.io/coroot/coroot-cluster-agent
    pull_policy: always
    volumes:
      - cluster_agent_data:/data
    command:
      - '--coroot-url=http://192.168.1.160:8080'
      - '--metrics-scrape-interval=15s'
      - '--metrics-wal-dir=/data'
    depends_on:
      - coroot
After creating this file and making any adjustments to your own likings and network preferences, type docker compose up -d and go to your IP address on port 8080. Here you have access to Coroot, and are now prompted to give admin credentials!
In my setup, Watchtower takes care of updating docker containers, which works great with Coroot.
As a final sidenote: there are already some helpful hints and pointers present within Coroot for setting things up. In my case, there was information available that helped observe a Postgres database. Don’t forget to use the given commands as the admin/postgres user to make it work.
For more details, you can check out the Coroot Docs – and if you like the tool, leave them a star on Github.
Happy observability 🙂