If you look at typical Application interaction with service point it tends to happen in two stages – first we connect to the Service and when we are interfacing through that established connection.
In this description though one thing stays invisible – you can’t simply connect to the Service through the hostname – that host name needs to be resolved into an IP address, and if this name resolution process does not work or does not perform, the application suffers.
So how does such a host name to IP resolution process work? There are basically two ways – you provide a static name to host mapping, i.e. through /etc/hosts file, which is very fast and reliable, but of course does not scale, or you can rely on DNS (Domain Name System) to resolve host names into addresses.
In environments which rely on DNS for name resolution for some of the services, which is the majority of environments, it is mission critical, as if it goes down or malfunctioning many things break.
DNS Latency is added latency for many type user faced requests, such as HTTP but it can easily remain unseen when only performance of actual HTTP request latency is measured.
Even though DNS is mission critical it is often not covered very well by Observability platforms, which tend to focus on the interactions after connection was established. Coroot was no exception… That is until now!
DNS Observability in Coroot
Coroot 1.1.0 introduces DNS Monitoring features finally allowing you to easily discover and troubleshoot DNS issues in your environment.
What problems do you want your DNS Observability solution to help you to discover? First of course it is failures in DNS resolutions – both DNS Timeouts and other errors, which often point to DNS system malfunction. Second is DNS Latency – if DNS is slow this will impact connections which require DNS resolution, rather than rely on cached values.
Finally there are DNS NXDOMAIN Errors, which are a special kind of Errors, which may correspond to Application configuration issue – attempting to resolve wrong hostname as well, DNS system malfunctioning or service availability issues. For example it happens when Kubernetes headless service has no ready endpoints.
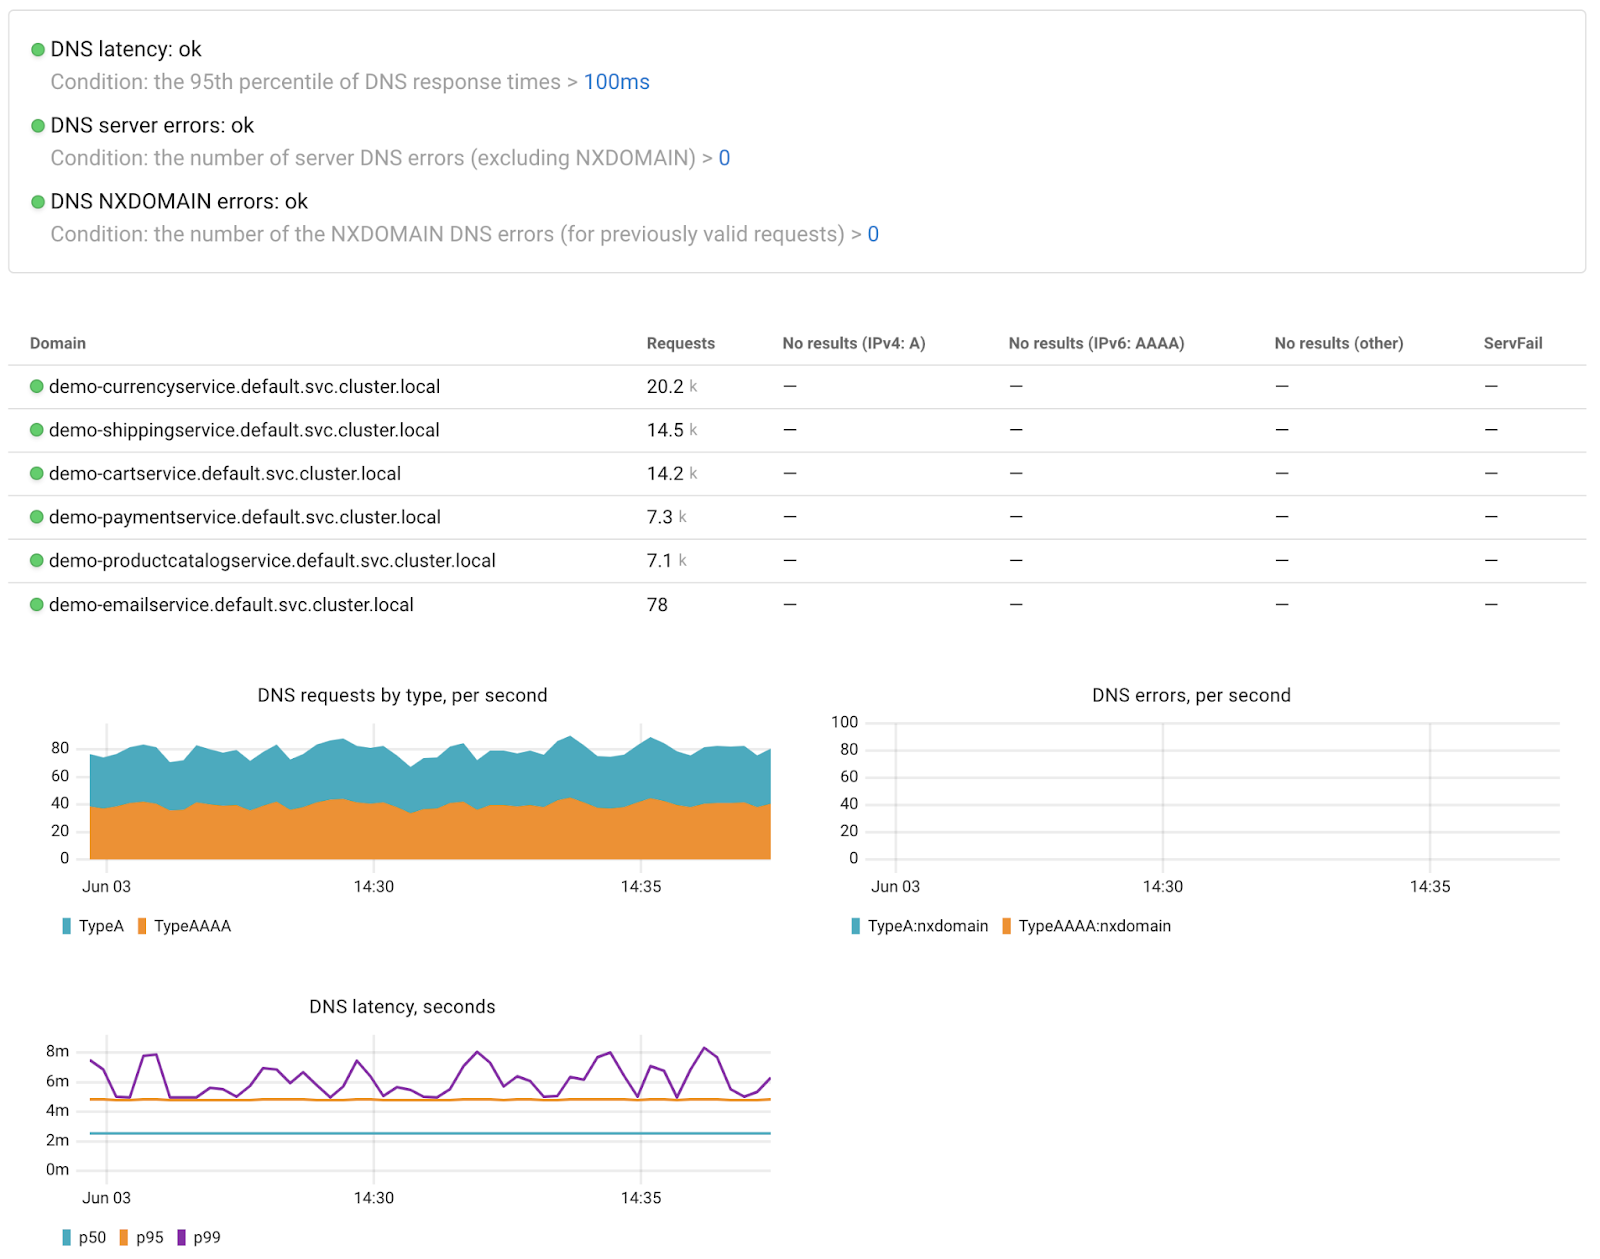
Coroot goes well beyond providing overall DNS Observability, allowing you to drill down for deeper insight. For example you can see breakdown by type of request – whenever it is A Record (IPv4) or AAAA Record request (IPv6). What kind of DNS name resolution requests application is performing and which of them are failing.
Application specific drill down can be particularly interesting – let’s look at MongoDB service for example:
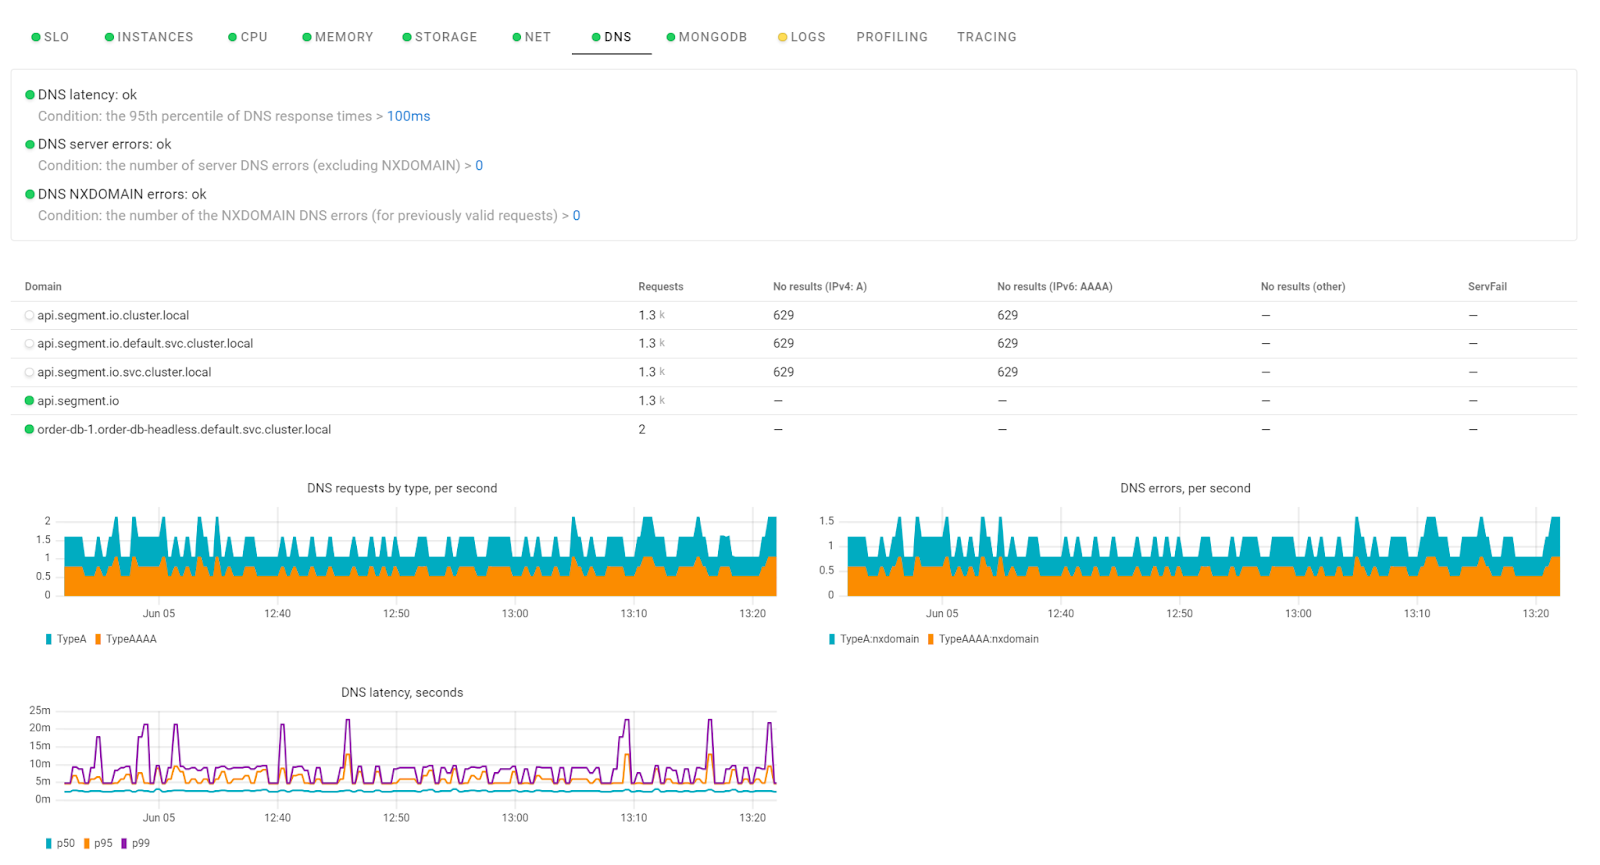
We can see MongoDB makes unexpected DNS resolution requests to api.segment.io, I assume to report some usage information, which might be unexpected and wanted, but clearly visible with Coroot observability.
Next we can see MongoDB actually performs a series of failing (with NXDOMAIN) DNS requests, before it finds one which resolves successfully. Coroot is able to both discover such behavior, which would be unwanted for latency sensitive operations but also has DNS Monitoring smart enough to mask those errors (note DNS is marked as operating properly for this service). This is because Coroot only reports the problem if the hostname was resolving successfully through DNS but does not any more.
Takeaways
First, I hope I convinced you that DNS Observability is important and you should invest in proper DNS Monitoring unless you have done so already to ensure it is not a blindspot in your observability setup. While you’re at it – consider Coroot which has in-depth eBPF based DNS Observability and a number of other features allowing you to enable outstanding end to end application Observability without need to change code and without breaking a bank.


