In one of my previous posts, we looked at how a high-availability Postgres cluster managed by the Zalando Postgres Operator handles various failure scenarios. Now, let’s repeat similar experiments against a cluster managed by StackGres.
A brief introduction to StackGres
StackGres is an open-source Kubernetes Postgres Operator that not only enables you to create a production-ready Postgres cluster on any Kubernetes cluster but also automates “Day 2” operations, including high availability, backups, and minor/major Postgres upgrades.
At first glance, many Postgres Operators may appear to be similar, offering a common set of features like high availability with Patroni and connection pooling with PgBouncer. However, in my opinion, each operator reflects the best practices and approaches of the team that created it.
For instance, chatting with the Zalando folks about their operator, they told me that their primary goal was to enable development teams to autonomously create and manage small databases without requiring the assistance of a DBA.
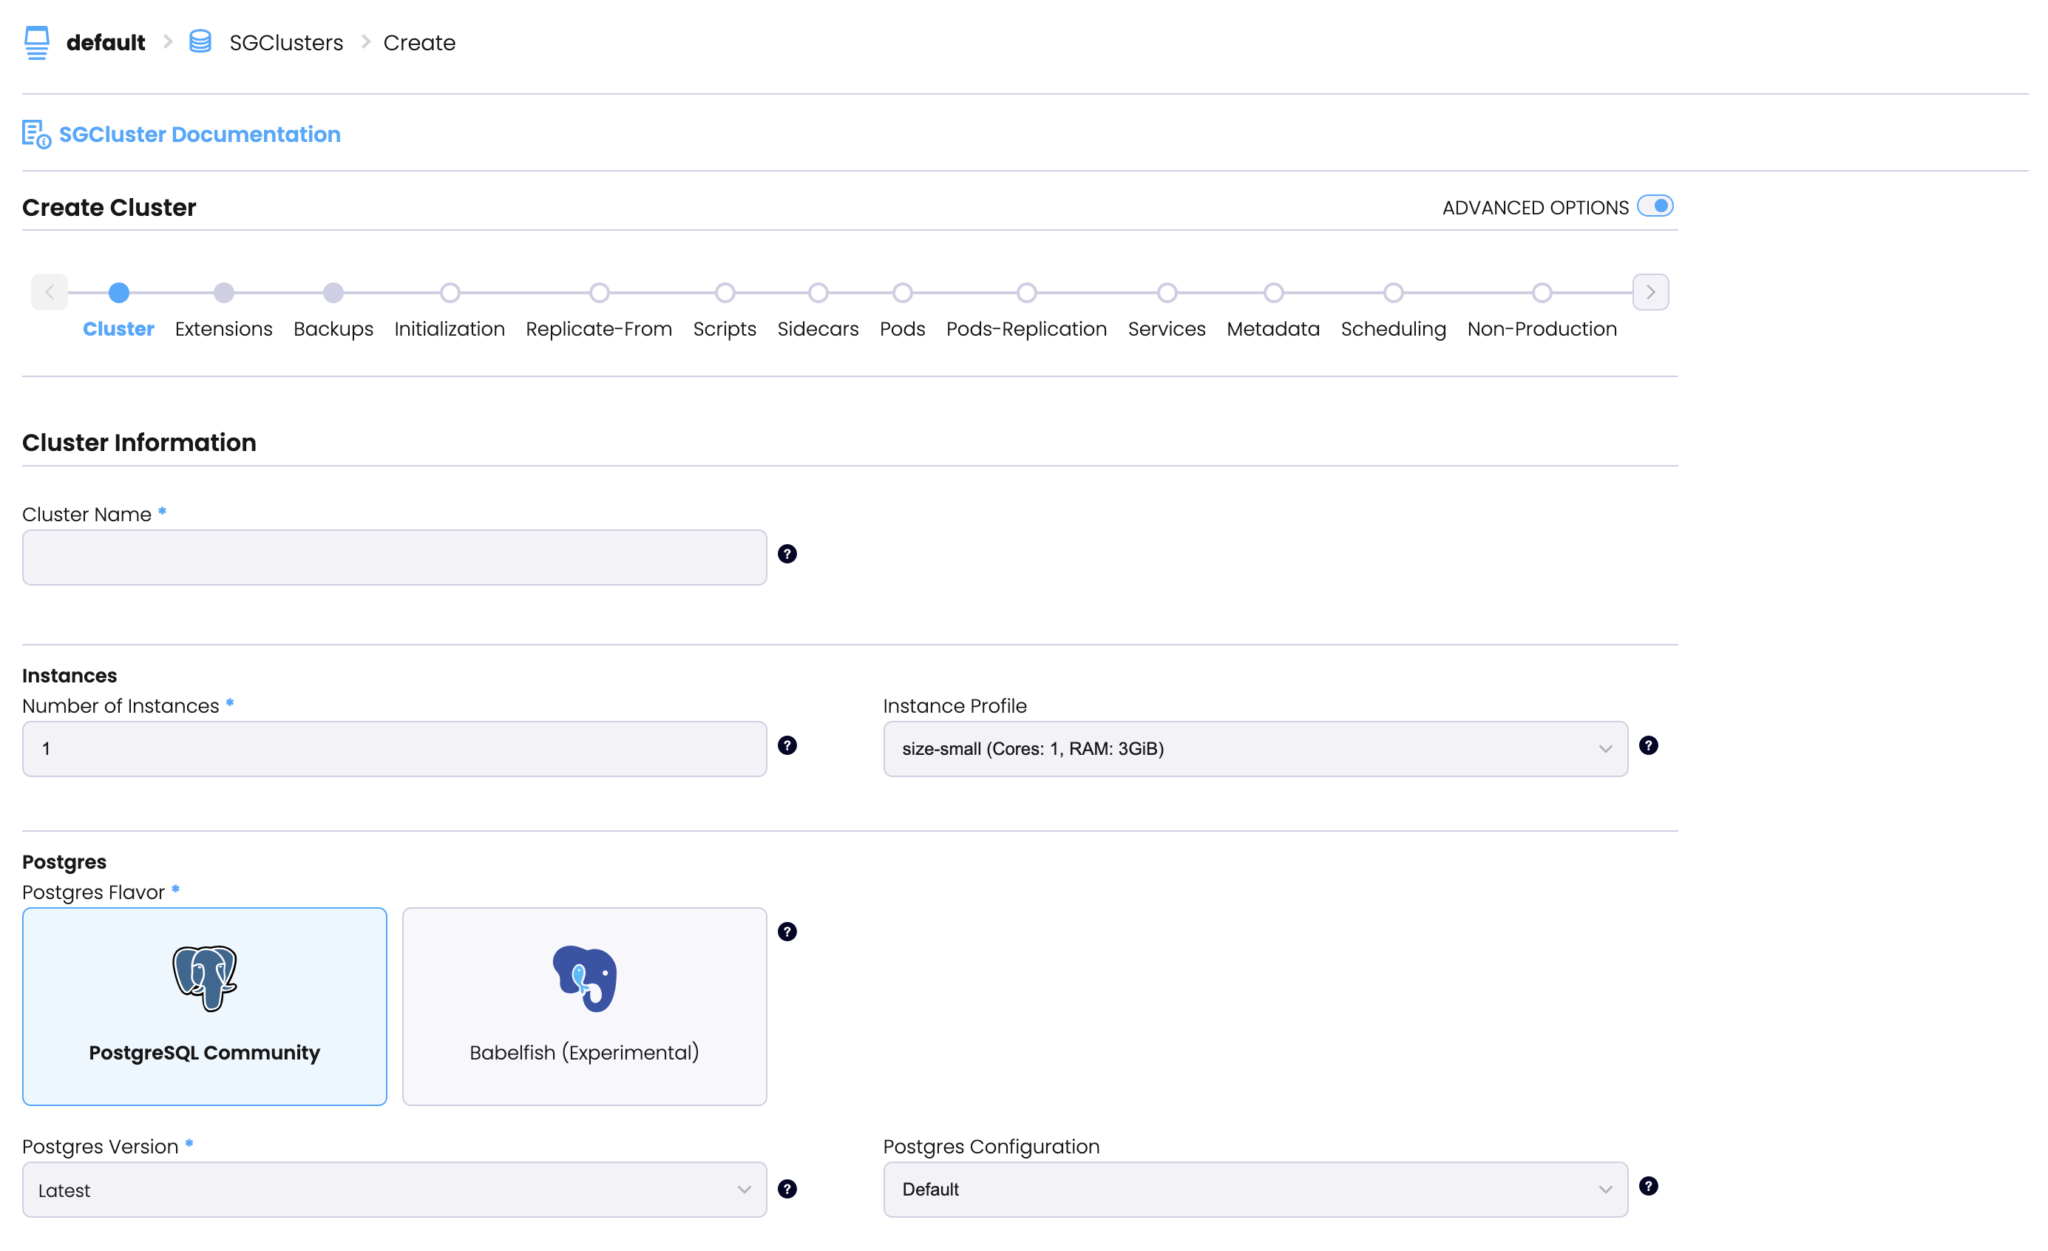
I don’t know the story behind StackGres, but it seems to me like its developers aim to offer a user experience similar to that of AWS RDS. For example, StackGres offers a user-friendly UI enabling you to create your first cluster in just minutes.
Now, that we’ve got a general idea of StackGres, let’s do some chaos testing.
Setting up the environment
My lab is a k3s cluster with 3 nodes (4xCPU/8Gb).
To install the StackGres operator I used the following Helm commands:
helm repo add stackgres-charts https://stackgres.io/downloads/stackgres-k8s/stackgres/helm/
helm repo update
helm install --create-namespace --namespace stackgres stackgres-operator stackgres-charts/stackgres-operator
The Postgres cluster spec:
kind: SGInstanceProfile
metadata:
  namespace: default
  name: size-small
spec:
  cpu: "2"
  memory: "4Gi"
---
apiVersion: stackgres.io/v1
kind: SGCluster
metadata:
  namespace: default
  name: db-main
spec:
  postgres:
    version: '15'
  sgInstanceProfile: 'size-small'
  instances: 3
  metadata:
    annotations:
      clusterPods:
        prometheus.io/port: "9090"
        prometheus.io/scrape: "true"
  pods:
    persistentVolume:
      size: '10Gi'
    customContainers:
      - name: coroot-pg-agent
        image: ghcr.io/coroot/coroot-pg-agent:1.2.4
        volumeMounts:
          - mountPath: /var/run/postgresql
            name: socket
        env:
          - name: LISTEN
            value: ":9090"
          - name: DSN
            value: "postgresql://postgres@:5432/postgres?host=/var/run/postgresql&sslmode=disable"
The cluster will be created once the manifest is applied:
kubectl apply -f pg.yaml
While StackGres offers built-in monitoring with Prometheus and Grafana, I believe it’s crucial to have a comprehensive view that includes metrics from both the database and the applications utilizing it. As you might have guessed, I’ll be using Coroot for this purpose 😉
helm repo add coroot https://coroot.github.io/helm-charts
helm repo update
helm install --namespace coroot --create-namespace coroot coroot/coroot
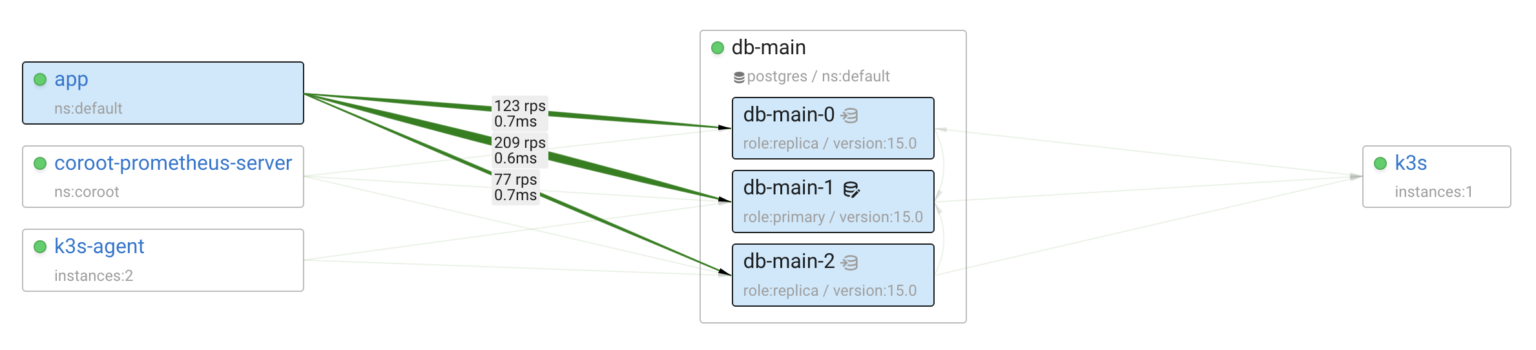
Now, let’s take a look at the Postgres cluster:
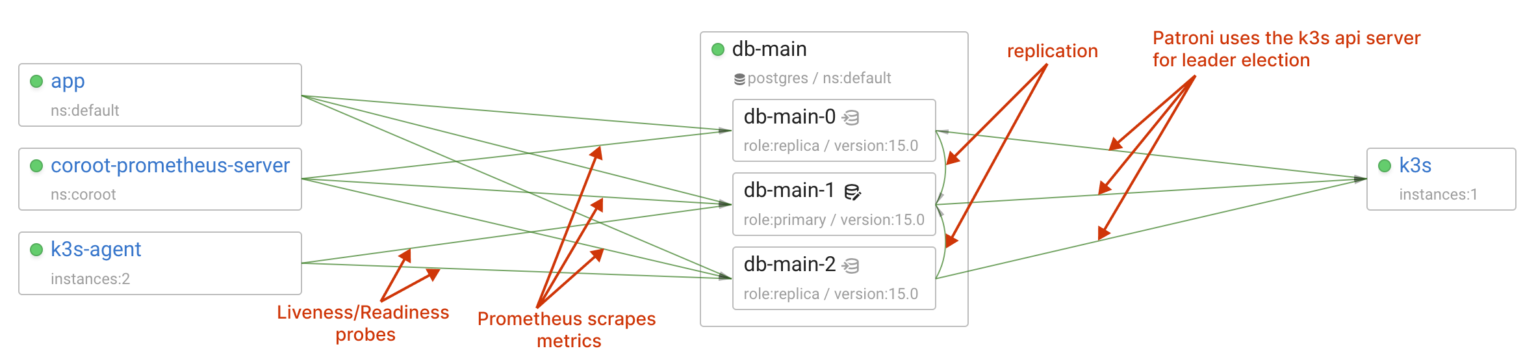
Visualizing distributed systems is incredibly useful for comprehending a system’s design. Coroot leverages eBPF to capture interactions between services, eliminating the need for additional instrumentation while ensuring complete coverage without blind spots. Furthermore, it can analyze a wide range of application layer protocols, including Postgres, to provide insights into query statuses and latency.
Since I’ve already configured StackGres to run coroot-pg-agent as a custom sidecar container, Coroot is now collecting comprehensive Postgres metrics from every instance in the cluster.
The final component is Chaos Mesh which makes it easy to reproduce various failure scenarios.
helm repo add chaos-mesh https://charts.chaos-mesh.org
helm repo update
helm install chaos-mesh chaos-mesh/chaos-mesh
    -n=chaos-mesh --create-namespace
    --set chaosDaemon.runtime=containerd
    --set chaosDaemon.socketPath=/run/k3s/containerd/containerd.sock
    --version 2.6.2
Ok, we’re all set. Let’s introduce some chaos 🔥
A replica failure
My demo app uses both the primary Postgres instance and its replicas. Let’s see what happens if one of the replicas goes down.
We could simply delete the Kubernetes pod containing the replica, but the system would quickly detect this situation. To make things more challenging, I’ll isolate the replica from the network.

kind: NetworkChaos
apiVersion: chaos-mesh.org/v1alpha1
metadata:
  name: replica-net-partition
spec:
  selector:
    namespaces: [default]
    labelSelectors:
      stackgres.io/cluster-name: db-main
      role: replica
  mode: one
  action: partition
  direction: both
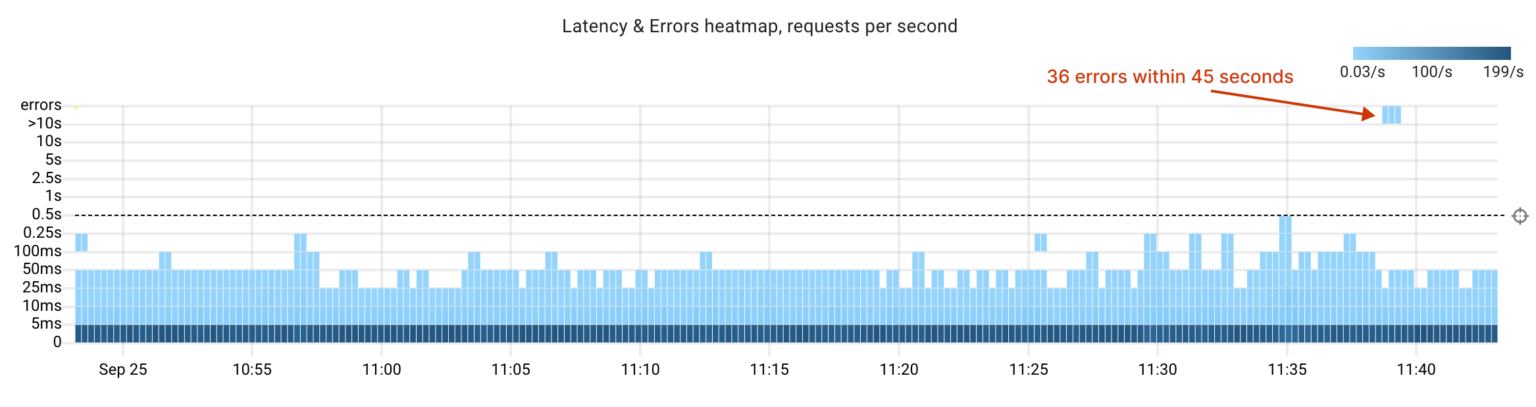
First, let’s examine this failure from the application’s perspective. There were approximately 30 errors caused by unsuccessful TCP connections between the application and the affected Postgres replica.
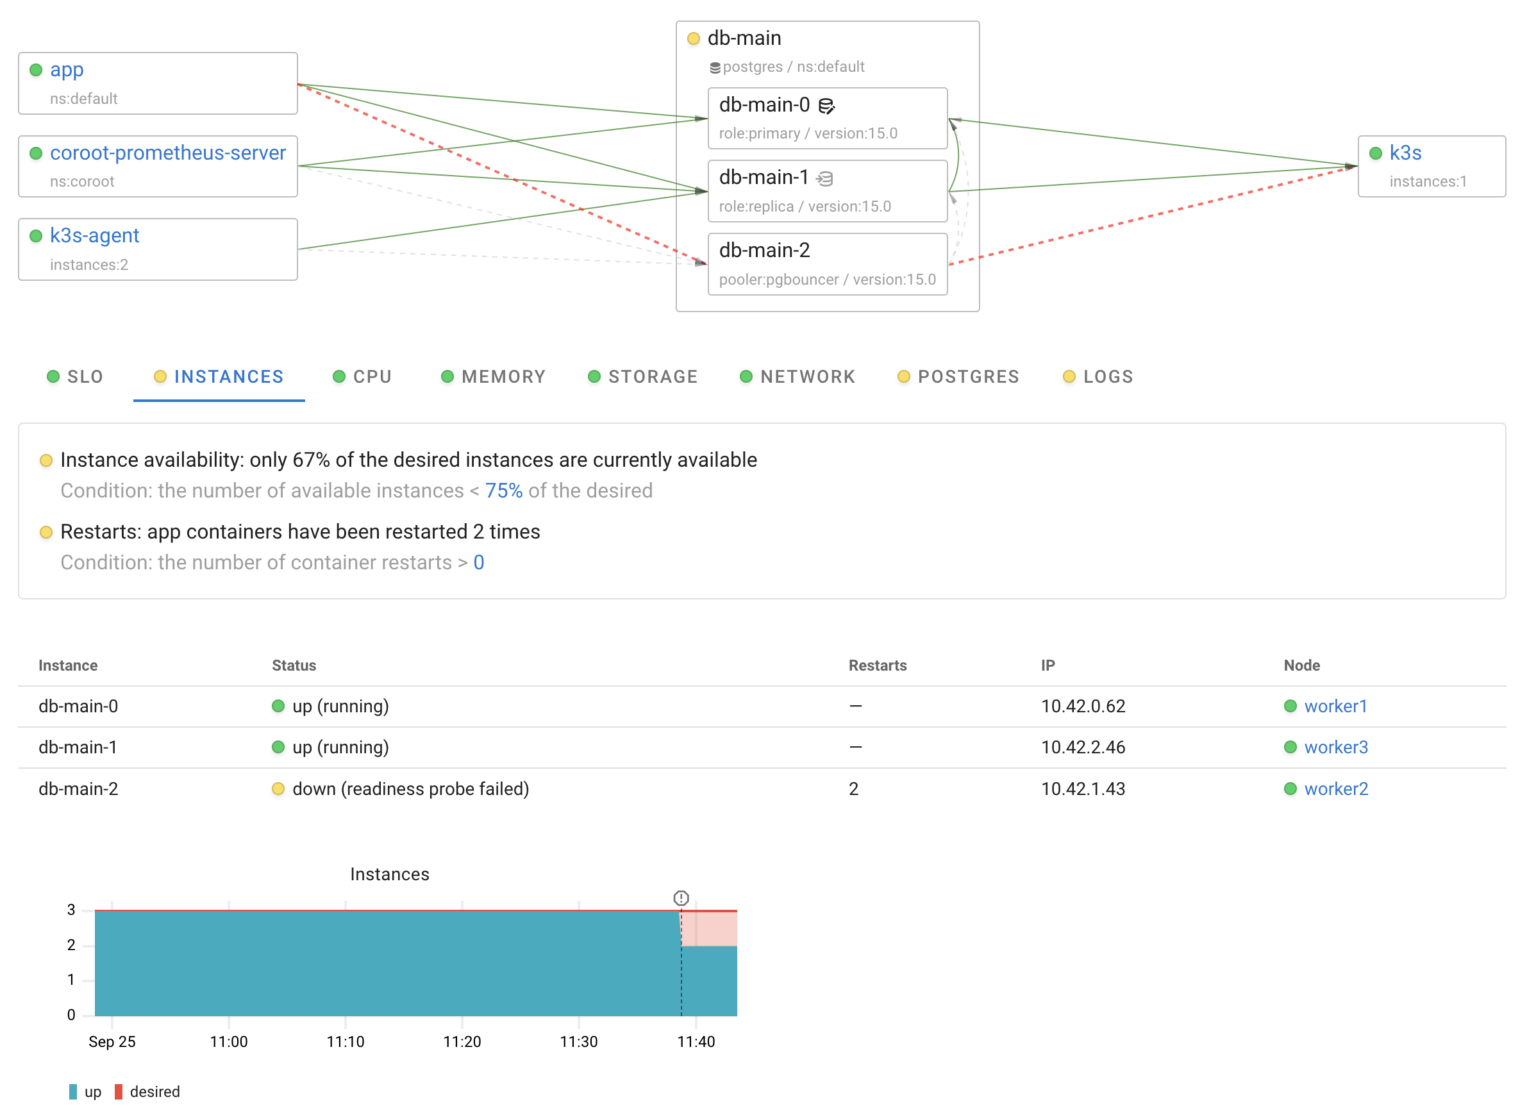
In summary, this failure scenario was promptly and automatically resolved:
- Patroni detected the disconnection from the API server.
- Kubernetes removed the affected instance from the available endpoints due to failed readiness probes, and app traffic was subsequently rebalanced across the remaining live replica and the primary
A failure of the primary instance
Clearly, if the primary Postgres instance fails, it will impact its clients, as write queries cannot be redistributed among the read-only replicas.

kind: NetworkChaos
apiVersion: chaos-mesh.org/v1alpha1
metadata:
  name: replica-net-partition
spec:
  selector:
    namespaces: [default]
    labelSelectors:
      stackgres.io/cluster-name: db-main
      role: master
  mode: one
  action: partition
  direction: both
Handling a primary server failure is a complex process because, in addition to switchover, it involves tasks such as reconfiguring replication and running VACUUM ANALYZE on the new primary. These tasks can degrade database performance due to increased CPU and I/O usage, as well as the need for cache warm-up.
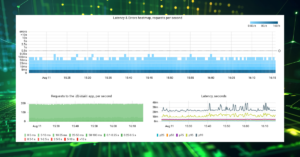
To provide you with an overview of the system’s behavior during this failure, I’ll use Coroot’s Automated RCA (Root Cause Analysis) feature. It’s designed to pinpoint all the relevant events within the cluster that might have affected the application. Therefore, I’ve selected the anomalies in the app’s latency and errors and requested Coroot to explain them for me:
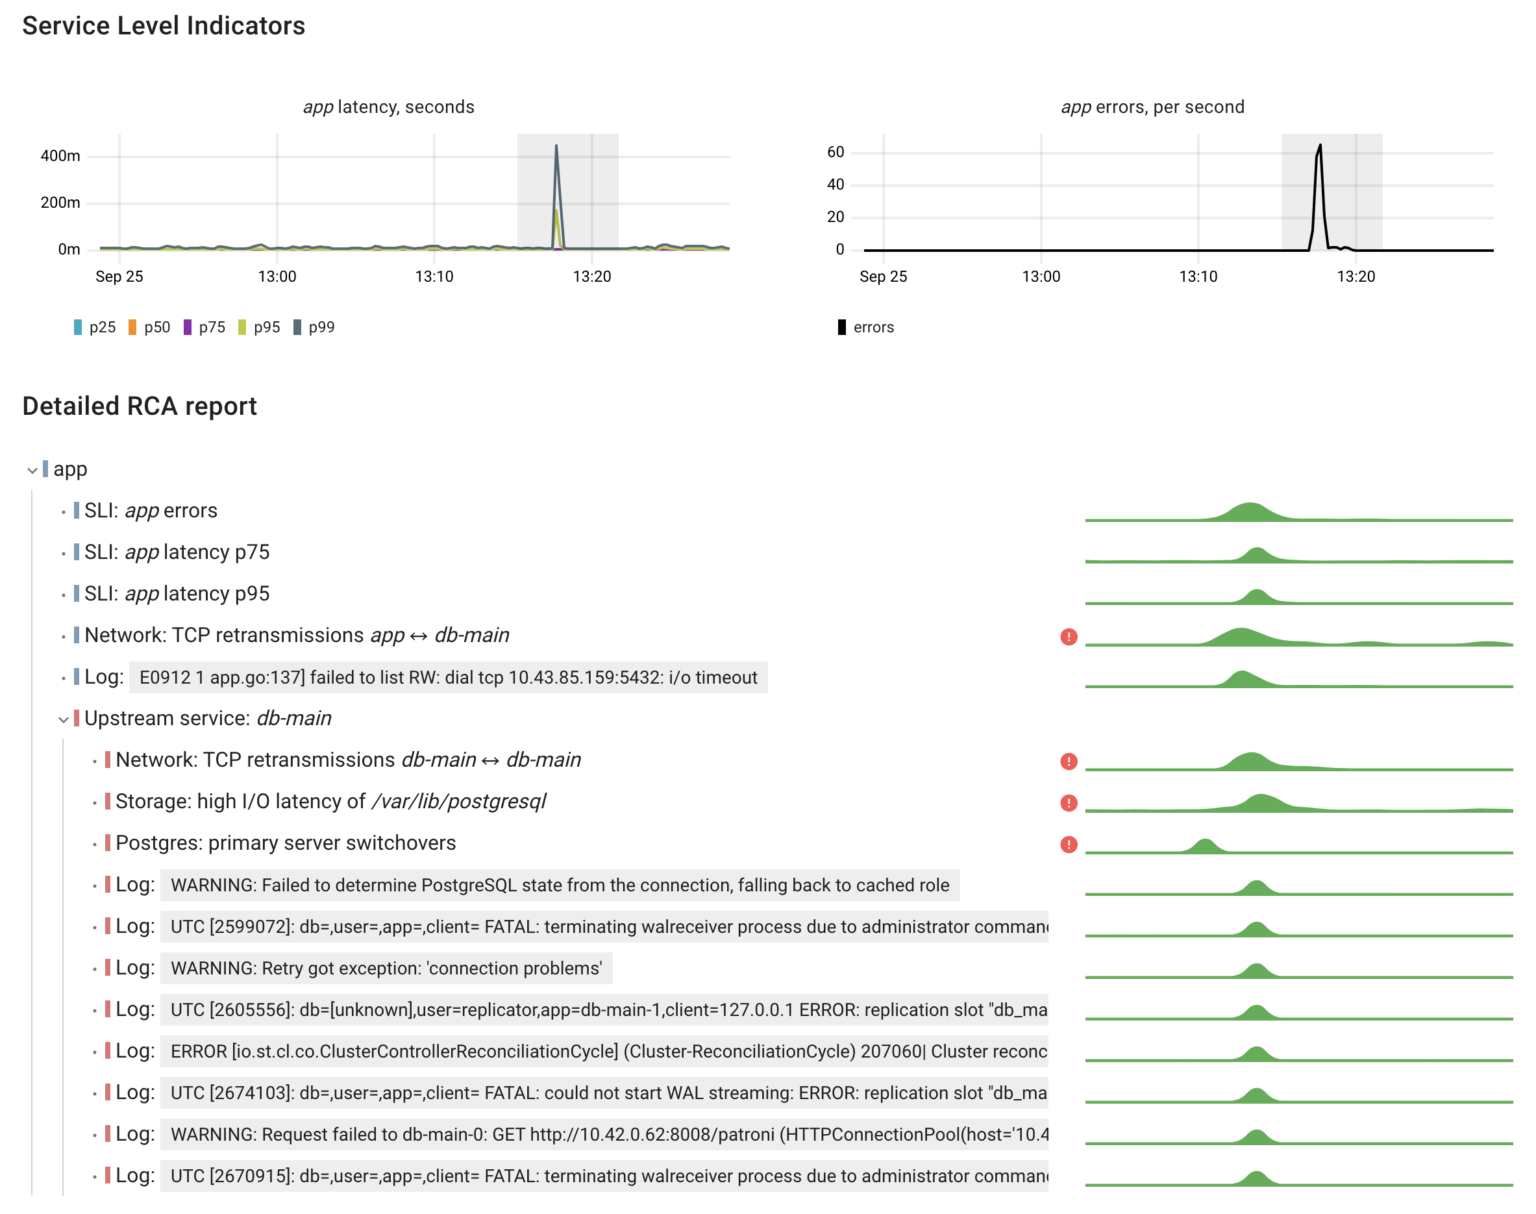
Let’s analyze this report:
- The network connectivity issue was identified through an increase in TCP retransmissions.
- A switchover occurred in the DB cluster, leading to application errors.
- Following the switchover, we observed high I/O latency on the Postgres data volume, which in turn caused elevated query latency.
In total, this incident resulted in ~2500 app errors within 3 minutes.
Conclusion
After our experiments, we can confidently say that StackGres and its underlying components effectively handle failures in the cluster.
As for my experience with StackGres, it was pleasantly surprising. What I liked most was its user interface and how the operator enables you to schedule and monitor Database Operations, including minor/major upgrades, vacuuming, and repacking.
When it comes to monitoring, it’s great that StackGres offers built-in Postgres monitoring capabilities. However, in shared infrastructures like Kubernetes, it’s essential to have a broader view — seeing all the applications, understanding their interactions, and monitoring shared compute resource usage.
Coroot can help you achieve this by providing comprehensive observability across the entire cluster. StackGres is supported out-of-the-box in both Coroot Cloud and Coroot Community Edition.
If you like Coroot, give us a ⭐ on GitHub️.
Any questions or feedback? Reach out to us on Slack.