We built AI-powered Root Cause Analysis that actually works
 Nikolay Sivko
Figuring out why things break still sucks. We’ve got all the data: metrics, logs, traces, but getting to the actual root cause still takes way too long. Observability tools show us everything, but they don’t really tell us what’s wrong.
So why do we even need to automate root cause analysis? First, time. Outages are expensive. And if your system has hundreds or thousands of services, digging through everything by hand just takes way too long.
Second, because of context size. Like with LLMs, context is always limited, and our brains just can’t hold that much at once. Systems keep getting more complex. You’ve got tons of services using different tech stacks, databases, cloud providers, regions – it’s a mess. In most companies, nobody really knows how the whole thing works anymore. That’s exactly why we need to automate this:
Okay, so we get it, we need to automate stuff. But how do you actually do that? That’s where things get interesting. Some folks think you can just dump all your observability data into an LLM and ask what went wrong. All you need is the right prompt, right?
Well… sort of. But here’s the catch: writing the “right prompt” basically means doing all the hard stuff yourself. Let’s break that down. What does it actually mean to find the root cause of an issue programmatically? Here’s how I see it:
- First, you collect a bunch of telemetry: metrics, logs, traces. Stuff that reflects how a complex distributed system is behaving
- Next, you teach a tool to make sense of it. For example: “This metric just spiked, that’s probably bad and might be causing latency or errors”
- You also need to teach it to see the bigger picture: services talking to each other, databases, infrastructure, the network, the cloud
- And finally, it has to connect the dots and actually find the root cause, the thing behind the SLO violation, like slow responses or failed requests
So yeah, technically you can ask an LLM to figure it out, but only after you’ve done all of that. That’s not just a prompt. That’s an entire root cause analysis. And that’s exactly what we built into Coroot Enterprise Edition.
We’re super excited to announce AI-based Root Cause Analysis in Coroot. It’s a big step toward making troubleshooting faster, easier, and way less painful.
And no, it’s not just another AI chat bot. We’re not trying to have a conversation, we’re here to pinpoint the root cause, whether it’s a major outage or a minor latency spike.
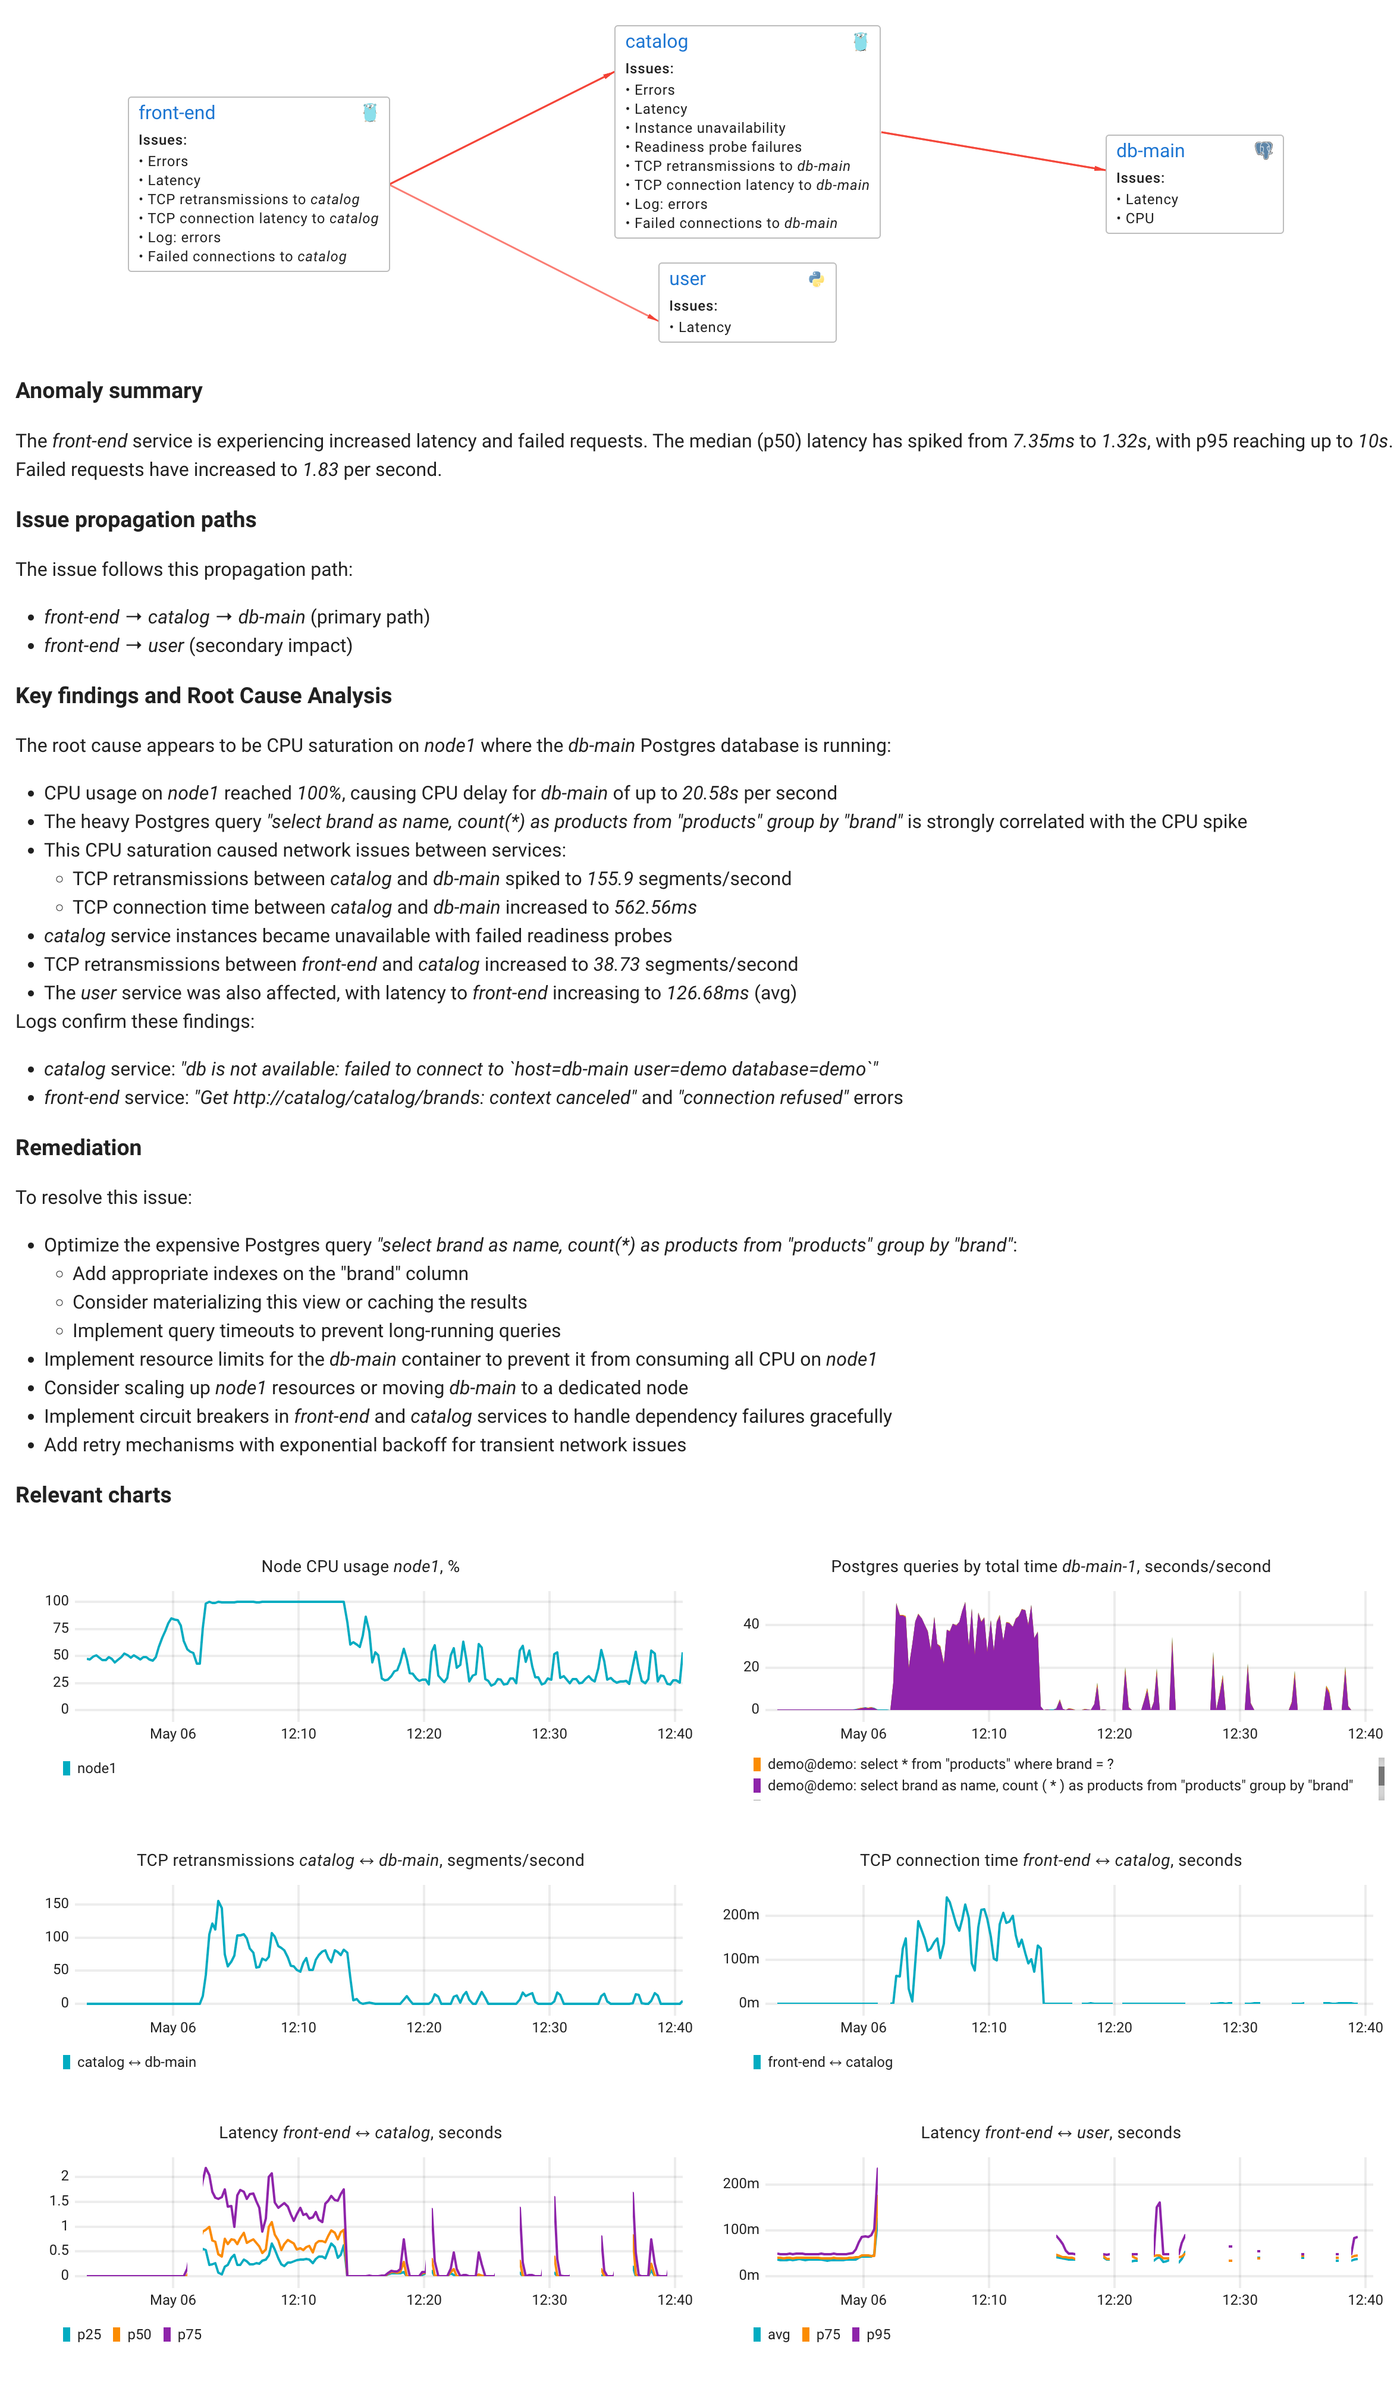
Let’s look at an example. Here, we’ve got a noticeable performance drop in the front-end service.

If I had to investigate this manually, I’d start by looking at the service itself, check its metrics, dig into the logs, maybe pull some profiles. Then I’d look at its dependencies, and their dependencies, and so on.
Or maybe I’d start from traces of affected requests, try to spot the slow or failing part, figure out which service is causing it, and then dive into its metrics, logs, and profiles to understand what’s going on.
Now let’s see what our AI-based Root Cause Analysis finds.

As you can see, Coroot behaves just like an experienced engineer, it walks through the dependency graph and analyzes all the available telemetry data. The difference is, it does it in seconds.
Pretty cool, right?
The explanation it generates might feel detailed or even a bit intense, but the issue itself was complex, so we’ve found this level of detail to be the sweet spot for effective troubleshooting.
Why it works
If you’ve been around observability for a while (like I have), you hear terms like AIOps thrown around constantly. And let’s be real, most of us see that as marketing fluff. Why? Because we’ve all tried “AI-powered” tools that rely on just a few basic metrics, logs, or Kubernetes events to magically find the root cause. Does that ever work? Maybe, but only for the most trivial issues.
At Coroot, we took a different path. We decided to start with the right data. That’s why we built our own eBPF-based agent to collect the telemetry we actually need, not just whatever the OS or app happens to expose. That’s also why we extract repeated patterns from logs and turn them into metrics so we can correlate them precisely with everything else.
And it doesn’t stop there. To make this kind of analysis possible, we focused on building Coroot as an on-prem product with flat pricing. No per-signal ingestion tax. Because to get a full picture, you need full telemetry. And we’re making that actually affordable.
How it works
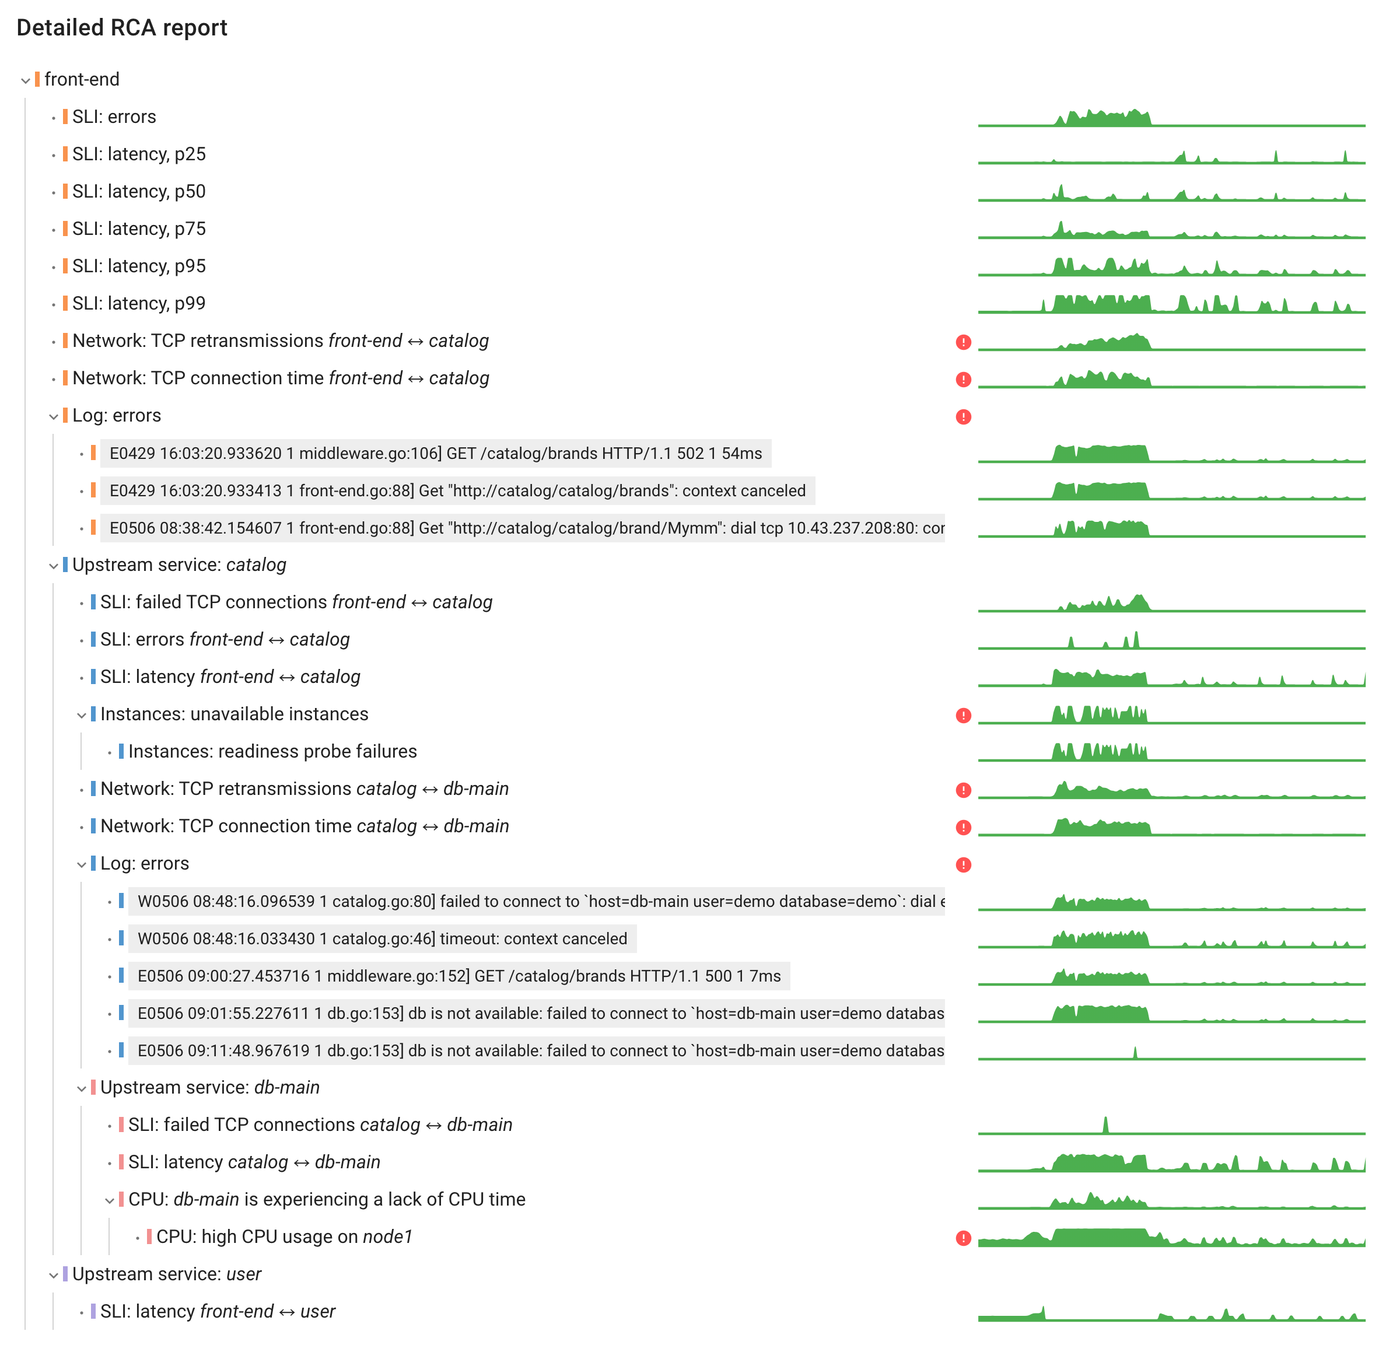
First, Coroot follows the dependency graph starting from the affected service. It works like an engineer, checking possible causes by comparing telemetry data with the detected anomaly. This step uses various machine learning techniques, but it doesn’t involve LLMs.
At this point, Coroot identifies the most likely root causes, relevant logs, and key signals that support each hypothesis.
That said, the output can still be pretty detailed and might take some effort to interpret. Without full context, it’s easy to get lost. For example, here’s what the intermediate analysis looked like for the example above.

In many cases, even experienced engineers end up searching through docs or community forums for answers. This is where the LLM steps in. Using the rich context collected by Coroot, it summarizes the findings and suggests possible fixes or next steps.
Coroot currently supports multiple LLM providers, but based on our tests, Claude 3.7 from Anthropic delivered the best results:
- Anthropic (Claude 3.7 Sonnet) – recommended, consistently gave the most accurate and useful answers
- OpenAI (GPT-4o)
- Any OpenAI-compatible API – including DeepSeek, Google Gemini, and others
Enterprise grade without enterprise prices
We built this to be useful for every team, not just companies with massive budgets. That’s why we made it actually affordable.
Coroot Enterprise starts at just $1 per CPU core per month, with no extra charges for metrics, logs, traces, or number of users. It’s simple, predictable pricing that lets you collect all the telemetry you need without holding back.
Because root cause analysis only works when you can see the full picture, and getting that visibility shouldn’t break the bank.
Try it out
AI-based Root Cause Analysis is available now in Coroot Enterprise. You can start your 2-week free trial at coroot.com/account.
No credit card required. No sales calls. Just install Coroot, connect your infrastructure, Kubernetes, VMs, or bare metal, and start getting real answers, not just charts.
It runs on-prem, collects the telemetry it needs out of the box, and takes just minutes to get going thanks to our lightweight eBPF-based agent.
Give it a try and see how fast you can go from “something’s wrong” to “here’s exactly why.”
