Coroot 1.11: What's New
 Nikolay Sivko
We’re excited to announce the release of Coroot 1.11! This version comes with powerful new features designed to give you more control over your observability data and make your troubleshooting process faster and more intuitive. Let’s dive into what’s new.
Cloud Costs Monitoring Improvements
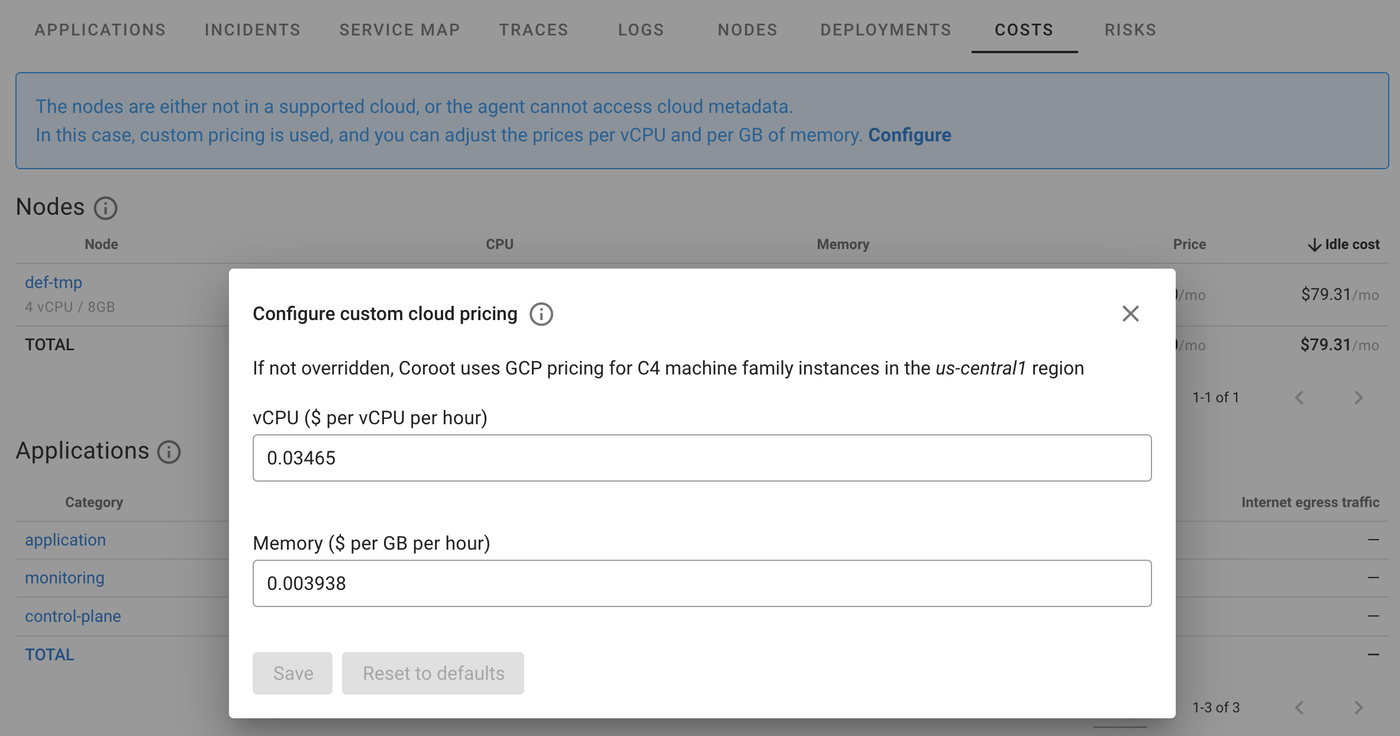
Before Coroot 1.11, cost calculation was supported only for AWS, GCP, and Azure. Now, you can use this feature even if you run on bare-metal servers. Just define the price per CPU core per hour and memory (GB per hour), and Coroot will calculate the cost for every app or a whole app category.
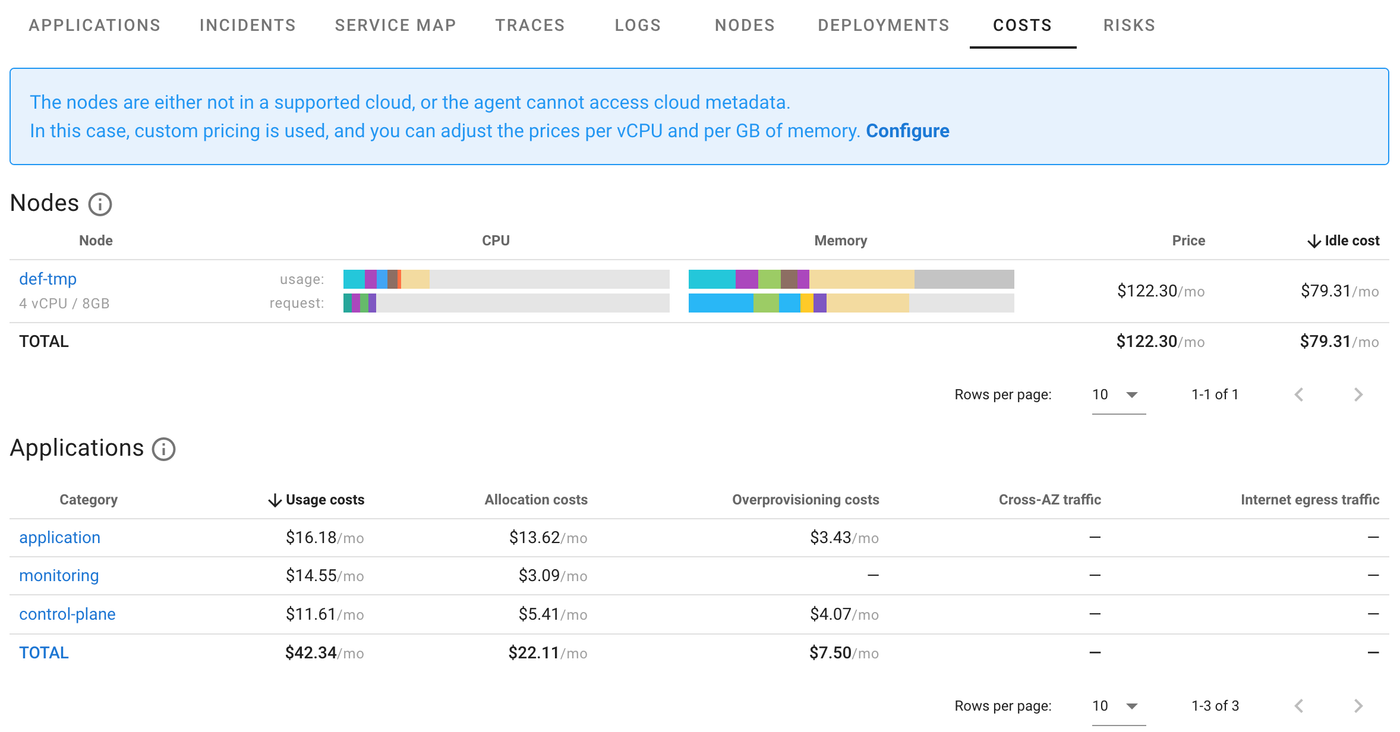
By default, Coroot uses the current GCP pricing model, but you can easily adjust it to match your specific environment. This flexibility makes Coroot a powerful tool for monitoring cloud costs, regardless of your setup.
It’s worth noting that the cost calculation feature has always been integrated into Coroot’s Deployment tracking. This means that whenever your application starts consuming more resources after a new release, Coroot will automatically estimate the impact on your cloud bill in dollars. With Coroot 1.11, this functionality now extends to bare-metal environments as well.
Log Monitoring Improvements
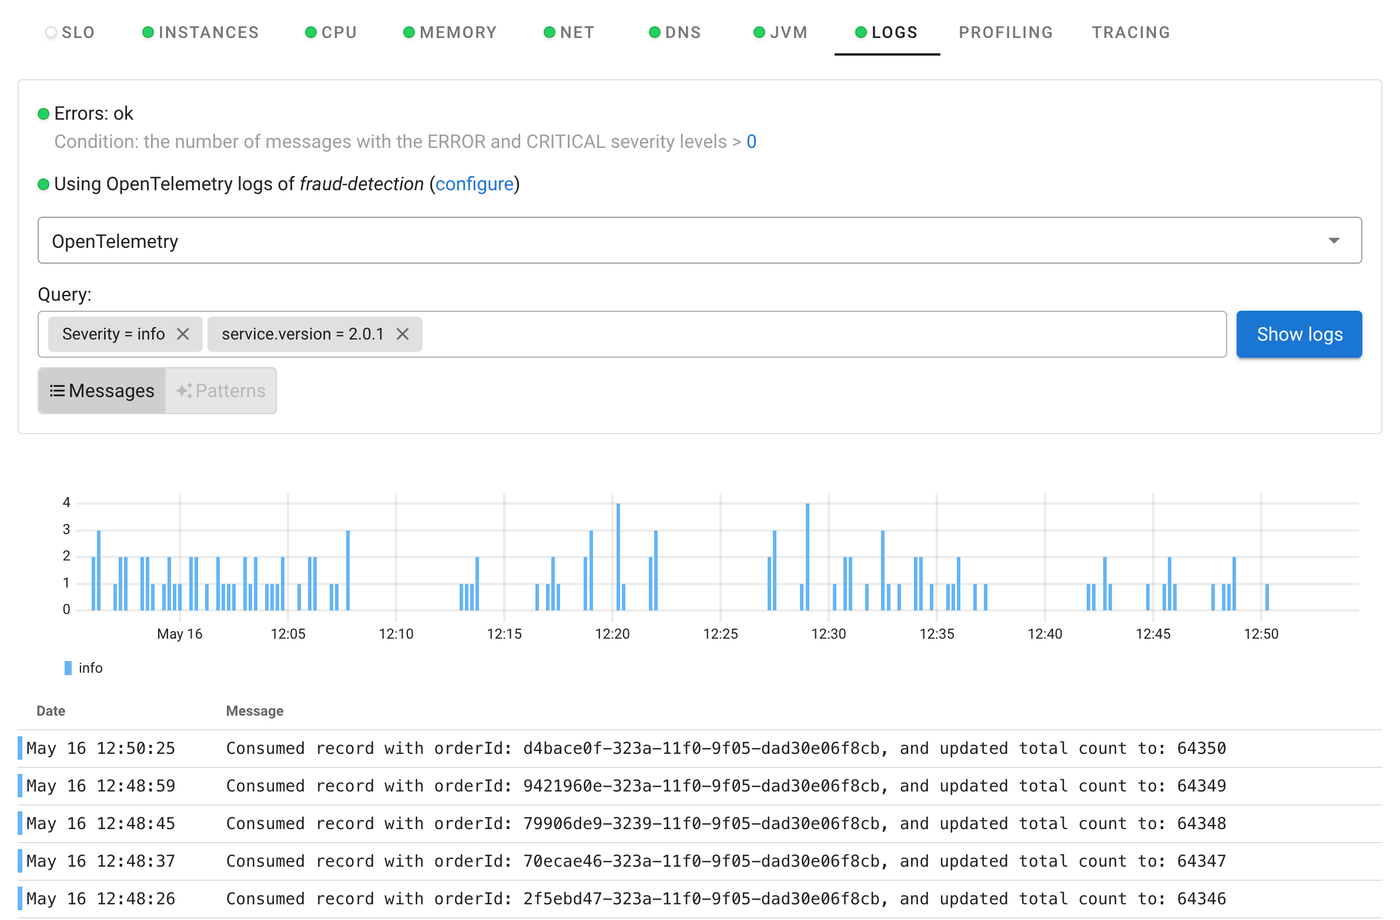
Coroot 1.11 makes working with logs much easier. You can now filter logs by custom attributes, allowing you to quickly find the exact information you’re looking for. Whether you need logs from a specific app or want to track down a problem, this feature saves you from sifting through irrelevant data.
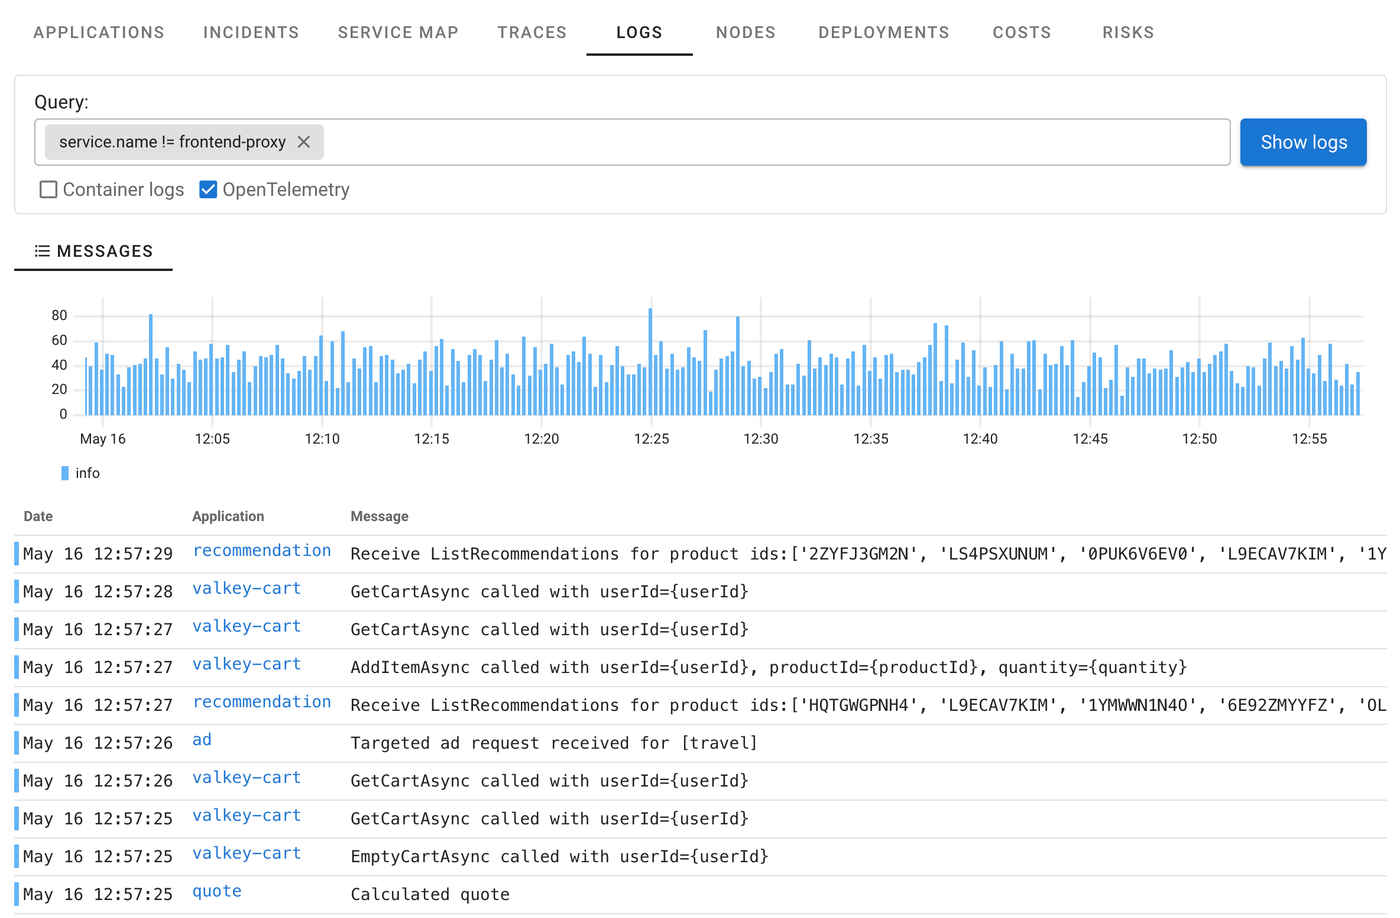
We’ve also added a project-level log explorer, which lets you see logs from all your apps in one place. No more switching between individual logs to get a complete picture—just open the explorer and dive into the data. It’s a game-changer for troubleshooting across multiple applications.
Trace-to-Log Correlation
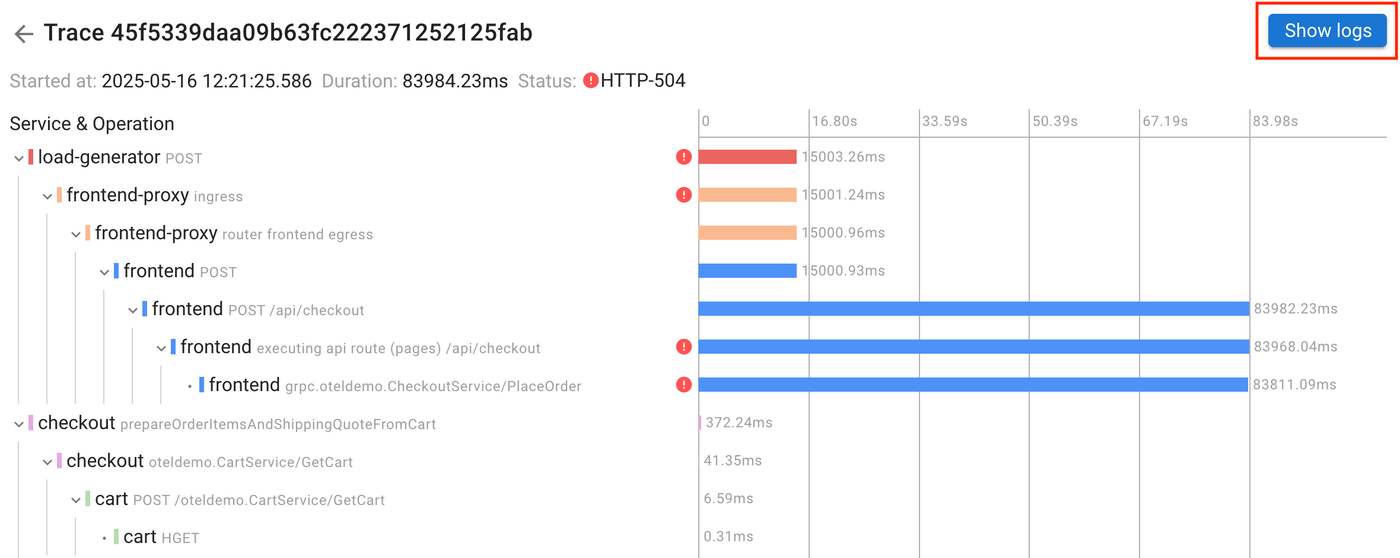
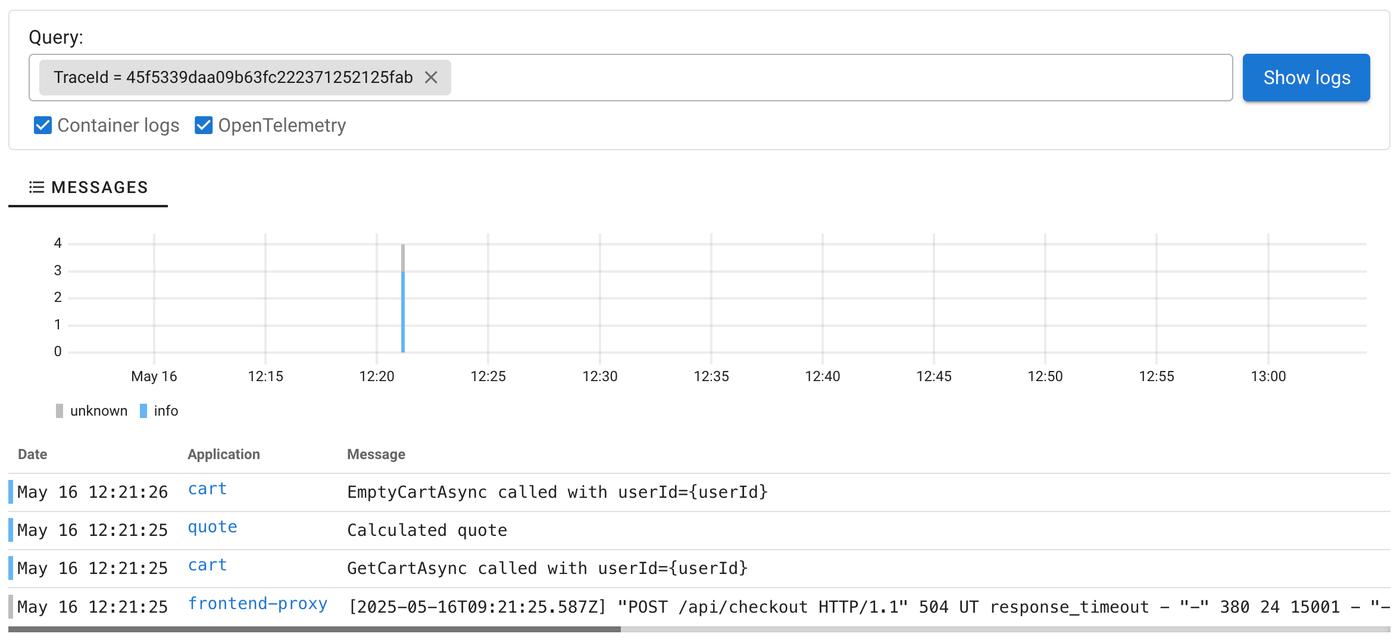
On top of that, we’ve introduced trace-to-log correlation. Now, with just one click on the Show logs button (as shown in the trace view), you can see all log messages associated with a specific trace. This makes it incredibly easy to track down root causes by seeing both trace data and related logs in one seamless flow.
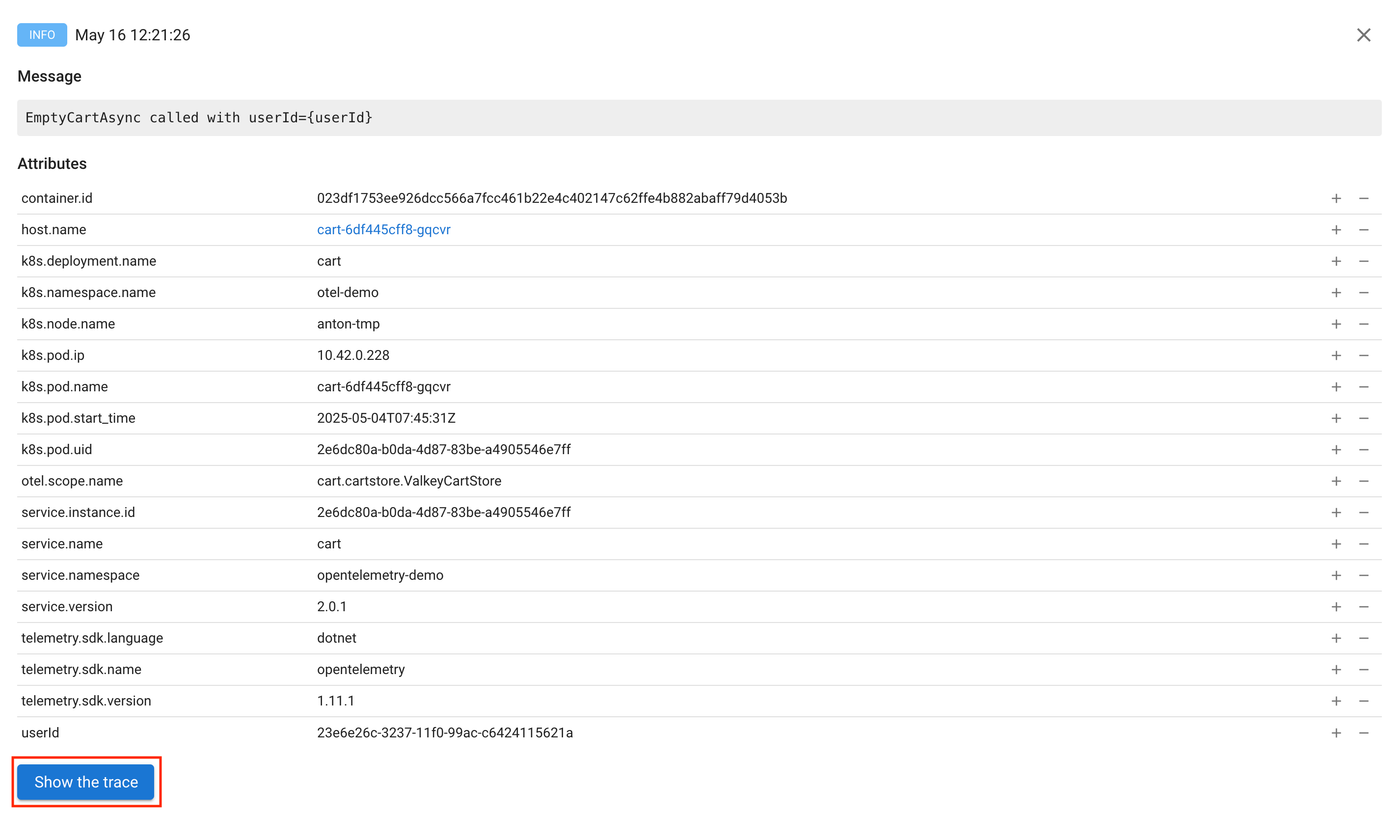
It works both ways: from any log message, you can also jump to the relevant trace.
Why These Features Matter
Coroot 1.11 makes it easier to monitor costs and troubleshoot issues, whether you’re running cloud-native apps or hybrid setups. These new features help you get clearer insights faster, so you can focus on keeping your systems healthy.
Get the latest Coroot or give it a try for the first time by checking out our installation guide. Let us know what you think!