Troubleshooting memory-related issues in Kubernetes
 Nikolay Sivko
We’re building Coroot, an open-source observability tool that helps engineers troubleshoot their systems. Our “secret sauce” is that we test our product on real problems to understand the data needed, and how to analyze it in order to identify issues. In previous posts, we explored how we use Chaos Engineering to confirm that Coroot effectively detects network and Postgres performance issues. Now, it’s time to focus on memory-related issues.
Memory Management 101
Linux memory management is a pretty complex system, but it offers a straightforward interface for applications. An application can ask the kernel to allocate memory using malloc(), utilize the allocated memory, and then release memory that is no longer needed with free().
However, memory is a limited resource shared among the applications running on the node. The Linux kernel offers various methods to manage memory allocations:
- Limits: You can set the maximum amount of memory that an application is allowed to allocate. If the application reaches this memory limit, it will be terminated by the OOM killer.
- Termination priorities (
oom_score_adj): An application can be terminated by the OOM (Out Of Memory) killer, even if it doesn’t have a memory limit, for example, when a node runs out of memory. The priority for selecting which applications to terminate is based on their memory usage, but you can adjust the priority of any given app. - Throttling (memory.high): Modern Linux kernel versions allows you to configure the memory.high threshold for an app. When the application reaches this threshold, its allocations are slowed down. The application won’t be terminated, but its performance may suffer due to increased allocation latency.
Let’s take a closer look at scenarios involving OOM events and memory throttling. We’ll explore how each of these impacts application performance and discuss methods for identifying them.
Out Of Memory
Containers in distributed systems are often considered ephemeral entities, meaning they can crash and be restarted by an orchestrator like Kubernetes or even be evicted from the node. However, when a container crashes or is terminated due to an Out Of Memory (OOM) event and then restarts, the application cannot finish serving in-progress requests, potentially resulting in errors in handling user requests.
Another reason to monitor OOM events is that if a container restarts repeatedly, Kubernetes may introduce pauses between restart attempts (resulting in the CrashLoopBackOff state), which can lead to reduced capacity or even complete unavailability of the application.
Now, let’s explore how to troubleshoot such issues with Coroot.
To illustrate this scenario, I’ve deployed a demo service called catalog with an intentionally introduced memory leak. This Go application allocates a memory buffer on each request but does not release it after the request is completed.
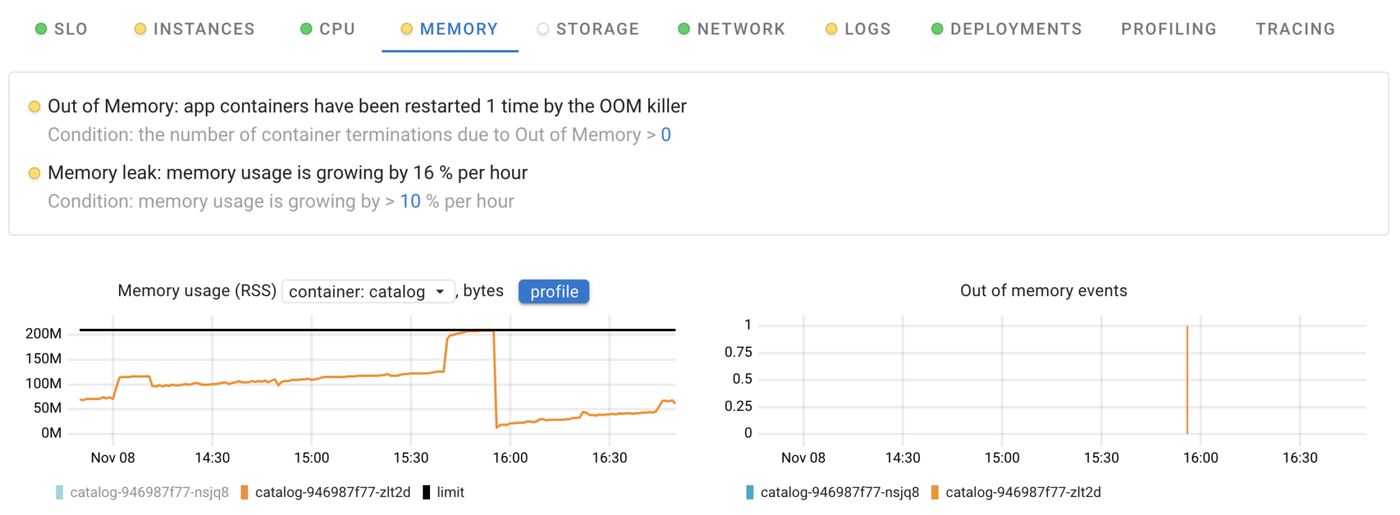
Coroot offers two predefined memory inspections, which not only identify cases where application containers were terminated by the OOM killer but also detect memory leaks, allowing you to be proactive in addressing these issues.
Okay, we’ve confirmed that the used memory is increasing and has hit its limit. What should we do next? We still need to figure out how to solve this issue.
Let’s dive into the profiling data to pinpoint the exact line of code responsible for the memory leak. When you click on the “Profile” button, Coroot will display the memory profile of the application for that specific time window.
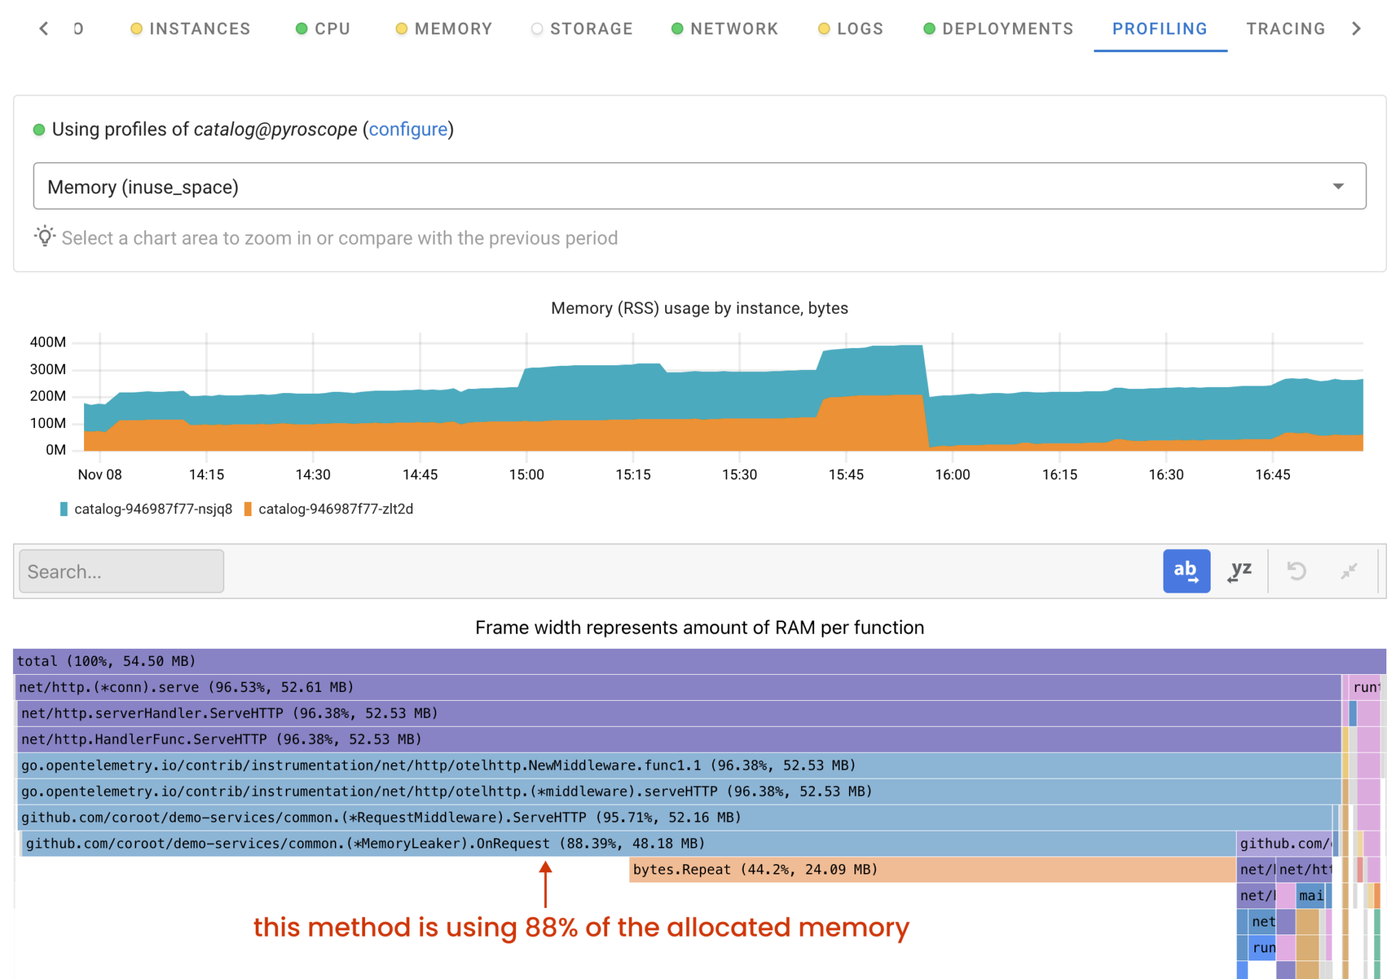
This flame graph displays the code hierarchy, organized by memory usage, with each frame representing the memory allocated by a specific function. A wider frame indicates greater memory usage by that function. Frames underneath represent nested function calls. To identify code with a memory leak, look for the widest frame at the bottom of the stack.
In our case, the (*MemoryLeaker).OnRequest method consumes 88% of the allocated memory. We now have a clear path to resolve the issue!
Memory throttling
Now, let’s see how memory allocation throttling works in practice. To set the memory.high threshold for a Kubernetes application, you will need to enable the MemoryQOS feature flag.
To achieve this on k3s, you can use the following configuration file:
#/etc/rancher/k3s/config.yaml
kubelet-arg:
  - feature-gates=MemoryQoS=true
Kubernetes computes the memory.high value automatically using the memory request, limit, and memoryThrottlingFactor, which is set to 0.9 by default.
memory.high = memory.request + memoryThrottlingFactor * (memory.limit - memory.request)
For memory.request=100M and memory.limit=200M: memory.high=100+0.9*(200-100)=190M
Let’s ensure that Kubernetes has configured the memory.high threshold for the Pod:
# ps aux|grep catalog
root     3679345  9.6  0.5 735952 46496 ?        Ssl  10:57   0:18 /catalog
# cat /proc/3679345/cgroup
0::/kubepods.slice/kubepods-burstable.slice/kubepods-burstable-pod78342afc_525e_4bde_ad72_299684639f68.slice/cri-containerd-c70a08490635d381f80c8dba49d608968e01c4b0c65b7cca2531aade4a24b757.scope
# cat /sys/fs/cgroup/<cgroup>/memory.max
209715200
# cat /sys/fs/cgroup/<cgroup>/memory.high
199229440
Now, let’s examine how the memory consumption profile changed when it reached memory.high:
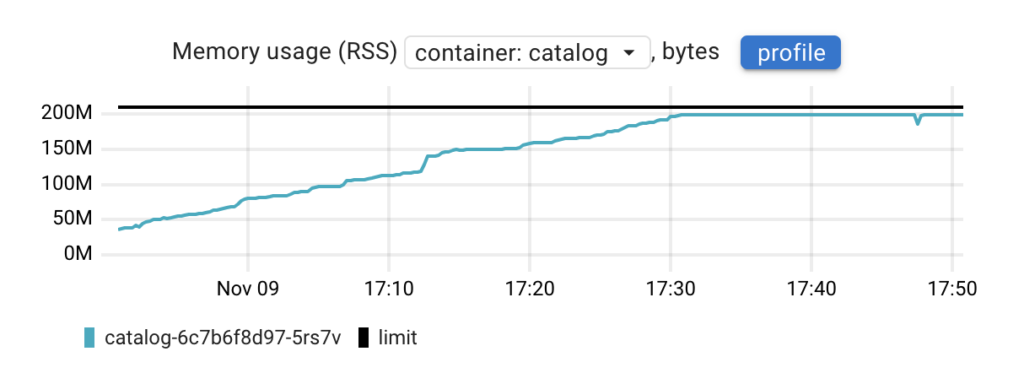
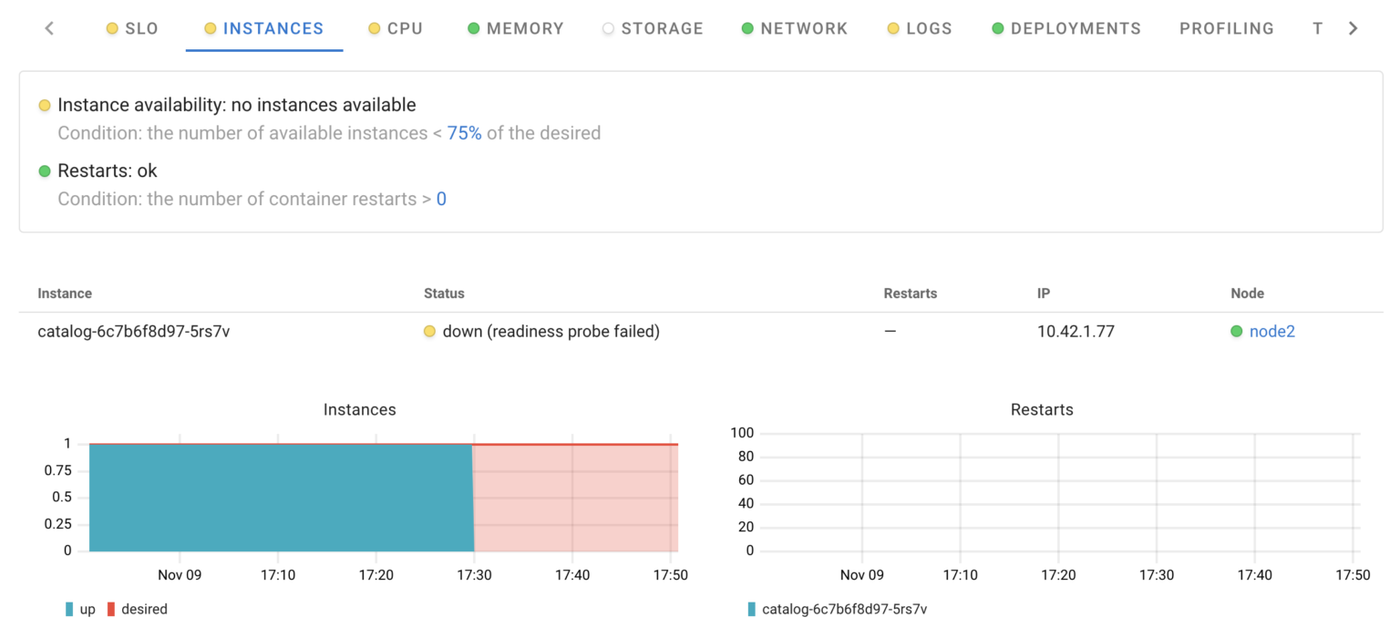
In this case, we notice that memory usage stopped increasing at some point. But why did this happen if our memory leak is still there? The reason is that when the application hit memory.high, its memory allocations were throttled, readiness probes started to time out, and Kubernetes stopped sending requests to this Pod.
We still lack a complete understanding of how allocation throttling works at the low level. Let’s explore what the application is currently doing
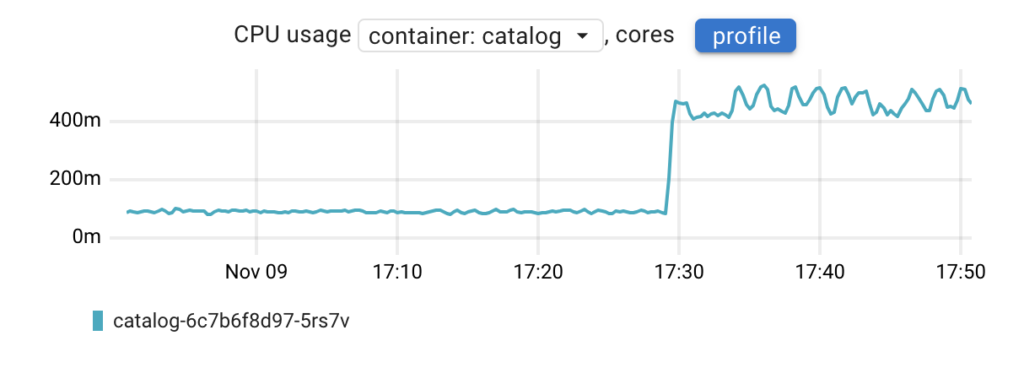
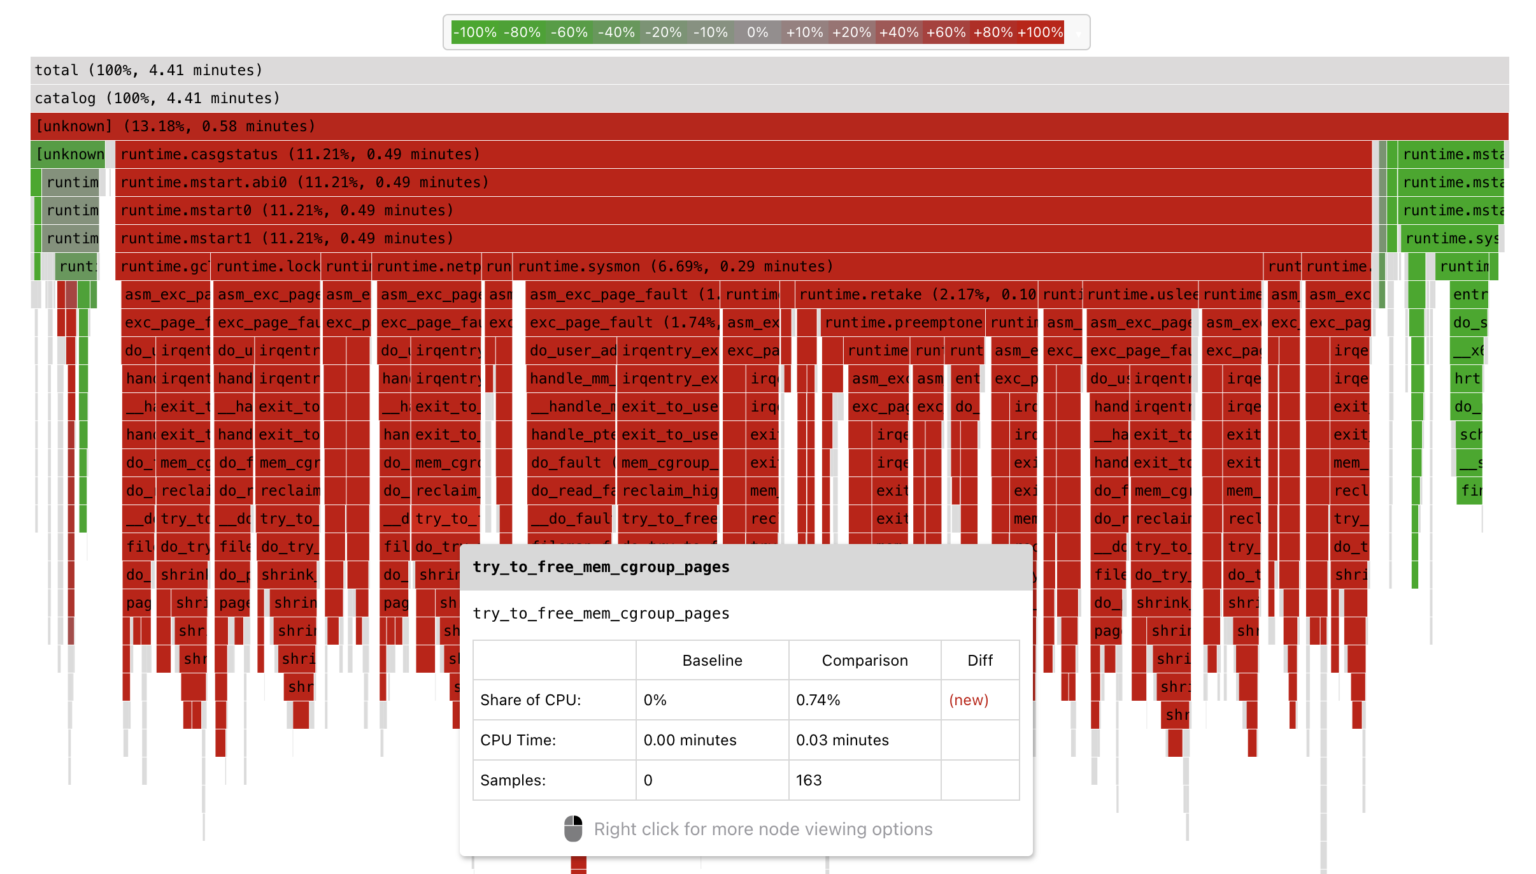
As shown on the chart, CPU usage has increased compared to the previous state. Instead of making assumptions about where the CPU time is being spent, let’s examine the CPU profile in comparison mode to precisely identify the changes.
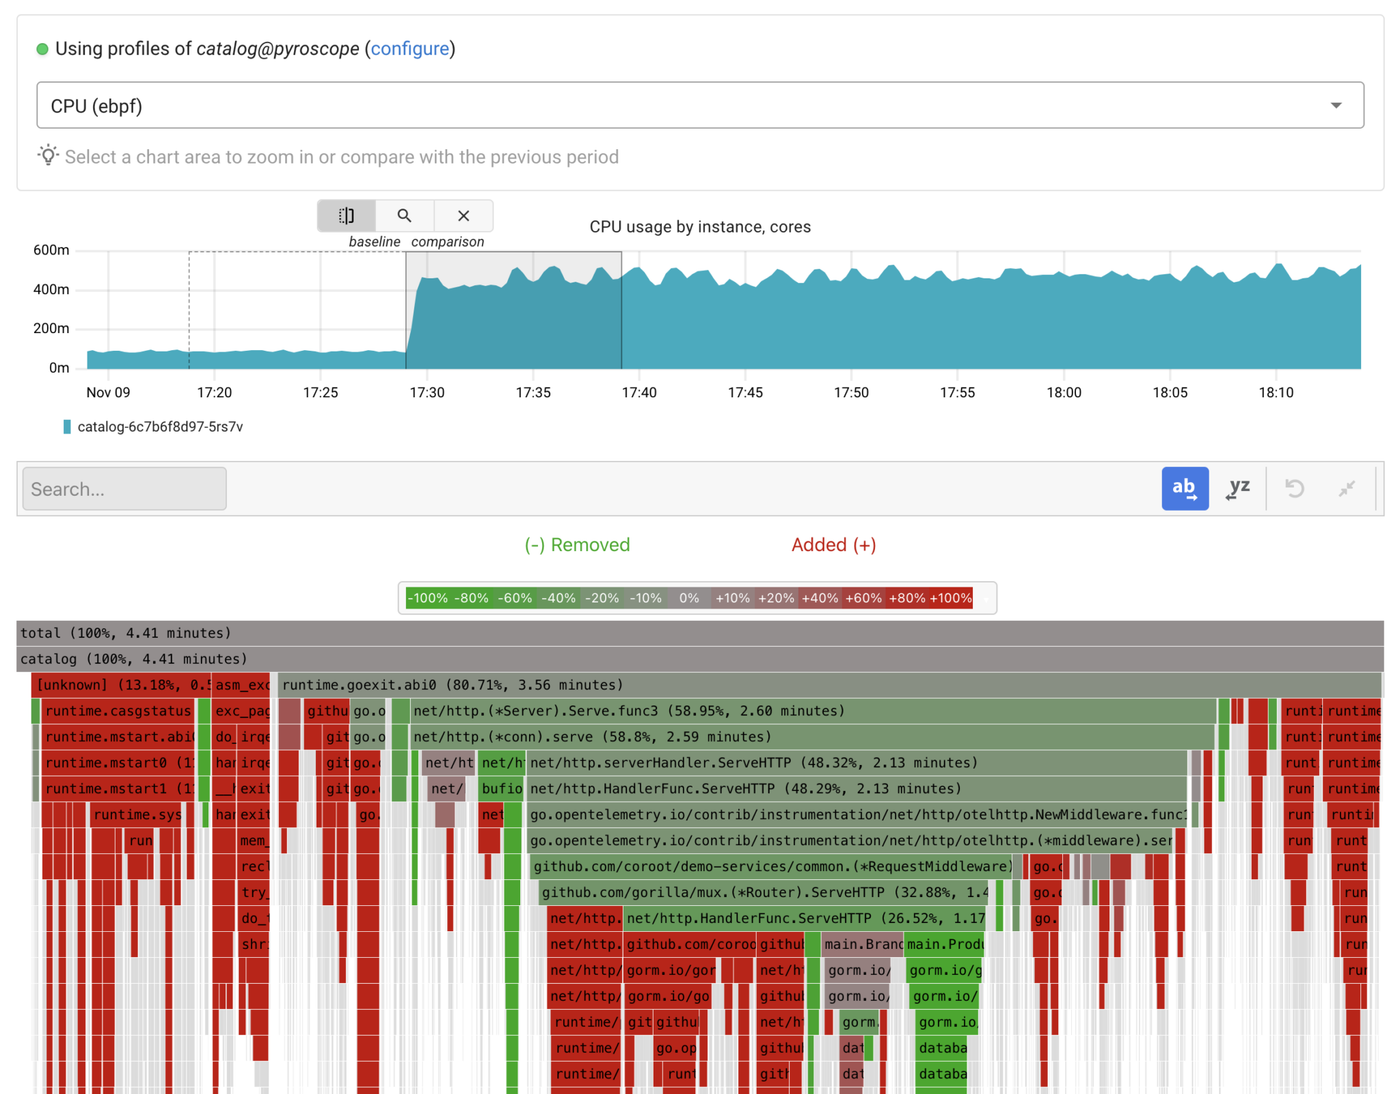
This mode enables a quick understanding of which function calls have started to consume more resources compared to the baseline time window. If we zoom in on any “red” frame, we can see that the code got stuck on memory allocations, which resulted in memory reclaim attempts.
It would be better if the OOM killer simply terminated the app. In this case, the application could continue to handle requests after a restart.
If MemoryQOS is enabled in your cluster and you want to prevent throttling for certain apps, make sure that both the memory request and limit have identical values. This will assign the Guaranteed QoS class to the application, and Kubernetes won’t set a memory.high threshold for it.
The cluster overview
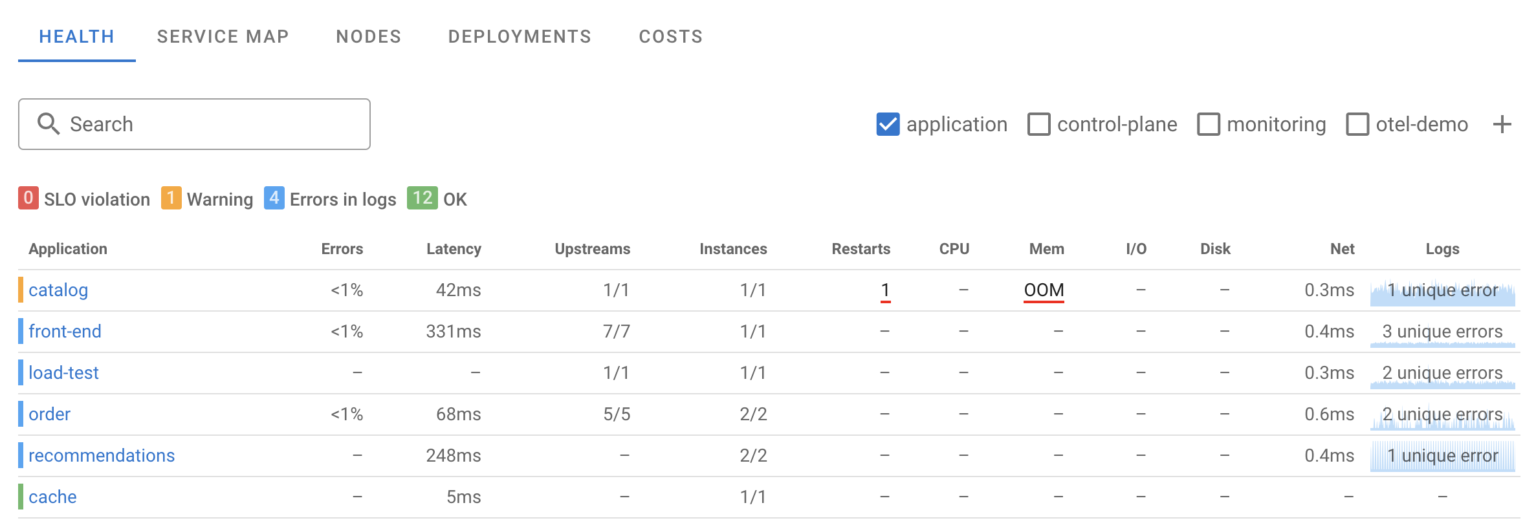
Modern systems often consist of hundreds of services, and a single OOM event or memory leak shouldn’t trigger alerts overnight. Nevertheless, addressing such issues is crucial for system stability. Coroot’s Application Health Summary makes it easy to find applications in the cluster experiencing memory-related issues.
Conclusion
In summary, your apps may encounter the following memory-related issues:
- OOM (Out of Memory): An app may be terminated by the OOM killer either due to reaching its memory limit or when the node runs out of memory. Coroot automatically flags this and provides a memory profile to identify problematic code.
- Memory Throttling: If an app hits the memory.high threshold, its further memory allocations can be throttled. In such cases, Coroot identifies issues with specific instances, and you can use its built-in CPU profiling to precisely understand the activity of each instance.
Follow the instructions on our Getting started page to try Coroot now. Not ready to Get started with Coroot? Check out our live demo.
If you like Coroot, give us a ⭐ on GitHub️ or share your experience on G2.
Any questions or feedback? Reach out to us on Slack.