Nowadays, in the era of microservices, infrastructures have become super-complex: dynamic nodes provisioning, autoscaling, dozens or even hundreds of containers working side by side. In order to maintain control over such infrastructure, we need to be able to know what has happened to each application at any given time.
First, let’s look at computing resources. Usually, when engineers talk about resources, they are actually referring to utilization which is not always correct. For example, the high utilization of a CPU by a container is not an issue in general. The real problem here is that this can cause another container on the same machine to perform slower due to a lack of CPU time.
Only a few people know that the Linux kernel counts exactly how long each task has been waiting for kernel resources to become available. For instance, a task could wait for CPU time or synchronous block I/O to complete. Such delays usually directly affect application latency, so measuring this seems quite reasonable.
When researching how we could detect CPU-related issues, we came to the conclusion that the CPU delay of a container is a perfect starting point for investigation. The kernel provides per-PID or per-TGID statistics:
Node-agent gathers per-TGID statistics from the kernel through the Netlink protocol and aggregates it to the per-container metrics:
Let’s see how one of the resulting metrics can help in detecting various CPU-related issues.
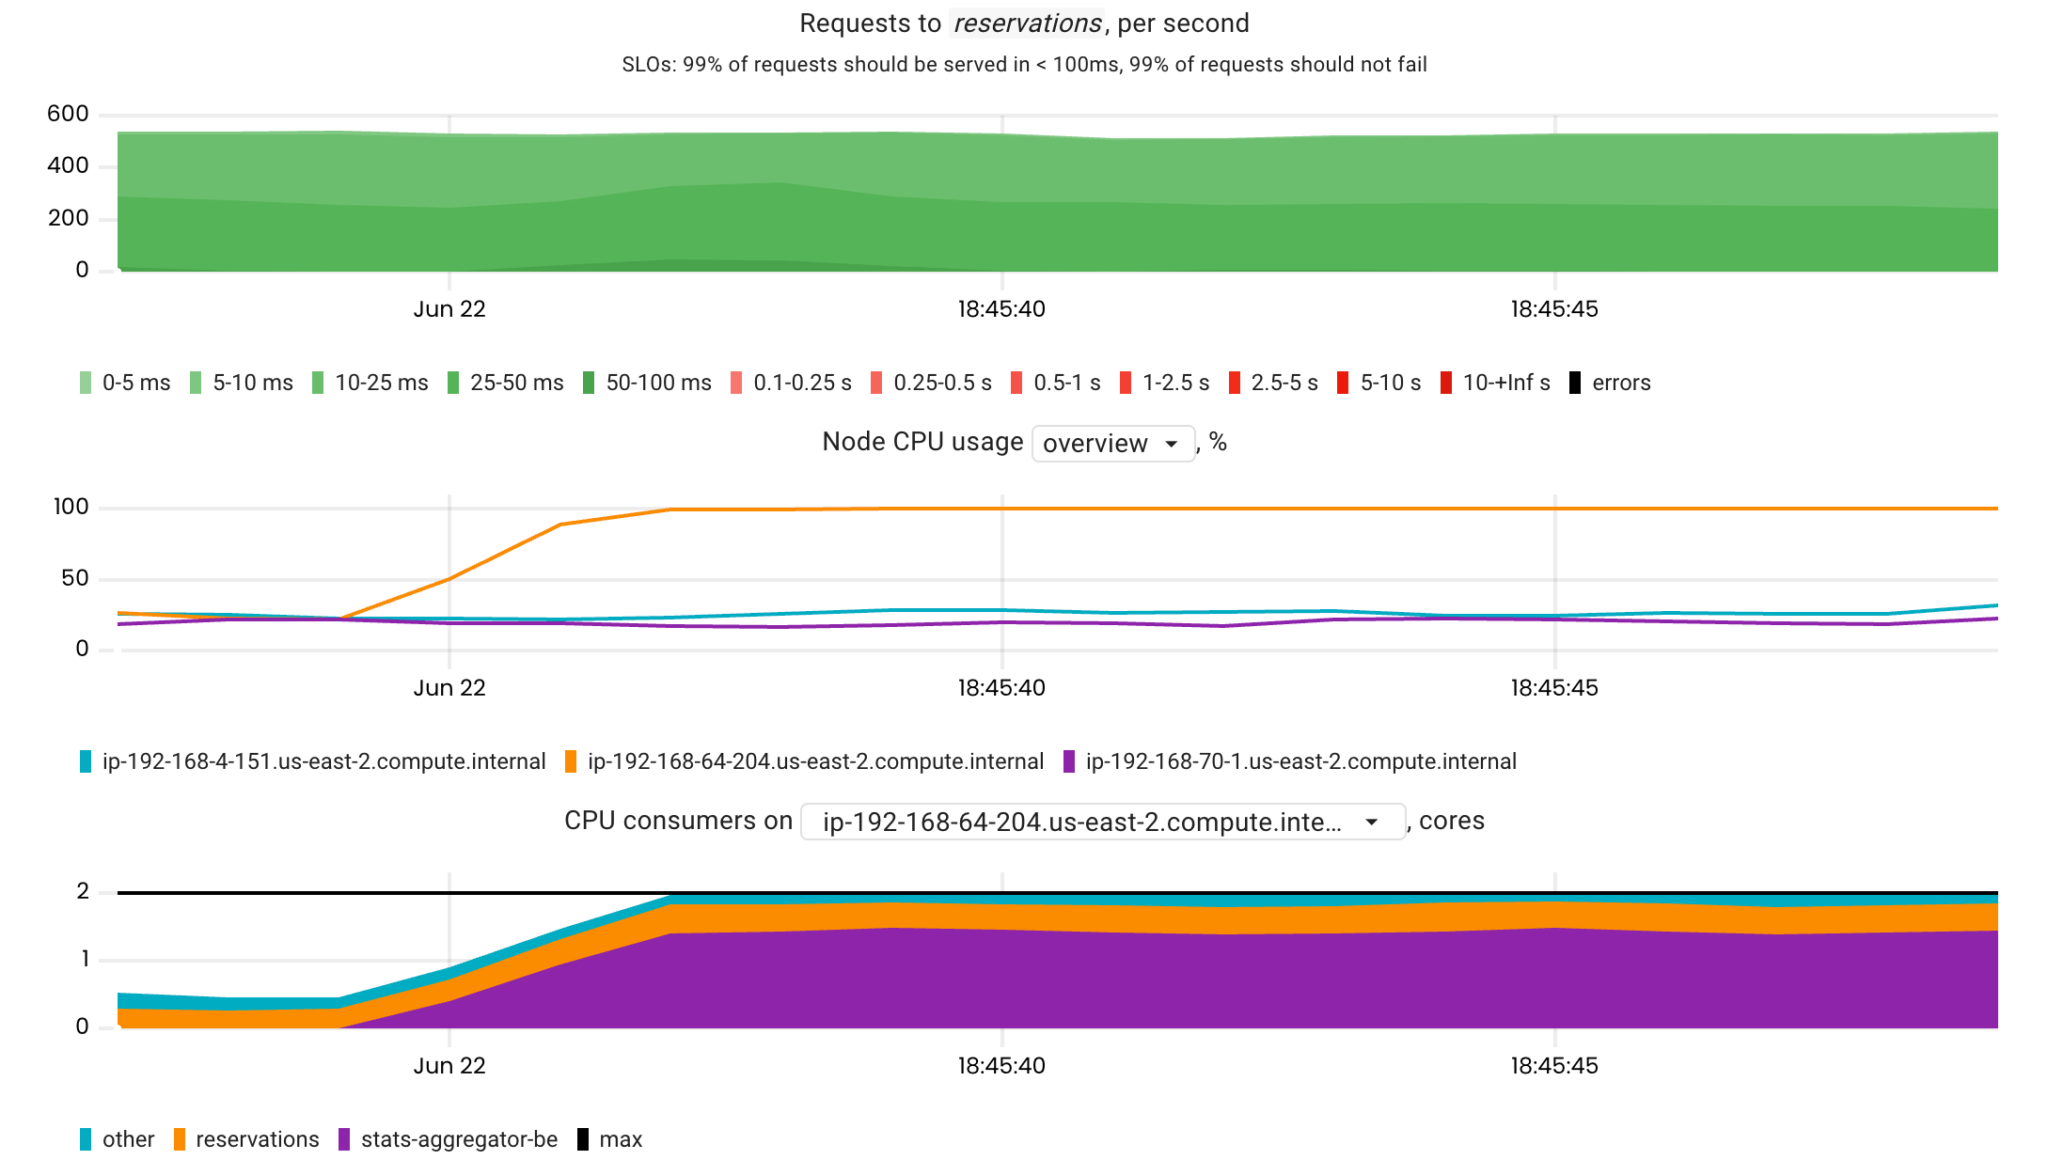
In this scenario, a CPU-intensive container (stats-aggregator) runs on the same node as a latency-sensitive app (reservations).

In the chart above, we can see that the reservations app is not meeting its SLOs: requests are performing slowly (the red area) and failing (the black area). Now let’s look at the CPU metrics related to this application:

Comparing these metrics, we can easily conclude that the stats-aggregator has caused the issue. Yet, could we do such analysis without using the container_resources_cpu_delay_seconds_total metric?
On the contrary, here are the same metrics for a case where stats-aggregator-(be) has started with the lowest CPU priority (the Best-Effort QOS class was assigned).

As you can see, the CPU utilization of the node is 100%, but this is not significantly affecting the reservations‘ SLIs.
At Coroot, we came up with the following algorithm to detect CPU-related issues of a particular application:
I must clarify why checking correlation can often be tricky. As seen in the first scenario above, several SLIs (latency and success rate) were affected all at once. This is why Coroot also checks the correlation between the metric and the composition of the relevant SLIs.
In the first stage, we had an issue with the application response time, so there was a strong correlation between this SLI and the total CPU delay.

After the errors appeared, the correlation between cpu_delay and the response time became weak. Yet, the correlation between the sum of errors and slow requests was strong enough to assure that the container did indeed experience a lack of CPU time.

A lack of CPU time can be caused by several reasons:
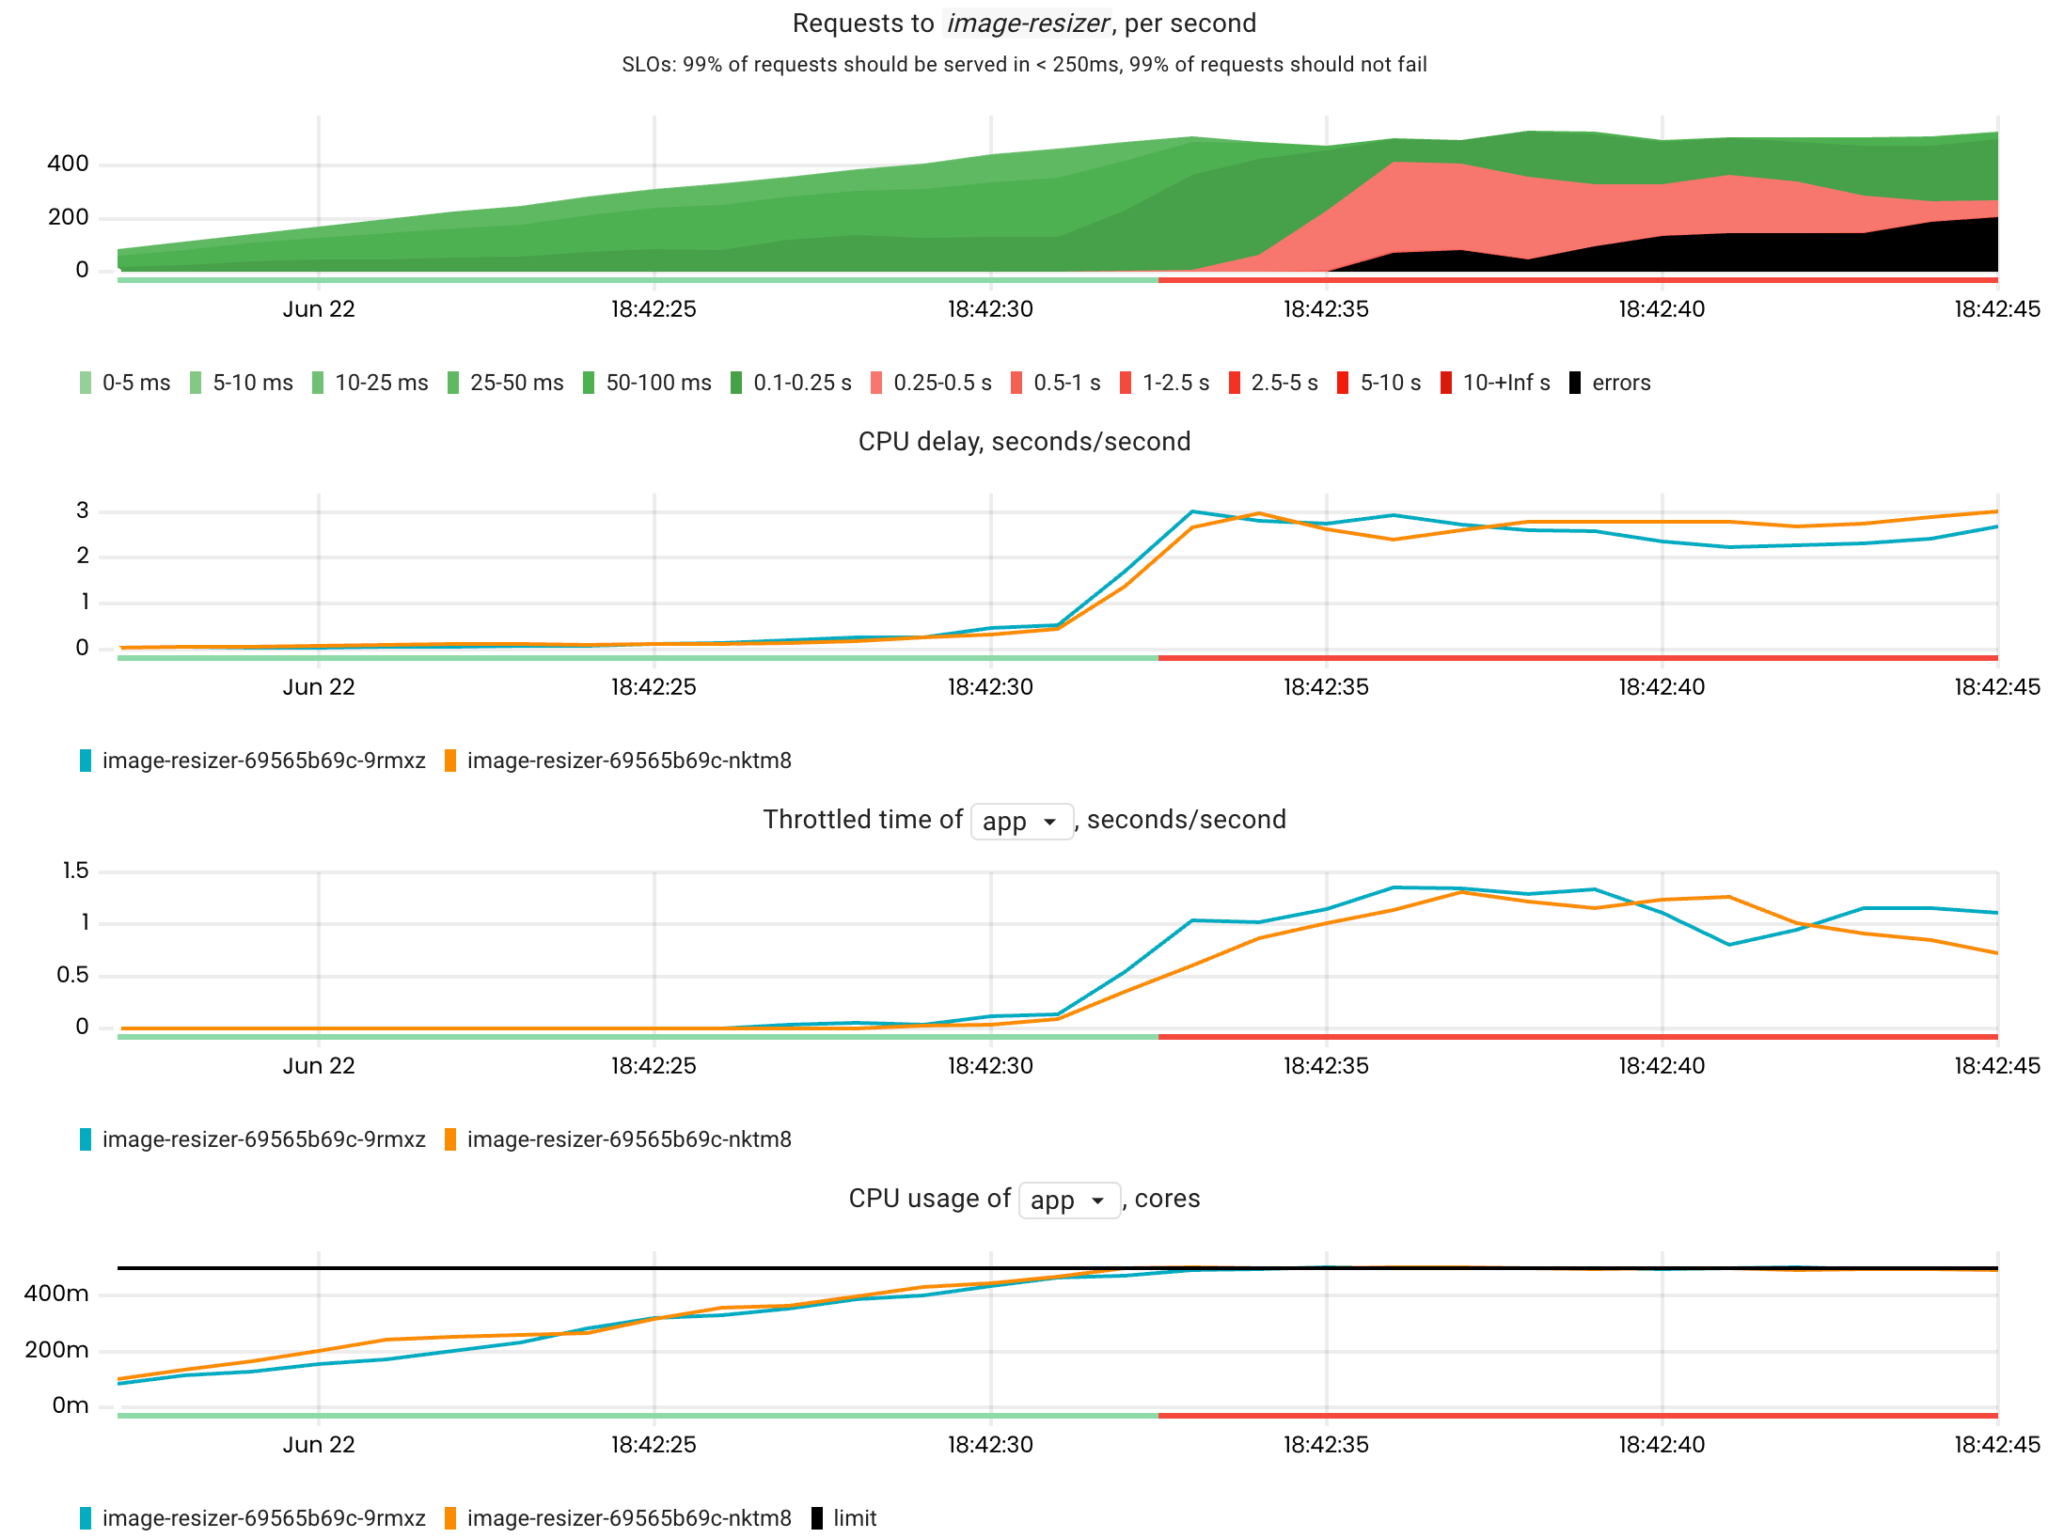
If a container is limited in CPU time (throttled), the cpu_delay metric is bound to increase. However, in this case, we have a separate metric that measures how long each container has been throttled — container_resources_cpu_throttled_seconds_total. Thus, Coroot uses it in addition to cpu_delay to determine that a container has reached its CPU limit and it is that which caused a lack of CPU time.
Here is a failure scenario where the number of requests to the image-resizer app is gradually increased until its containers reach their CPU limits.

Detection also works by checking the correlation between the affected SLIs of the app and throttled_time. Thus, if the correlation is strong, we can conclude that the cause of a CPU lack is throttling.
