Blog
Insights on observability, monitoring, and engineering best practices from the Coroot team.
It was surprisingly hard to break CloudNativePG replication
I tried to make a Postgres replica fall behind by cutting it off from its primary with Chaos Mesh. It stubbornly refused to lag. Here's the investigation, the logs, and the proof from CloudNativePG's source that a replica has a second, hidden WAL source.
 Nikolay Sivko
Let's break autovacuum in Postgres: reproducing failures to make it observable
Every Postgres runs autovacuum and almost nobody monitors it properly. Let's reproduce the common ways it fails and see how Coroot turns each one into a clear, actionable finding.
Nikolay Sivko
The hard part of AI root cause analysis is no longer the model
We ran one real incident through eleven LLMs. The reasoning turned out to be the easy part; the real challenge is the harness that feeds the model the right context.
Nikolay Sivko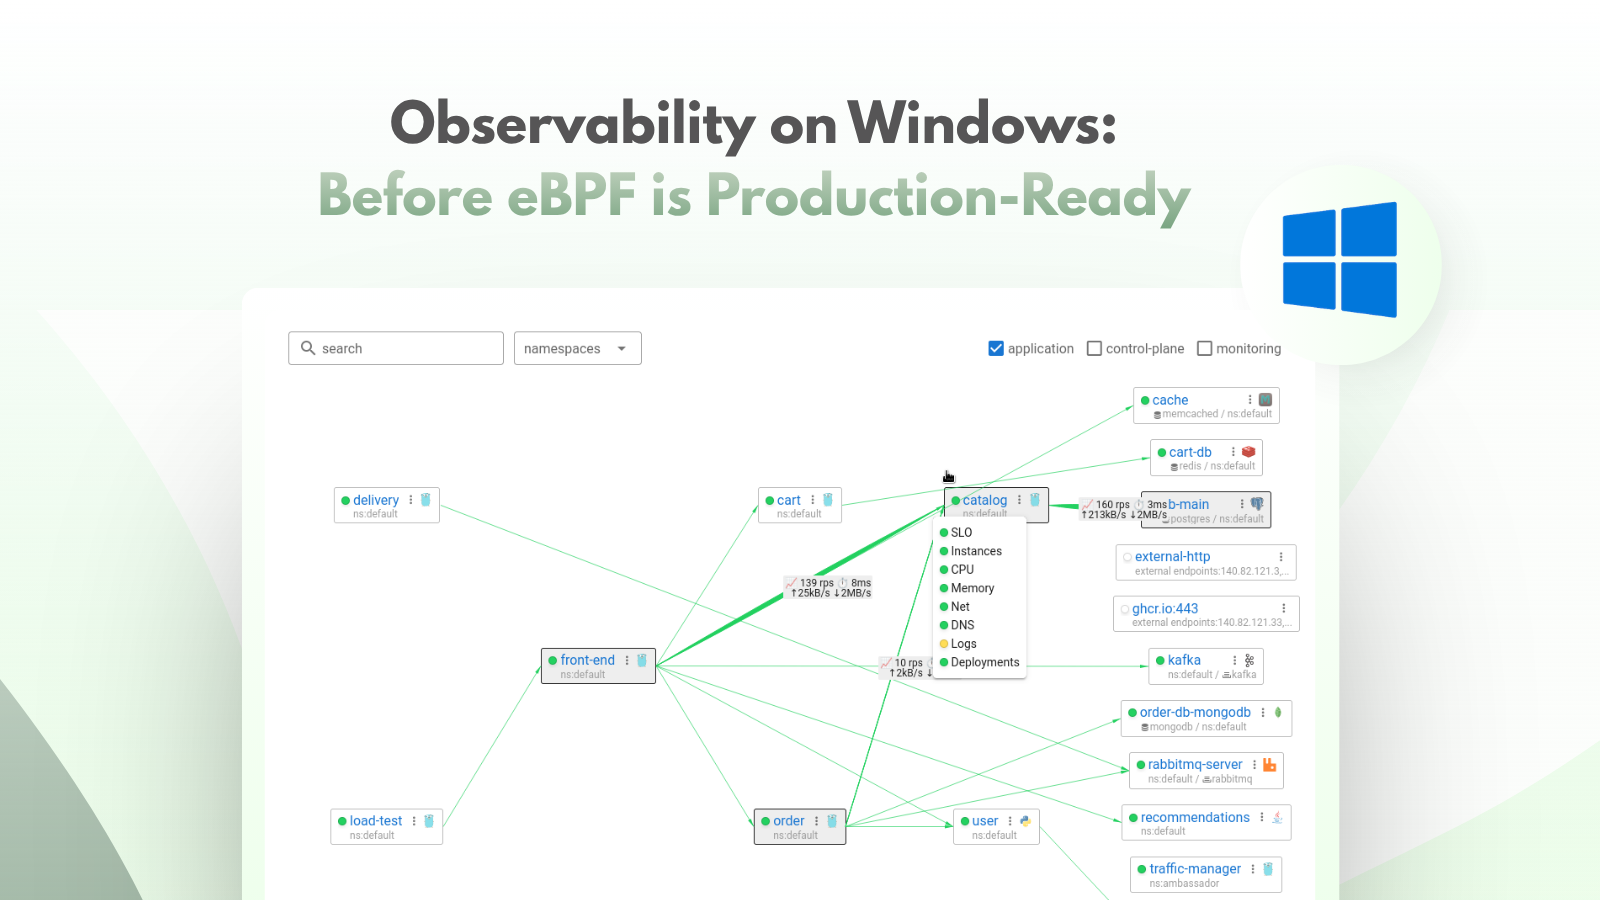
Observability on Windows, before eBPF is production-ready
Coroot's agent now runs on Windows. The story of building it on ETW instead of eBPF: what came easy, what was hard, and what we left for later.
Nikolay Sivko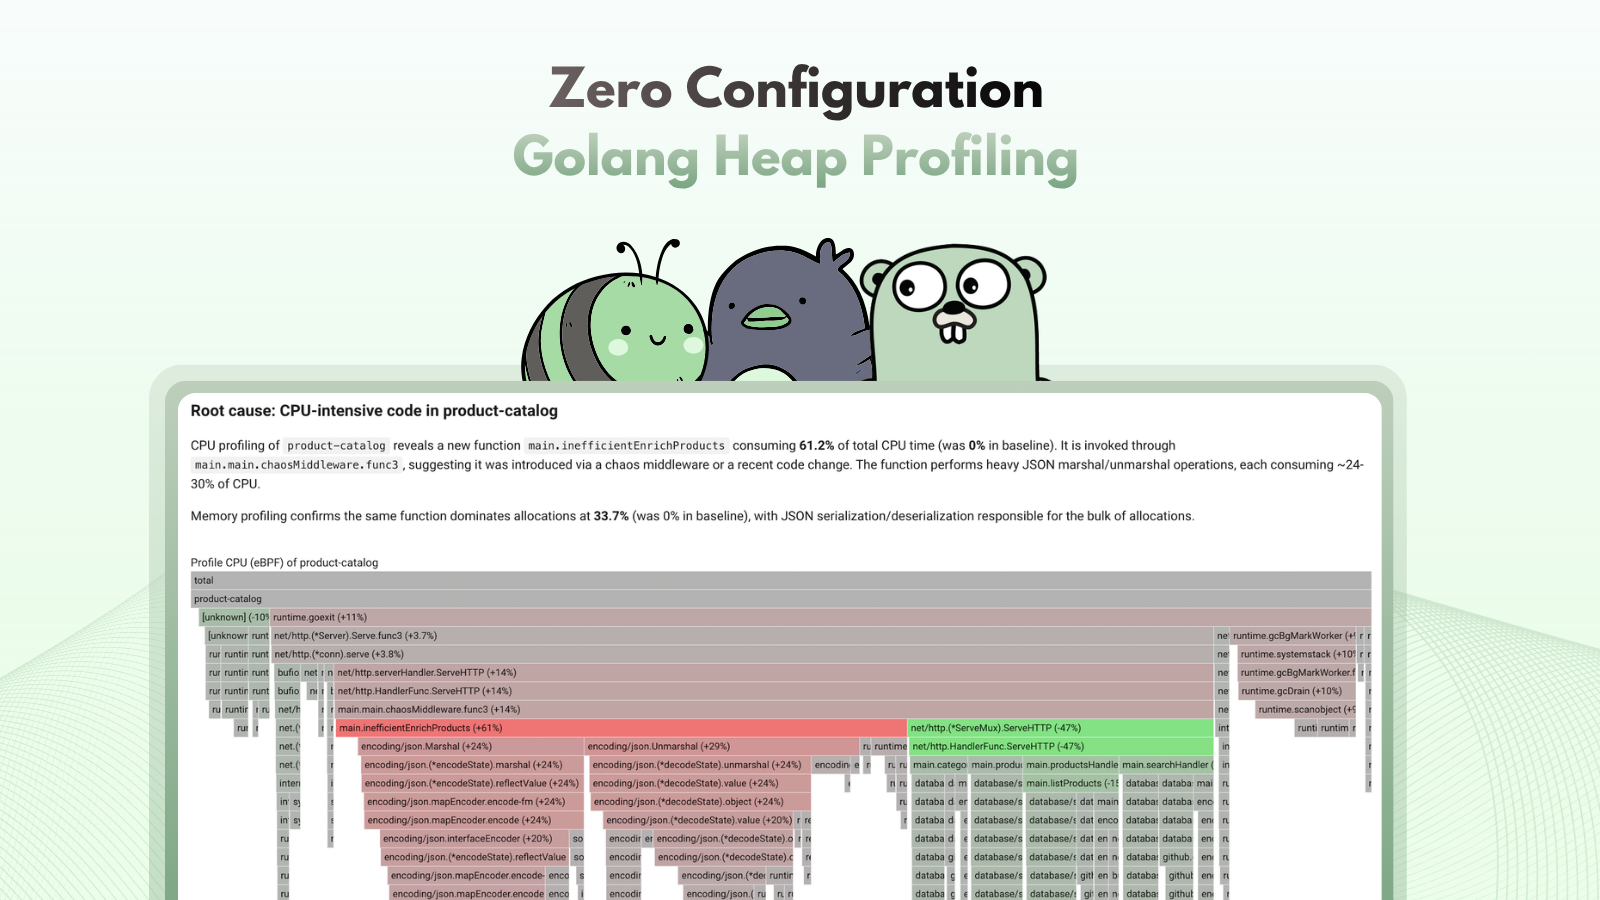
Zero-config Go heap profiling
How we added continuous Go heap profiling to coroot-node-agent without requiring any code changes, pprof endpoints, or annotations, by reading runtime.mbuckets directly from process memory.
Nikolay Sivko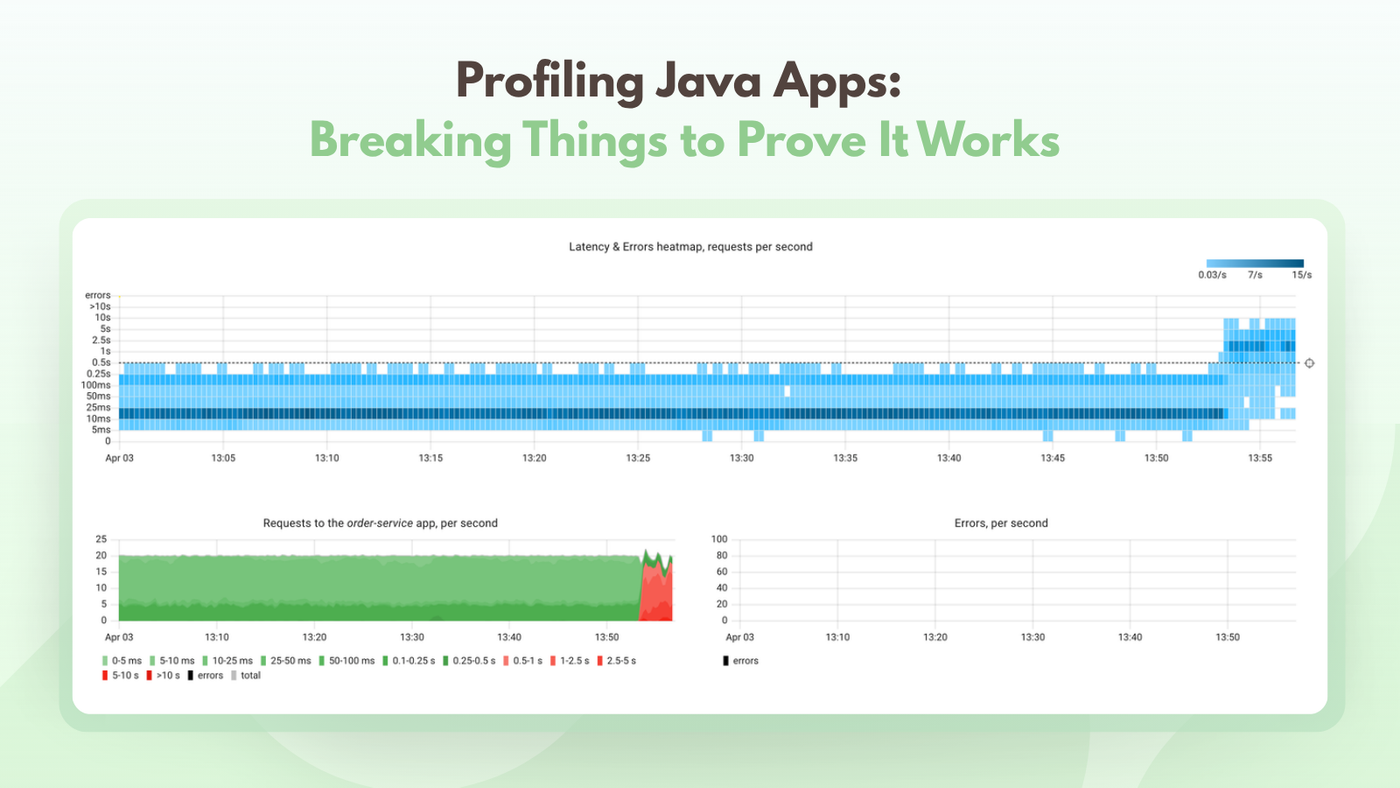
Profiling Java apps: breaking things to prove it works
We added async-profiler support to Coroot for Java CPU, memory, and lock contention profiling with no code changes—then broke things to prove it works.
Nikolay Sivko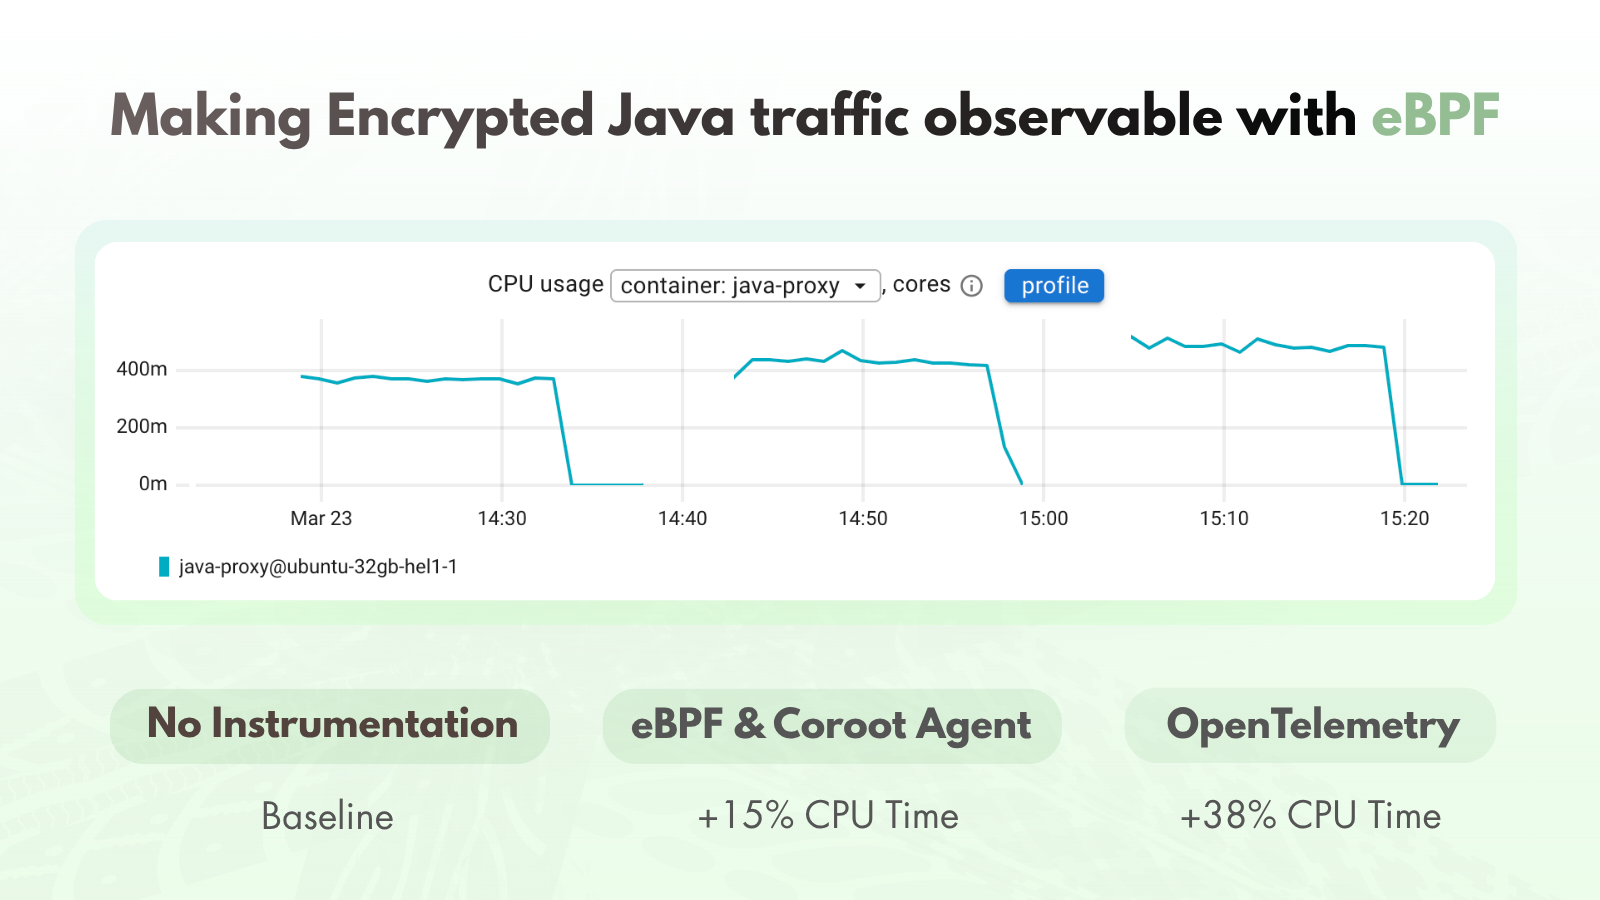
Making encrypted Java traffic observable with eBPF
Learn how Coroot makes encrypted Java traffic observable by combining a lightweight Java agent with eBPF uprobes—no code changes, no sidecars.
Nikolay Sivko
Instrumenting Rust TLS with eBPF
Learn how to capture plaintext from rustls using eBPF uprobes—no code changes—and make encrypted Rust traffic fully observable with Coroot.
Nikolay Sivko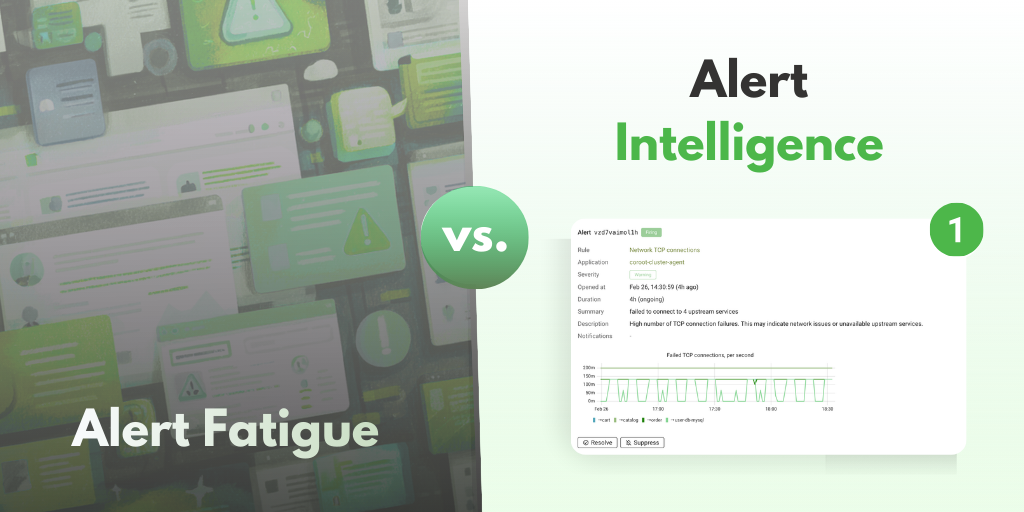
Let's make alerting great again
Coroot delivers preconfigured, symptom-based alerts from inspections, logs, Kubernetes events, and PromQL—with minimal noise and zero setup toil.
Nikolay Sivko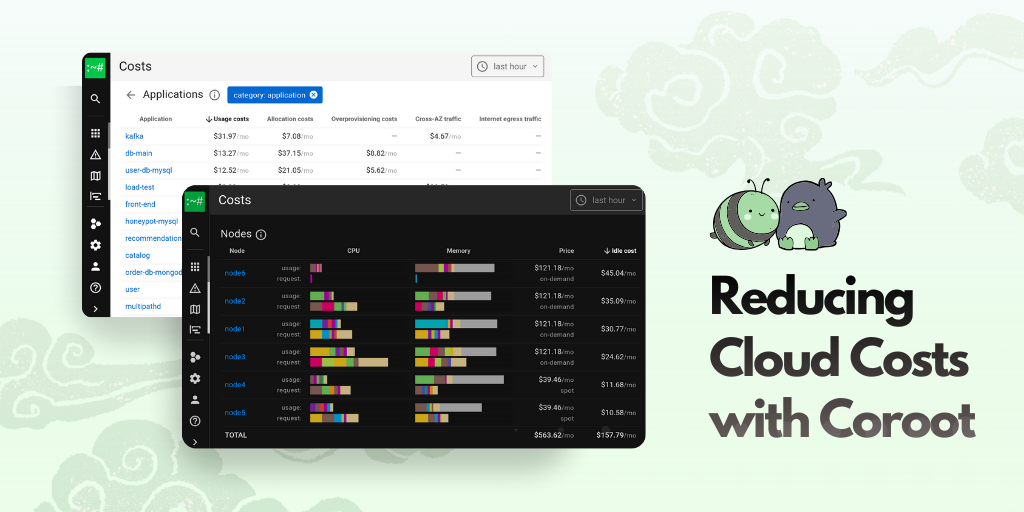
How to Reduce Your Cloud Costs with Coroot
Learn how Coroot maps raw infrastructure costs to individual applications so you can identify waste and cut your cloud bill.
 Alexander Lamberton
Monitoring a Docker Homelab with Open Source
A community walkthrough of setting up Coroot on Rocky Linux to monitor a Docker homelab, using ClickHouse for storage and eBPF for telemetry.
 Arie Van Den Heuvel
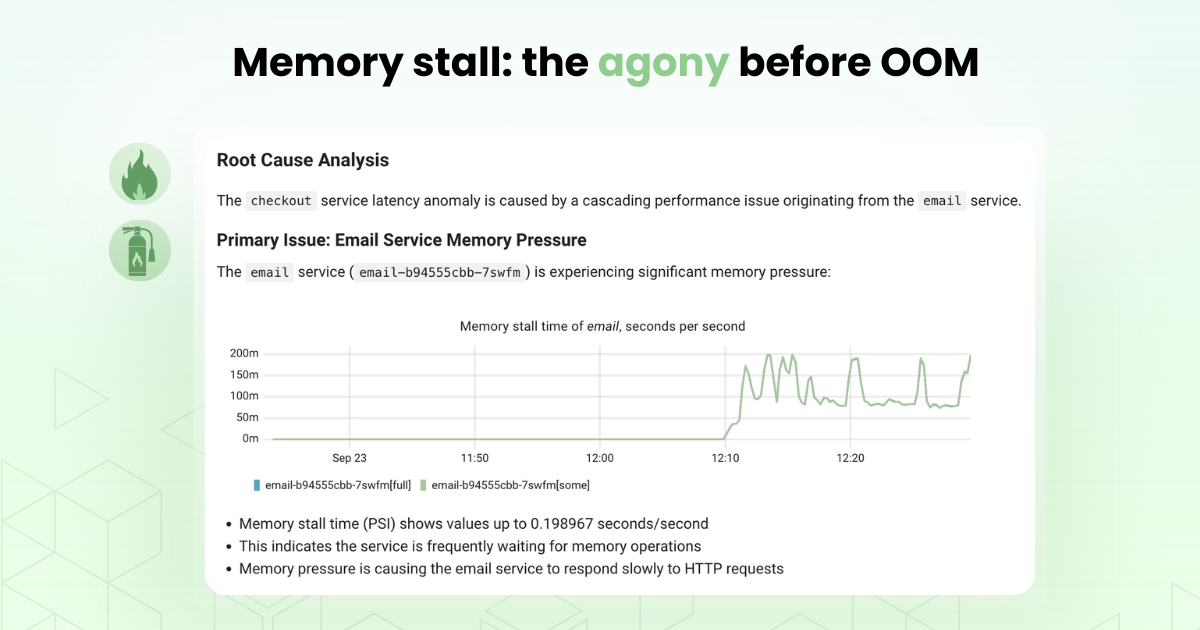
Memory stall: the agony before OOM
Learn how Linux PSI reveals the hidden slowdown before the OOM killer strikes, and how Coroot uses it to detect memory stalls in containers.
Nikolay SivkoTry Coroot Free
Get full-stack observability in minutes with zero code changes. eBPF-powered monitoring with AI-guided root cause analysis.