
Blog
Insights on observability, monitoring, and engineering best practices from the Coroot team.
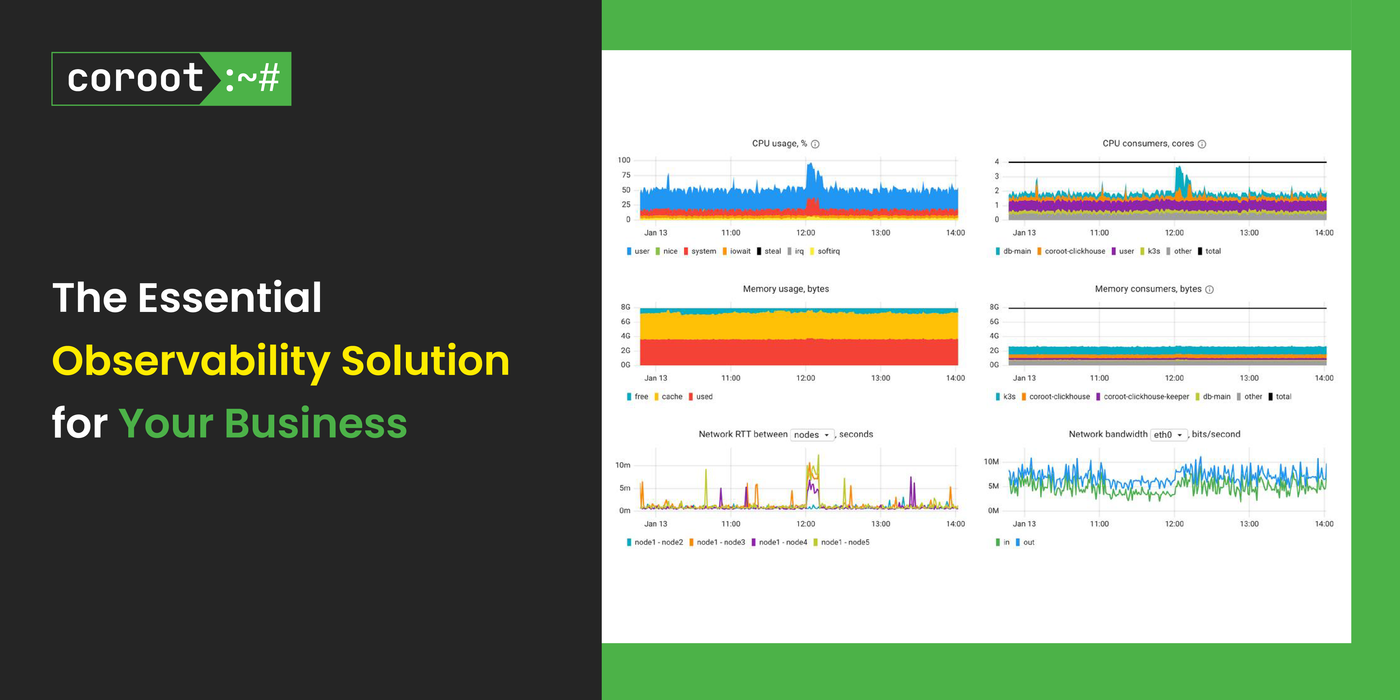
Essential Observability with Coroot
Coroot provides the essential monitoring tools to resolve and prevent problems across your infrastructure—without the complexity or cost of bloated platforms.
 Peter Zaitsev
Getting started with Coroot: Concepts and Terminology
A beginner's guide to the core Coroot concepts and terminology—applications, inspections, SLOs, and service maps explained.
Peter Zaitsev
Supercharging FerretDB Performance with Coroot: A Success Story
See how one team used Coroot to identify FerretDB performance bottlenecks and directly improve application throughput.
 Ana Giles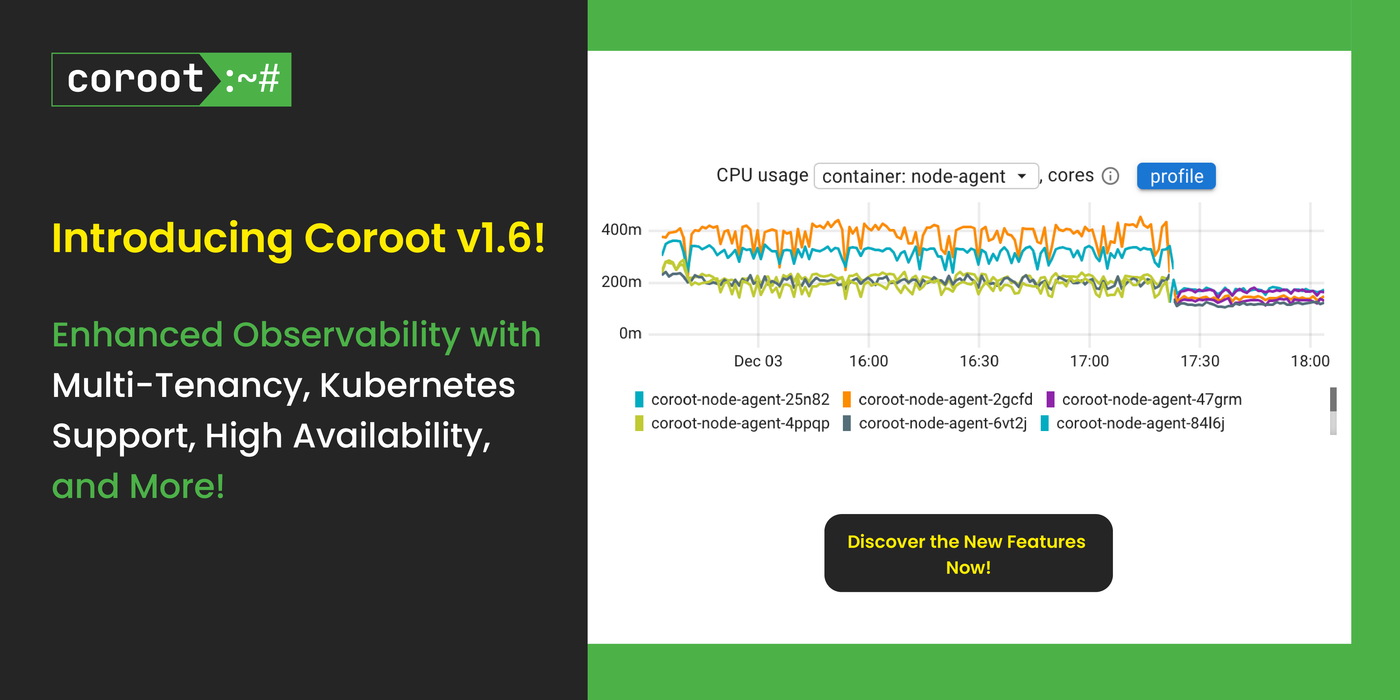
Introducing Coroot v1.6: Enhancements for Multi-Tenancy, Kubernetes, High Availability, and More!
Coroot v1.6 introduces multi-tenancy, a Kubernetes operator, high availability, OpenShift support, and a redesigned documentation site.
 Nikolay Sivko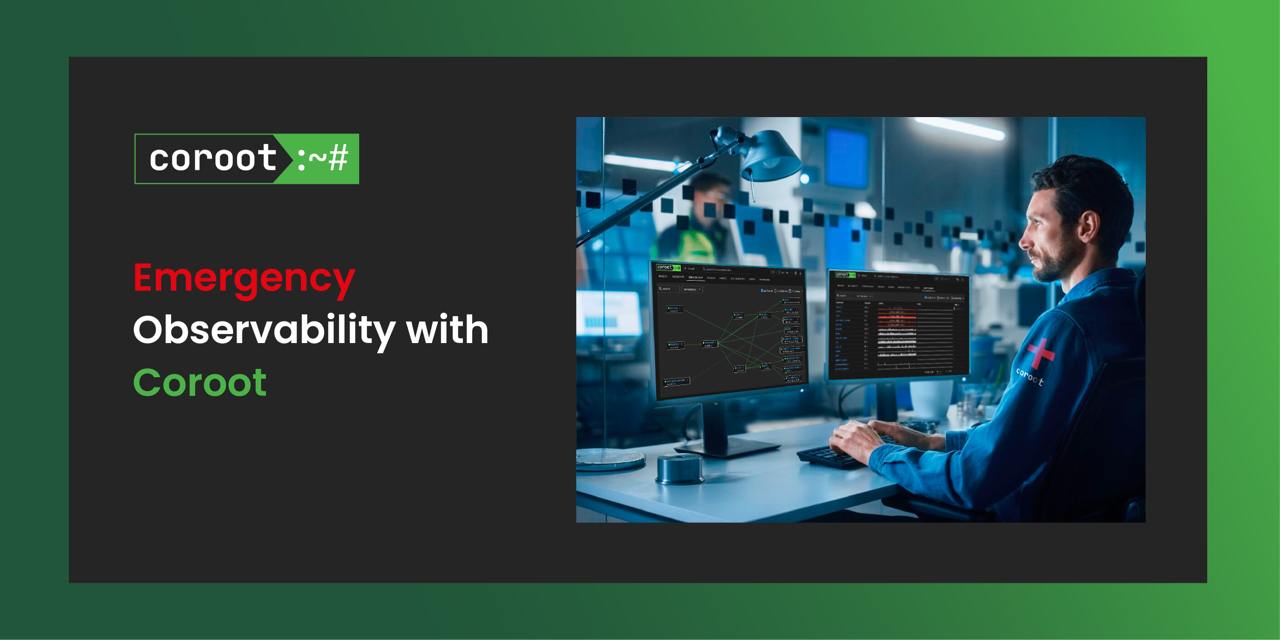
Emergency Observability with Coroot
Learn how to quickly deploy Coroot during an active outage to pinpoint root causes using service maps, logs, and real-time health insights.
Peter Zaitsev
Observability: Self Hosted vs Fully Managed – Exploring the choices
Explore the trade-offs between self-hosted and fully managed observability on cost, control, flexibility, and operational overhead.
Peter Zaitsev
140x cheaper than Datadog: why storing observability data on-prem makes sense
Coroot is an open source alternative to Datadog with transparent pricing, much lower storage costs, full Kubernetes support, and seamless Grafana integration.
Nikolay Sivko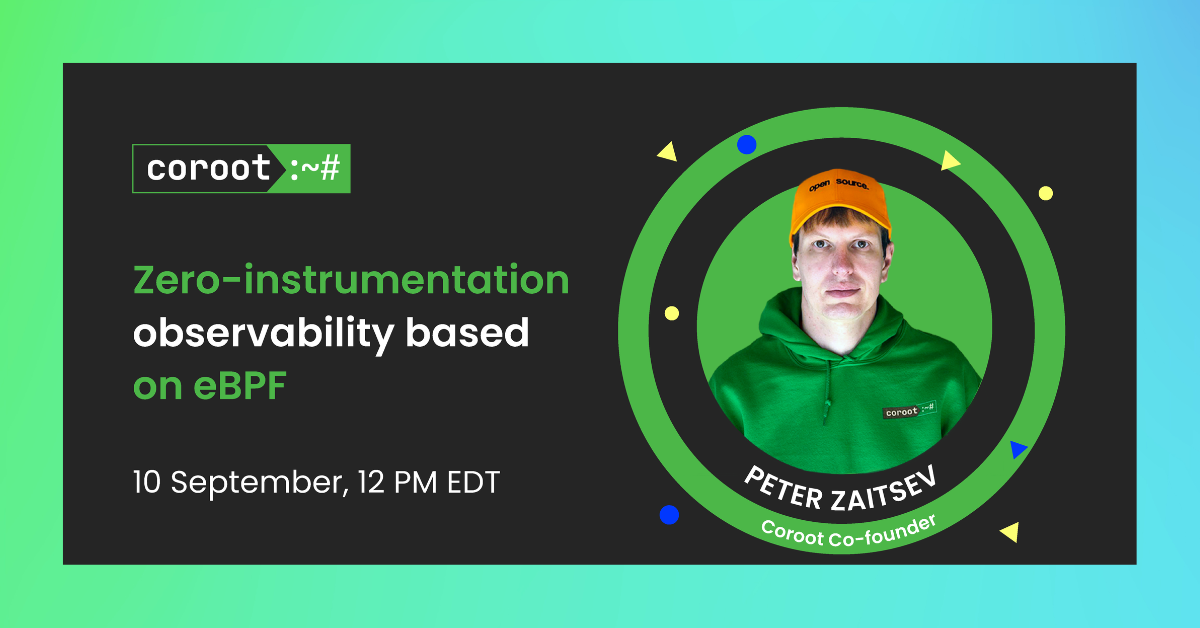
Zero-instrumentation observability based on eBPF
Learn how zero-instrumentation eBPF observability gives you deep infrastructure insights without adding any overhead to your applications.
Peter Zaitsev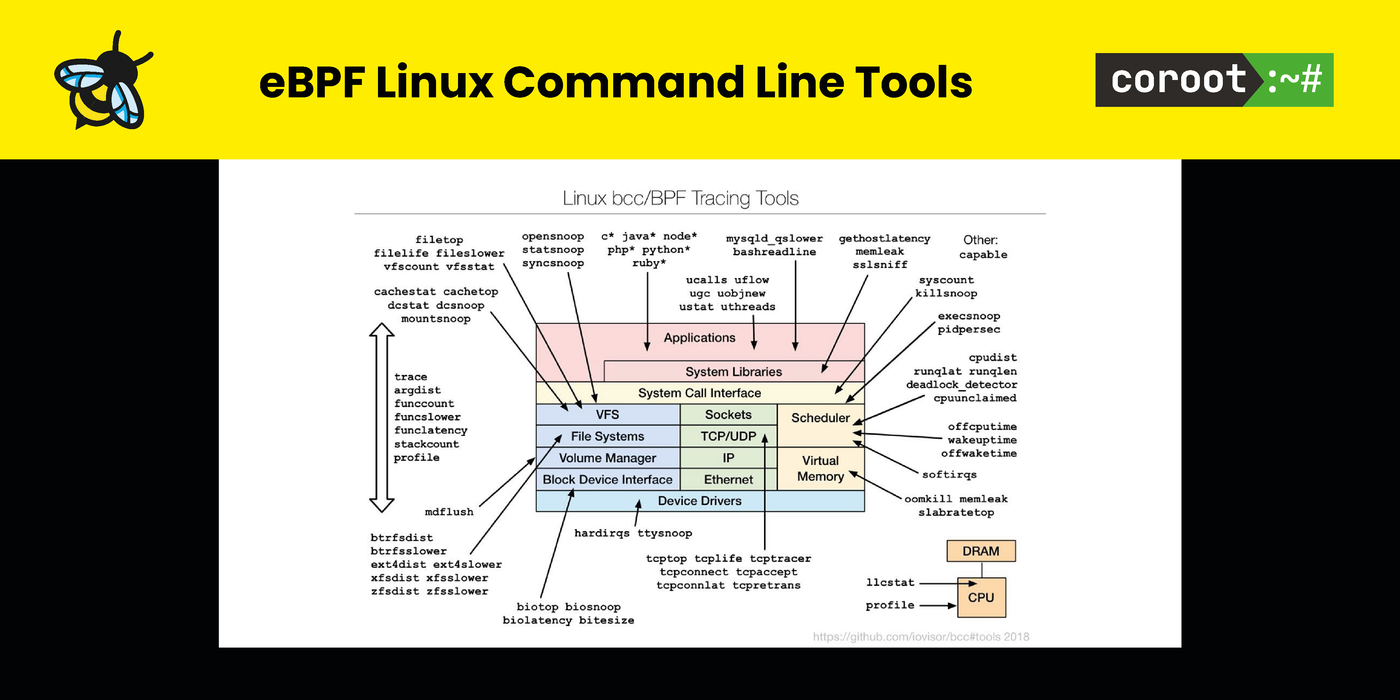
eBPF Linux Command Line Tools
Explore a collection of eBPF-powered Linux command line tools that surface complex performance issues directly from the kernel.
Peter Zaitsev
filetop – eBPF Command Line Tools
Monitor disk I/O in real-time with filetop, an eBPF tool in BCC that tracks file activity at the kernel level.
Peter Zaitsev
gethostlatency – eBPF Command Line Tools
Measure DNS and host resolution latency with gethostlatency in BCC and bpftrace to diagnose slow lookups.
Peter Zaitsev
runqlat and runqslower – eBPF command line tools
Learn about runqlat and runqslower, two essential eBPF tools for diagnosing CPU scheduling delays using BCC and bpftrace.
Peter ZaitsevTry Coroot Free
Get full-stack observability in minutes with zero code changes. eBPF-powered monitoring with AI-guided root cause analysis.