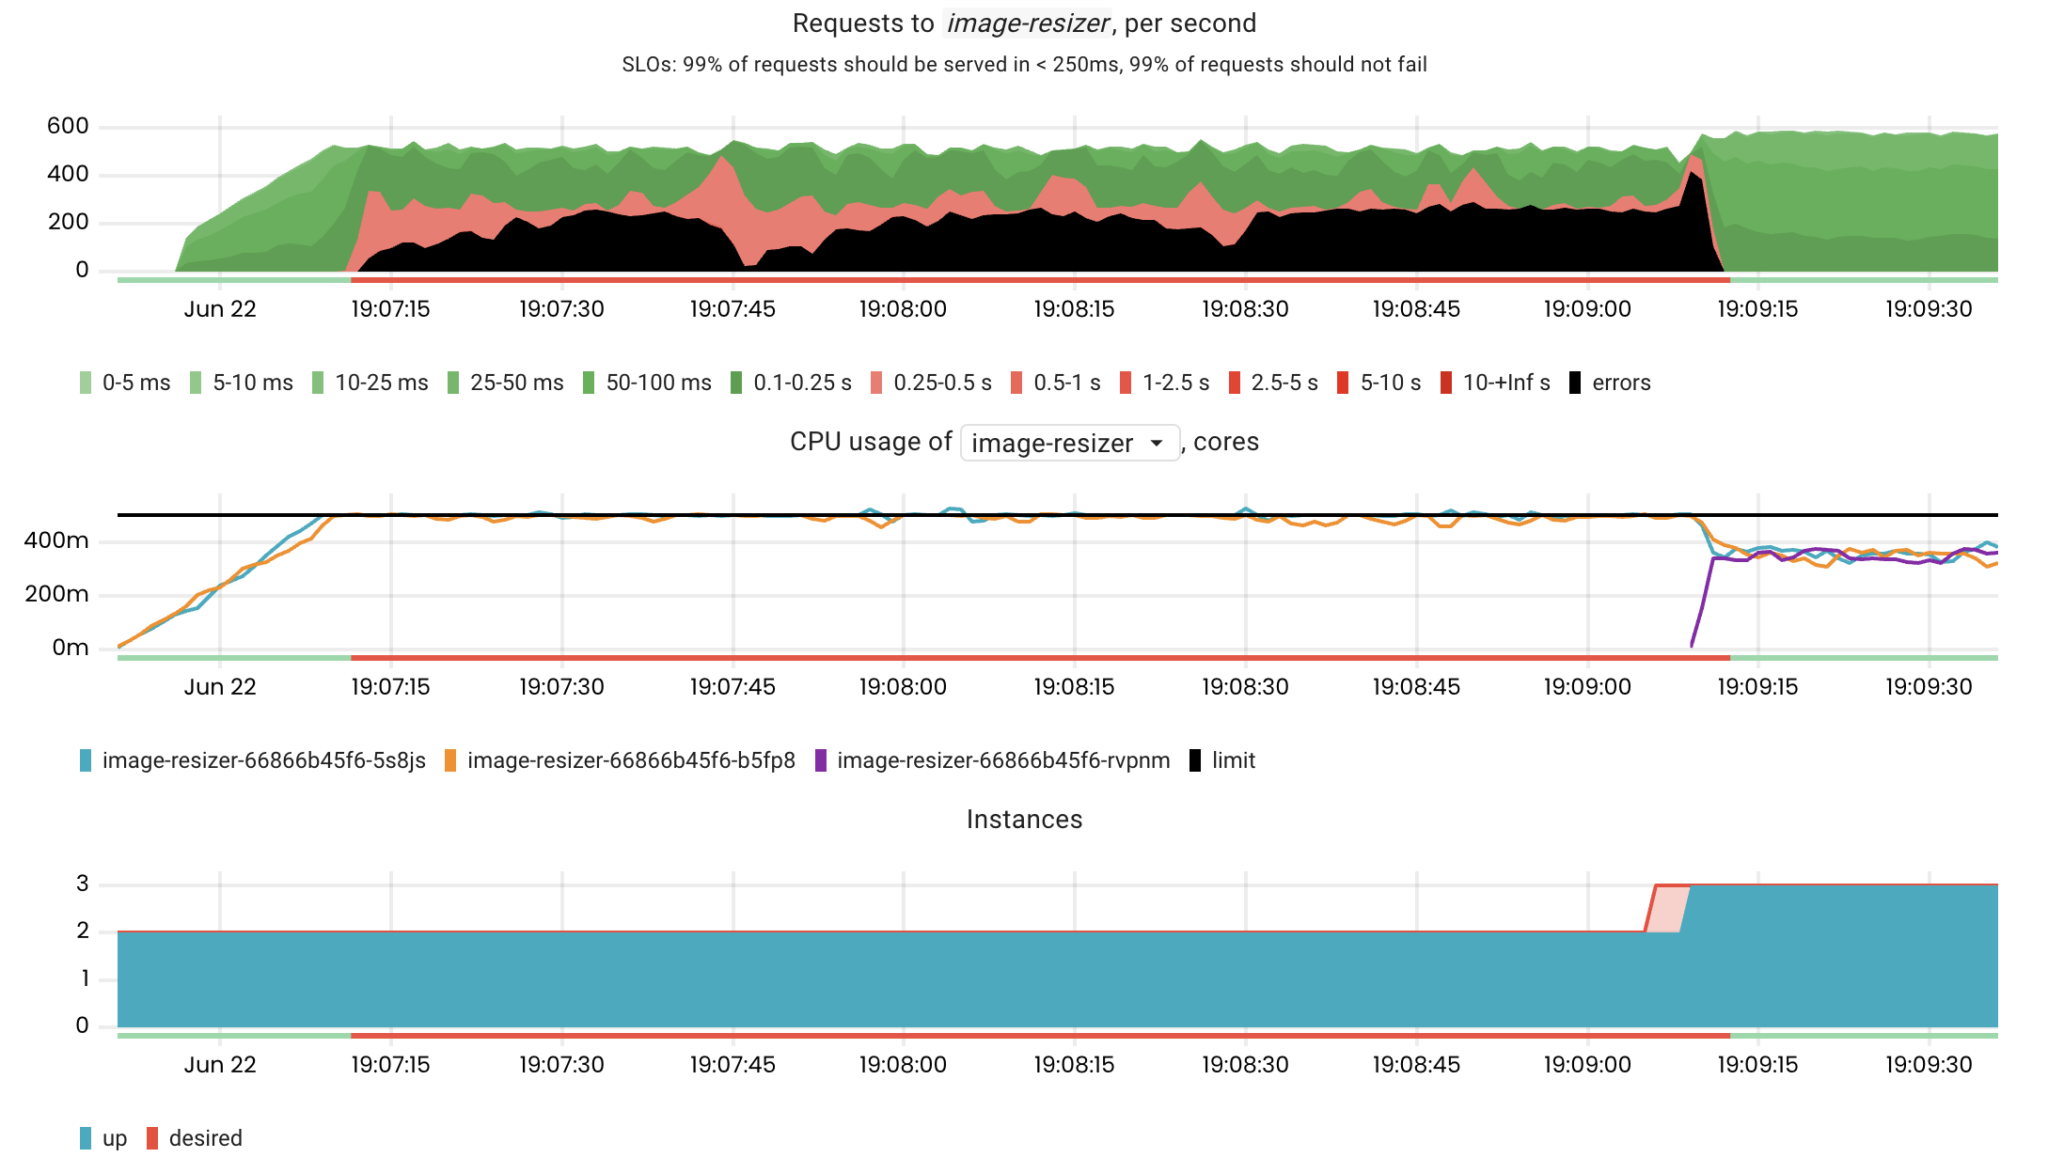
The HorizontalPodAutoscaler is a Kubernetes controller (a part of kube-controller-manager) and the relevant API resource. The controller can adjust the number of desired replicas for a particular Deployment or StatefulSet based on its metrics obtained from the metrics API.
Metrics-server is an add-on that collects resource metrics from kubelets and exposes them to kube-apiserver through the metrics API.
For this experiment, I provisioned a Kubernetes cluster on Amazon EKS. Managed Kubernetes clusters, such as EKS, GKE, and AKS, don’t allow users to configure their control planes. In other words, we cannot change the parameters of kube-apiserver, kube-controller-manager, and kube-scheduler.
I’ll use the image-resizer Deployment as my test application. It has a CPU limit of 500m (1/2 of a CPU core).
apiVersion: apps/v1
kind: Deployment
metadata:
  name: image-resizer
spec:
  selector:
    matchLabels: {name: image-resizer}
  replicas: 2
  template:
    metadata:
      labels: {name: image-resizer}
      annotations:
        prometheus.io/scrape: 'true'
        prometheus.io/port: '80'
    spec:
      containers:
        - name: image-resizer
          image: failurepedia/golang-app:0.35
          command: ["/golang-app", "-l", ":80"]
          resources:
            limits: {cpu: "500m", memory: "512M"}
            requests: {cpu: "500m", memory: "512M"}
          ports:
            - containerPort: 80
              name: http
          readinessProbe:
            httpGet: {path: /healthz, port: 80}
            initialDelaySeconds: 1
            periodSeconds: 1
The HPA is configured to increase the number of replicas if the pod CPU usage exceeds 50%:
apiVersion: autoscaling/v1
kind: HorizontalPodAutoscaler
metadata:
  name: image-resizer
  namespace: default
spec:
  maxReplicas: 3
  minReplicas: 2
  scaleTargetRef:
    apiVersion: apps/v1
    kind: Deployment
    name: image-resizer
  targetCPUUtilizationPercentage: 50
In order to increase the CPU usage of the app’s containers, I will gradually increase the number of simultaneous HTTP requests to the app.

As you can see in the charts above, it took 2 minutes and 5 seconds from reaching 50% CPU usage to scaling the app.
What does the HPA reaction time depend on?
The kube-controller-manager component has the –horizontal-pod-autoscaler-sync-period parameter which sets the period of fetching metrics for adjusting the number of replicas.
--horizontal-pod-autoscaler-sync-period duration
  The period for syncing the number of pods in horizontal pod autoscaler. (default 15s)
As I mentioned, it’s not possible to configure the control plane of an EKS cluster. However, the default value for this parameter is 15s, so it’s probably not an issue.
On the other hand, metrics-server has the –metric-resolution parameter, which is set to 60s by default.
--metric-resolution duration
  The resolution at which metrics-server will retain metrics, must set value at least 10s. (default 1m0s)
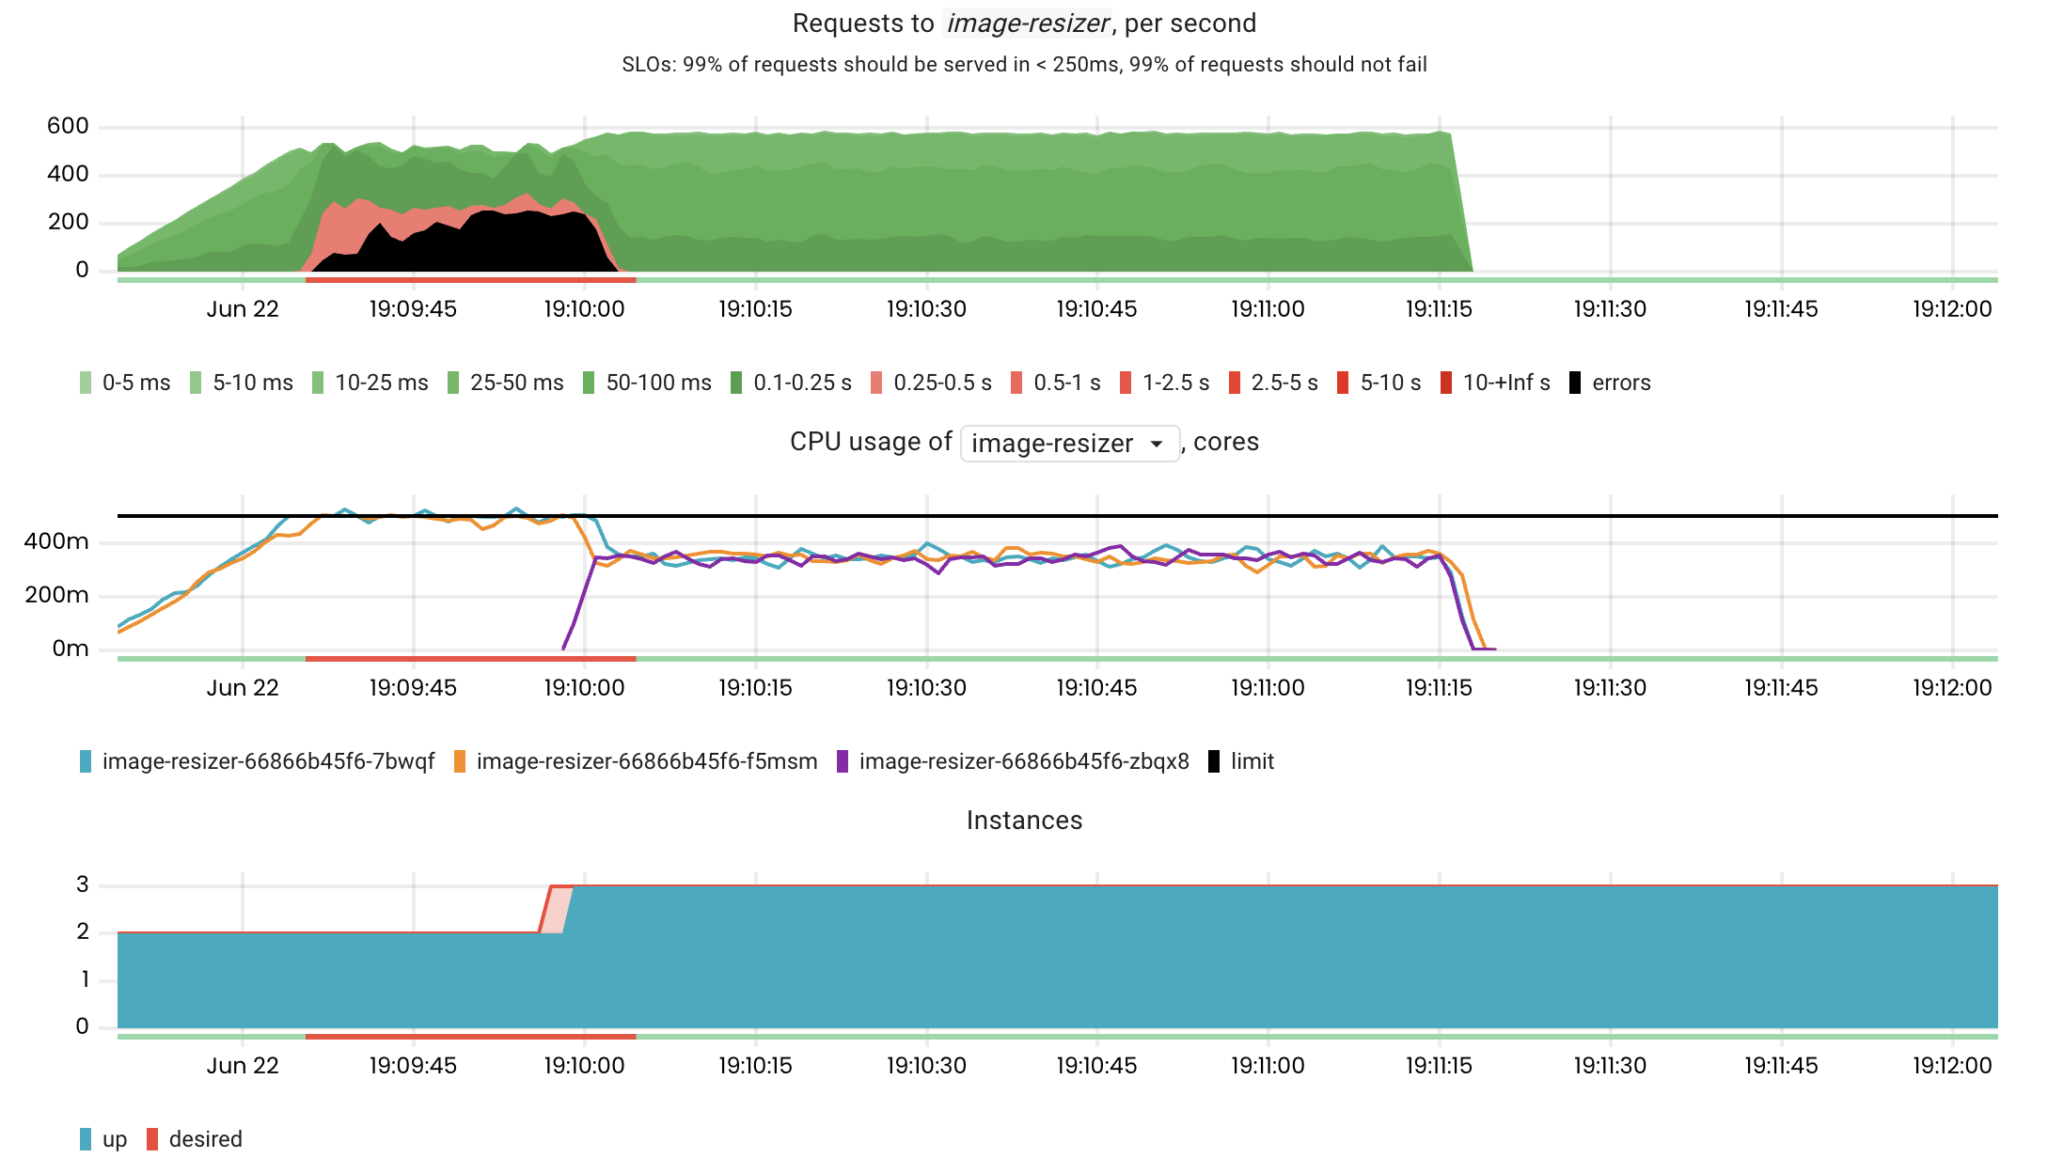
Let’s change this parameter to 10s and see how this affects our experiment.

Scaling now takes only 30 seconds!
It is a huge difference because if we had 100 requests/second, it would only affect 30 * 100 = 3000 requests instead of 2 * 60 * 100 = 12000 requests in the previous case.With this simple experiment, we found out how long it takes to scale an application based on resource metrics and how it can be optimized. Of course, such a drastic increase in workload doesn’t often happen in real life. However, it is super important to keep this limitation of the Kubernetes HPA in mind.