
There is a phenomenal amount of Observability tools on the market, coming in all shapes and sizes, offering many tools and approaches to solve what seems to be an endless number of problems.
It also can be overwhelming to use, hard to set up and expensive to run, especially if you are going with SaaS based market leaders like DataDog. Such cloud services tend to charge you based on number of tools you use and data you send in and retain, so it is their interest for you to use more… whenever you really need it or not.
What if instead you look at it differently, focus on essential observability – the data you actually need to resolve and prevent the problems and easy to use tools which come with it ? While it may sound contrarian, less may well be more, especially if wrangling with observability tools may is not your main job.
Let’s start from the top – what does your business need from Observability ? Leaving Security aside, which is quite a separate field of endeavor it is Business Applications which are Up, Well Performing and Running Efficiently (no one likes Financial or Environmental waste).
To Achieve those outcomes we need both Reactive and Proactive observability – Preventing a problem, or resolving it before it starts to impact application is better than recovering from downtime. Yet if application availability or performance is impacted we want to recover it as soon as possible, which first and foremost requires identifying a component which is the cause of the problem.
The more complicated a system you have with more components and interactions with them, the harder it becomes identifying specific malfunctioning component or service versus specific troubleshooting.
Being able to achieve these as efficiently as possible, in terms of cost in effort is what you can focus on evaluating observability solutions.
There are two “views” which tend to matter in most environments – infrastructure view and application view.
When we’re looking at infrastructure, we’re looking at the raw resources – Nodes, CPUs, Memory, Network, Storage. If resources are oversaturated all dependent applications can be impacted, provision too much and you’re wasting resources. Simple methods such as USE method by Brendan Gregg can be used to troubleshoot many physical and virtual resource issues.
When there is Application view, which is much more tricky – modern applications can have a lot of services, with complex dependencies among them as well as external APIs. Malfunctions can be caused from a variety of problems ranging from problems with infrastructure to issues with code, configuration, inadequate provisioning.
Different engineers may start looking through infrastructure and resource angle or applications and services angle, through as we increasingly have very dynamically changing or serverless environments, it is application view which is becoming increasingly important
Way too often observability deployment is… loose and optional, often because it is too hard making it infeasible to enforce, which creates “swiss cheese” of observability, leaving some incidents unnoticed or making it hard to spot the exact reason for failure.
Another challenge – some of the newer tools on the market may only cover new ways to deploy applications, such as only Kubernetes environments. This is great if you have everything deploy on Kubernetes as it avoids extra complexity, however it means they can’t be used in hybrid deployment environments, where some components may be deployed on VMs/bare metal.
When looking to implement essential observability, ease of deployment and minimal configuration effort is a key. Thankfully new technologies, such as eBPF allow you to get fantastic insights into application operation with zero configuration or code changes. Including generation of Open Telemetry (OTEL) Traces and profiling
Your first goal should be – no blindspots, when if you’re able to identify the problem but need to go deeper, you can always use additional tools.
We have built Coroot to be great, to provide such essential observability, it is easy to install, easy to run, it is affordable and allows you to pinpoint and resolve vast majority of the issues with just a few clicks.
Installation is easy – single Helm chart for your Kubernetes cluster or one line, zero configuration agent installation for VMs and Bare Metal deployments.
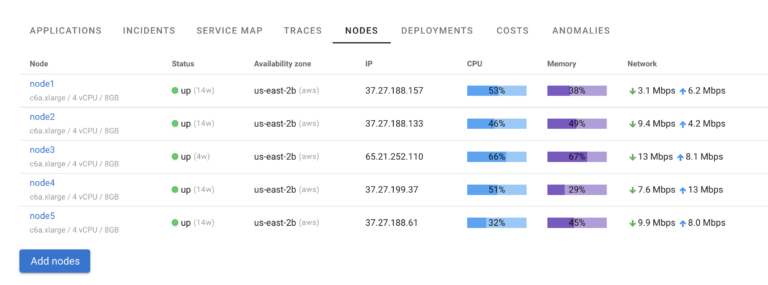
Coroot will provide you with Infrastructure Overview, highlighting utilization of most important resources
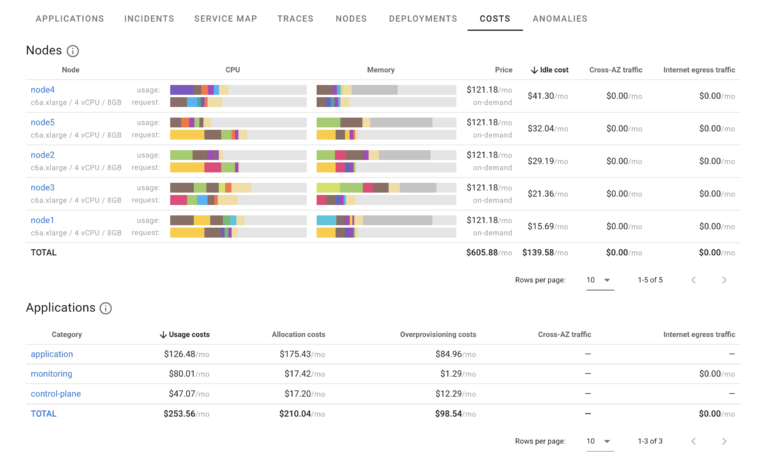
Estimated costs of running such infrastructure, including idle costs, cross-AZ and egress traffic as well as estimated breakdown of those per application
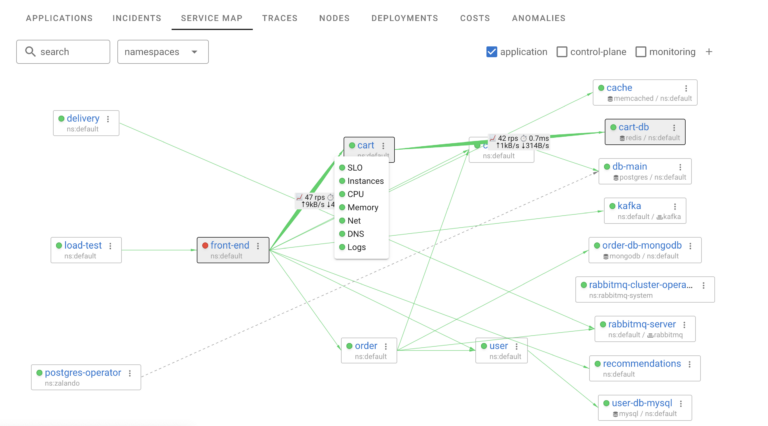
Service Map allows you to see all the services, how they are communicating with each other and which are experiencing problems. The Service map is based on actual service communication
With Application view providing the bird eye view of application status with focus on applications which are unhealthy
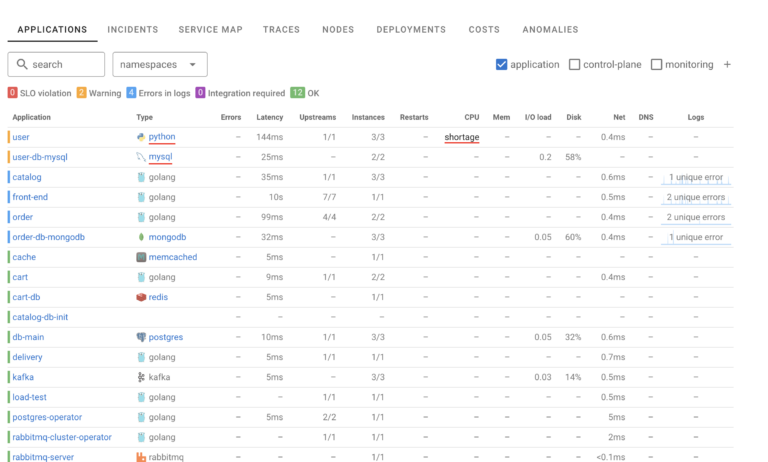
When it comes to Incidents Coroot uses clear, simple and “objective” definition of uptime and meeting SLO (Service Level Objectives), this eliminates need for configuration as well as very common problem of overmonitoring and creating too many irrelevant alerts, creating noise and actually reducing team alertness and responsiveness to real critical issues.
Just couple of clicks away is incidents Root Cause Analysis
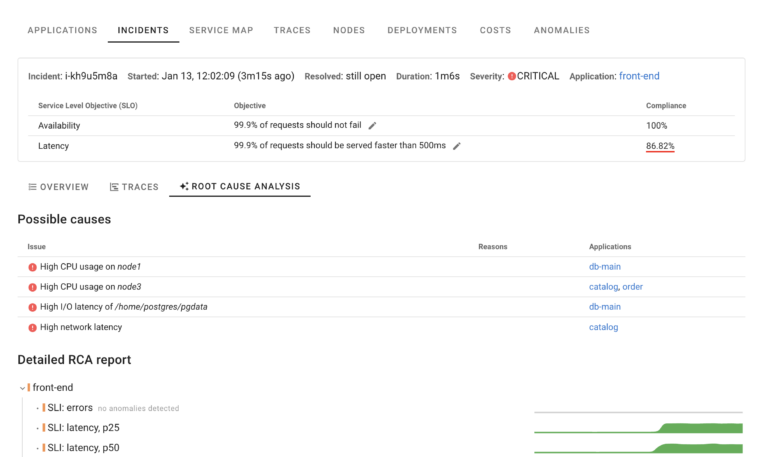
Which uses the knowledge about service dependency and automatic instrumentation to pinpoint what exactly is causing the issue (this particular feature is part of Coroot Enterprise)
Despite all these awesome features, Coroot is not for everyone of course. It is “Opinionated” Observability solution, which allows you to resolve problems quickly and effectively if you follow its methodology, some, especially “old school” engineers may rely on their own metrics or presentations which Coroot may not support.
If you’re someone who likes to build your own observability solutions out of Open Source building blocks, Coroot alone may not offer the extensibility you’re looking for. Yet many Coroot users run it in parallel with Grafana for custom dashboarding needs.
Coroot is also a solution which is broad, rather than deep. While it support large number of protocols and applications, and natively integrates with most popular databases such as PostgreSQL it is not as deep as special purpose tools, meaning for the most complicated issues you may need additional tools to resolve the problem.
Essential Observability does not have to be complicated. Starting with a minimalist approach to observability may be great place to start, picking something easy to deploy, easy to run, and something you do not have to pay an arm and a leg for. It is always easy to add more solutions if you absolutely need them. There are also a lot of good interactive and command line tools which you can use on as needed basis. If this philosophy speaks to you, make sure to give Coroot a try.