Profiling Java apps: breaking things to prove it works
 Nikolay Sivko
Coroot already does eBPF-based CPU profiling for Java. It catches CPU hotspots well, but that's all it can do. Every time we looked at a GC pressure issue or a latency spike caused by lock contention, we could see something was wrong but not what.
We wanted memory allocation and lock contention profiling.
So we decided to add async-profiler support to coroot-node-agent. The goal: memory allocation and lock contention profiles for any HotSpot JVM, with zero code changes. Here's how we got there.
Why async-profiler
We went with async-profiler. It's a native JVMTI agent used by pretty much everyone in the Java profiling space (Pyroscope, IntelliJ, Datadog). It can be loaded into a running JVM dynamically, supports CPU, allocation, and lock contention profiling in a single session, and works in unprivileged containers with no JVM flags. It outputs JFR format, which we parse using Grafana's jfr-parser.
How we integrated it
The integration follows the same pattern as our Java TLS agent:
The node agent detects Java processes by checking if the binary name ends with java, then confirms it's a HotSpot JVM by scanning /proc/<pid>/maps. It deploys libasyncProfiler.so (~600KB) into the container's filesystem at /tmp/coroot/ and loads the library into the JVM via the Attach API. async-profiler starts with event=itimer,interval=10ms,alloc,lock,jfr, capturing CPU, allocation, and lock events in a single session.
For data collection, every 60 seconds the agent sends a stop command (async-profiler finalizes the JFR file), reads the file from the host via /proc/<pid>/root/, and immediately sends a start command to begin a new recording.
The gap between stop and start is ~4ms. We considered using dump (which doesn't stop the profiler), but JFR output requires proper chunk finalization, a dump writes incomplete metadata that parsers reject. The stop/start approach guarantees valid output every time.
Each command goes through the JVM Attach protocol. It's one command per connection, HotSpot closes the socket after each response. After the first attach (which triggers the attach listener via SIGQUIT), subsequent connections just hit the existing Unix socket. Total overhead: ~2ms per command.
If another tool (Pyroscope Java agent, Datadog, etc.) already loaded async-profiler into the JVM, we detect it by scanning /proc/<pid>/maps and skip that process to avoid conflicts.
Enabling it
Set the ENABLE_JAVA_ASYNC_PROFILER=true environment variable on the node agent. In the Coroot custom resource:
apiVersion: coroot.com/v1
kind: Coroot
spec:
  nodeAgent:
    env:
      - name: ENABLE_JAVA_ASYNC_PROFILER
        value: "true"
No JVM flags, no application restarts, no agent JARs. The node agent handles everything automatically for all HotSpot JVMs it discovers. If you haven't enabled it yet, the JVM report shows a hint with a link to the docs.
What you get
Once enabled, Coroot adds new charts to the JVM report: allocation rate (bytes/s and objects/s) and lock contention (contentions/s and delay). Each chart has a profile button that opens the corresponding flamegraph, so you can go from "allocation rate spiked" to "this function is allocating all the memory" in one click.
We also export Prometheus metrics from the profiling data:
| Metric | Description |
|---|---|
container_jvm_alloc_bytes_total |
Total bytes allocated |
container_jvm_alloc_objects_total |
Total objects allocated |
container_jvm_lock_contentions_total |
Lock contentions |
container_jvm_lock_time_seconds_total |
Time waiting for locks |
These are true monotonic counters accumulated from the parsed profiles, so rate() gives you allocation rate and contention rate over time. We initially tried getting allocation metrics from hsperfdata (sun.gc.tlab.alloc), but those are per-GC-cycle snapshots that reset every collection. The async-profiler data is the real thing.
Seeing it in action
Enough theory. Let's break something and see how the profiling data helps us find the root cause.
We have a demo environment with several microservices. The one we'll focus on is order-service, a Spring Boot app running on JDK 21, backed by MySQL. It handles order creation, listing, and payment processing. Normal latency is under 10ms.
The demo has a built-in chaos controller that lets us inject failures via a REST API. We'll use two scenarios: lock contention and memory allocation pressure.
Lock contention
For this scenario, the chaos controller spawns background threads that repeatedly acquire a shared lock and hold it for 5ms:
private void startLockContention() {
    int count = Runtime.getRuntime().availableProcessors();
    for (int i = 0; i < count; i++) {
        Thread t = new Thread(() -> {
            while (!Thread.currentThread().isInterrupted()) {
                synchronized (CONTENTION_LOCK) {
                    try {
                        Thread.sleep(5);
                    } catch (InterruptedException e) {
                        Thread.currentThread().interrupt();
                        break;
                    }
                }
            }
        }, "chaos-lock-holder-" + i);
        t.setDaemon(true);
        t.start();
    }
}
Meanwhile, every incoming request also tries to acquire the same lock in the request interceptor:
if (chaosConfig.isLockContention()) {
    synchronized (ChaosController.CONTENTION_LOCK) {
        // Request thread blocks here while holder threads occupy the lock
    }
}
After enabling this scenario, we can immediately see the impact on the order-service SLIs. The latency heatmap shows a clear shift, requests that used to complete in under 10ms are now taking 100ms+, with some exceeding a second:
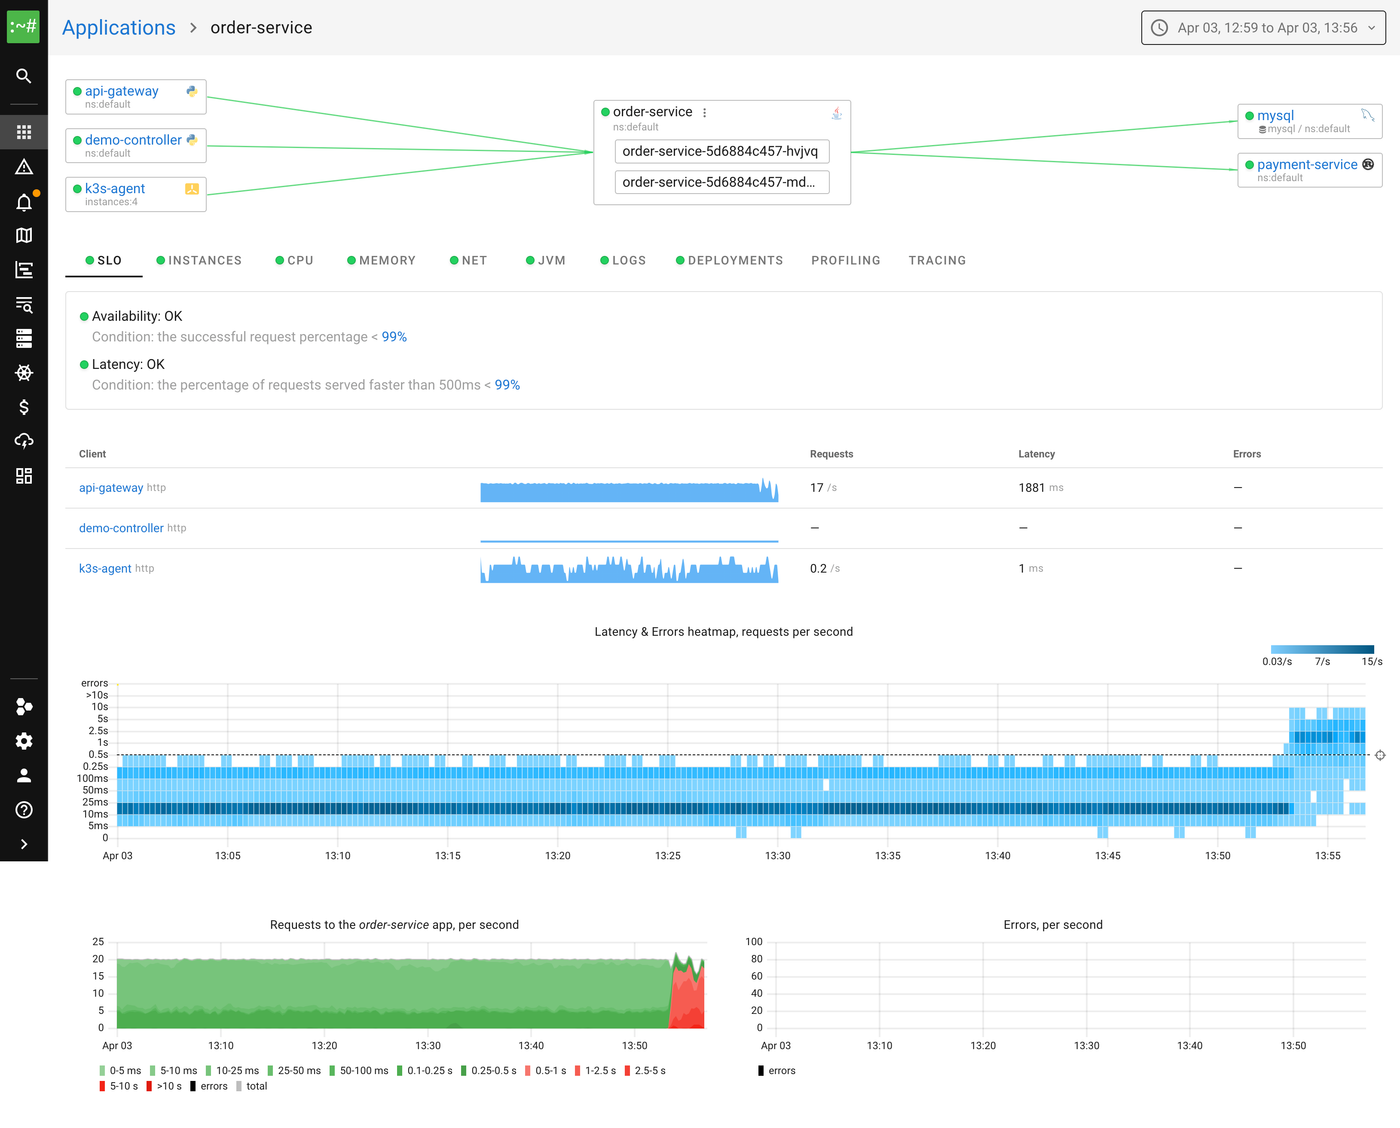
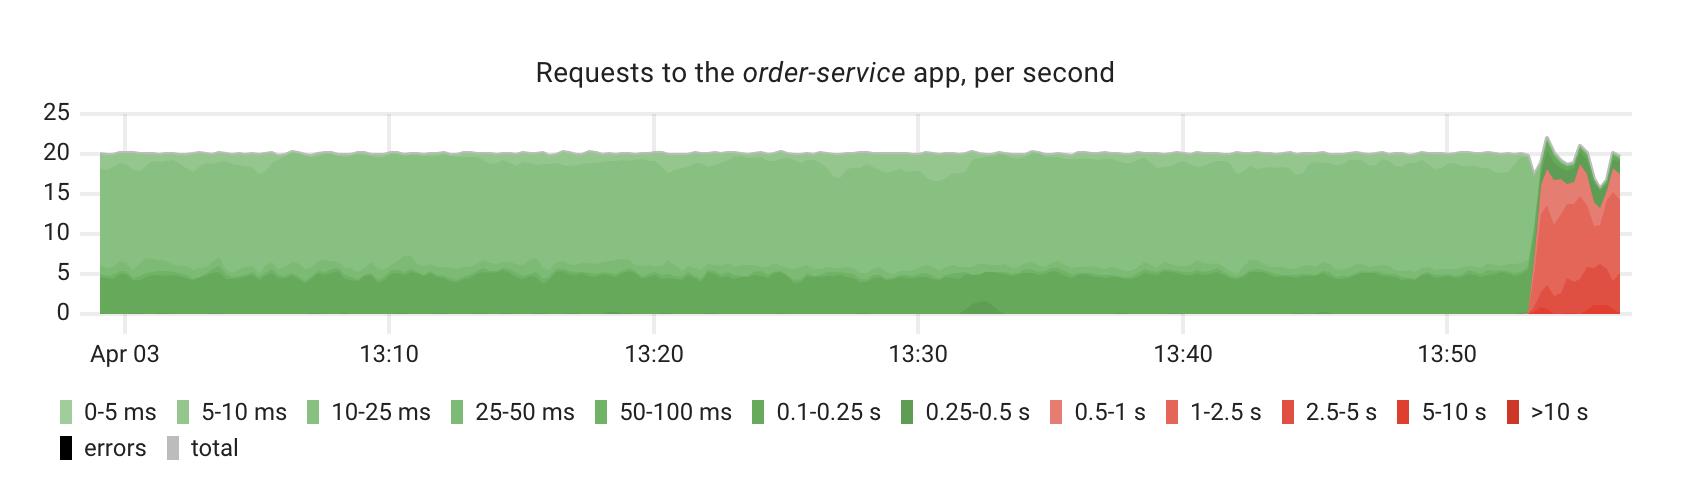
The request rate chart confirms the degradation, you can see the latency distribution shifting from green (fast) to red (slow):
Now let's look at the JVM report. The lock contention chart shows a clear spike, the lock wait time jumps from near zero to significant values:
Let's click the profile button on the lock contention chart to open the flamegraph:
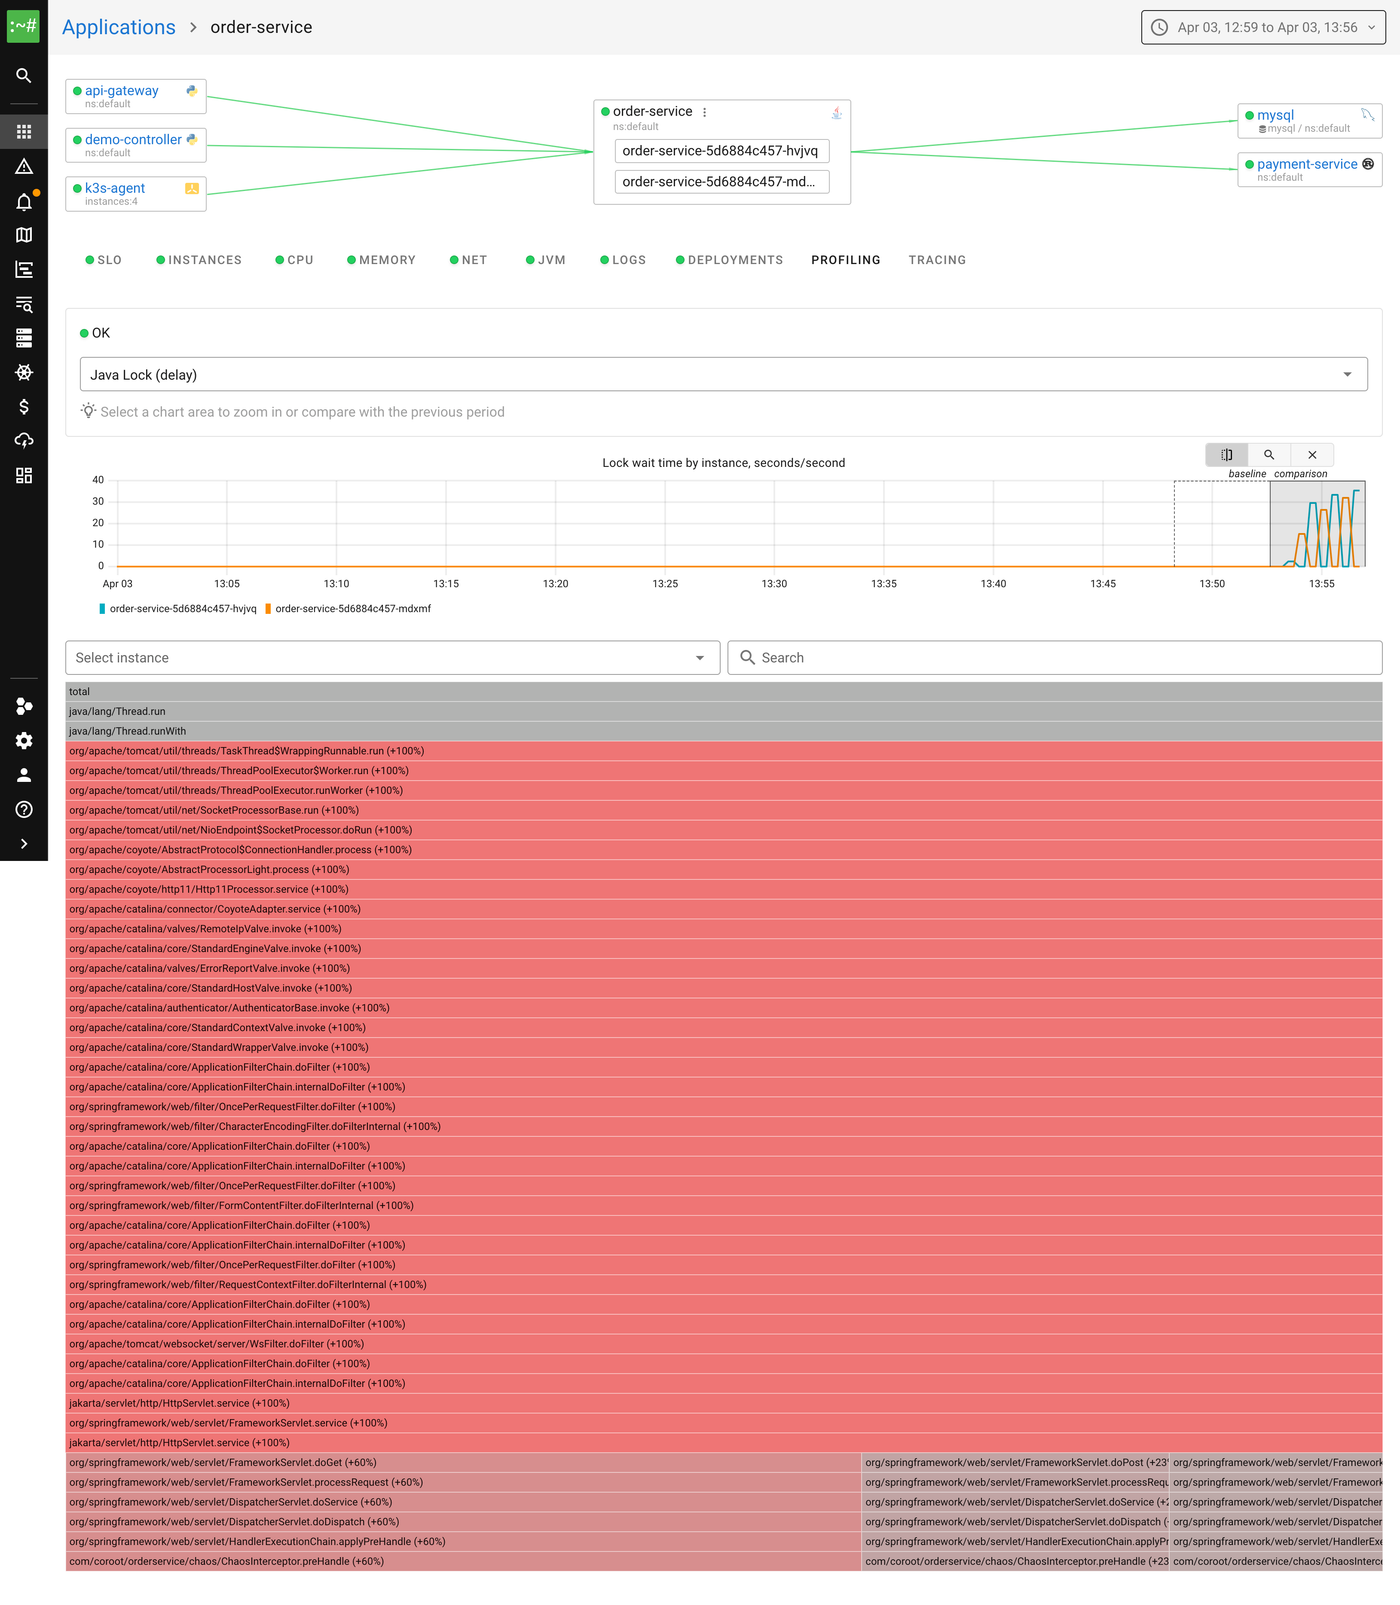
The flamegraph shows the Java Lock (delay) profile in comparison mode. Red means "more time waiting for locks than before." Reading from top to bottom, we can see the Spring request processing chain, and at the bottom of the flamegraph, our ChaosInterceptor.preHandle method, the one that tries to acquire the shared lock. That's the bottleneck.
Without profiling, all we'd know is "requests are slow." With the lock profile, we can point at the exact monitor and the exact code paths waiting for it.
Memory allocation pressure
The demo also supports a GC pressure scenario. It starts a background thread that continuously allocates and discards 256 MB byte arrays:
private void startGcPressure(int megabytes) {
    Thread t = new Thread(() -> {
        while (!Thread.currentThread().isInterrupted()) {
            byte[] garbage = new byte[megabytes * 1024 * 1024];
            garbage[0] = 1; // prevent dead-code elimination
        }
    }, "chaos-gc-pressure");
    t.setDaemon(true);
    t.start();
}
The JVM is configured with -Xmx=512m, so allocating 256 MB chunks means the GC runs after almost every allocation.
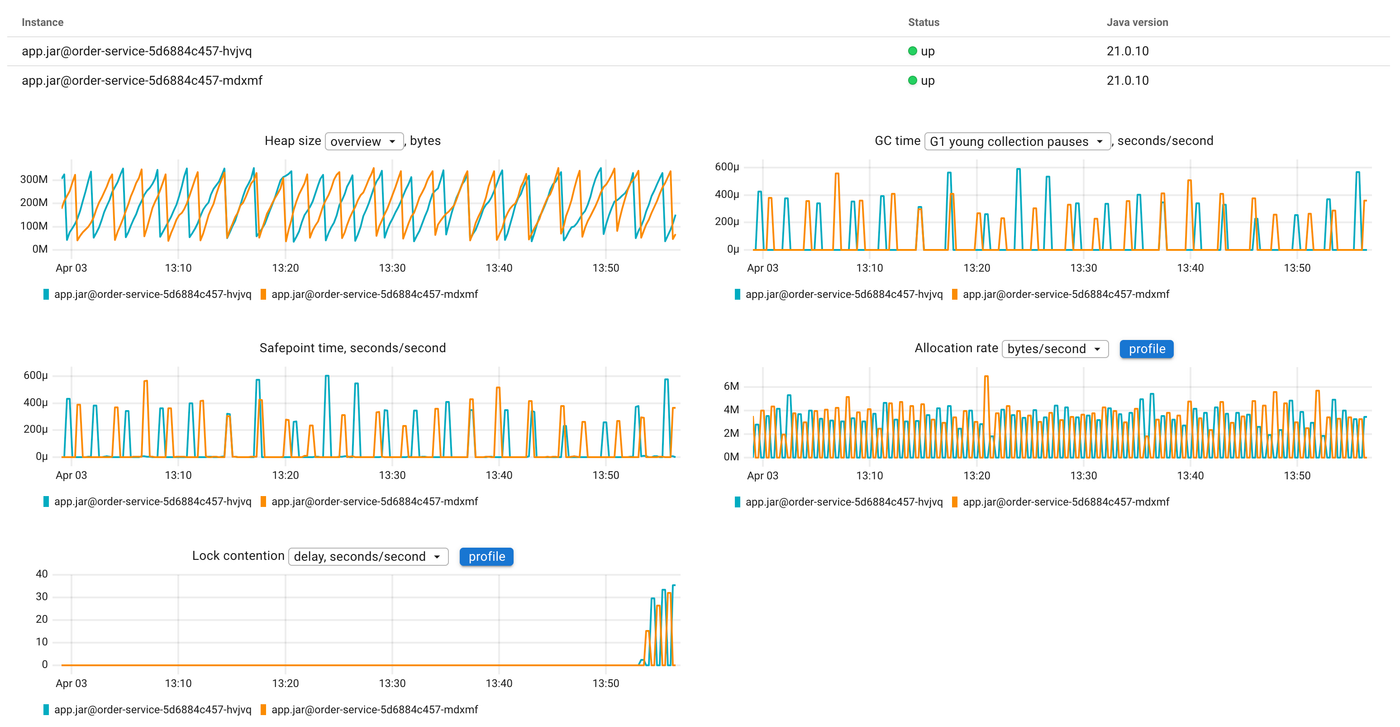
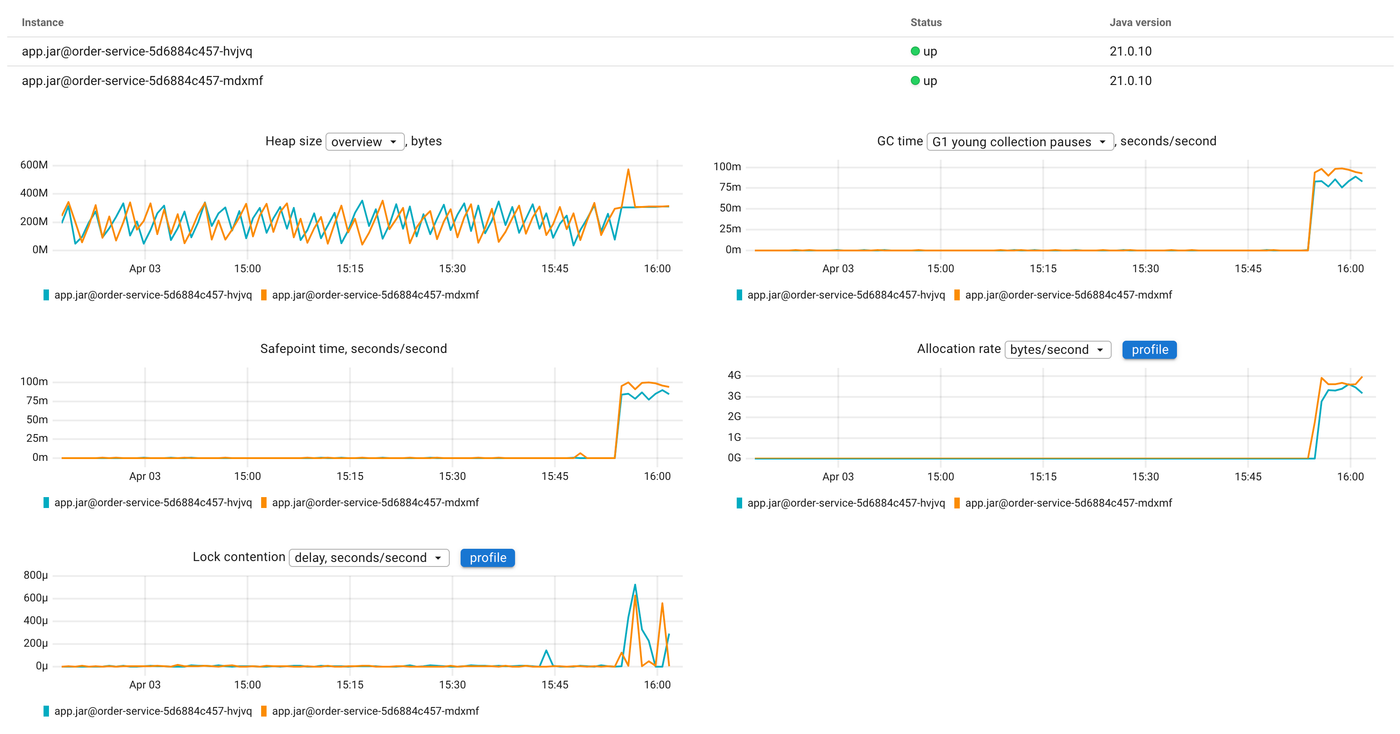
After enabling this scenario, the JVM report tells the story. The allocation rate chart spikes from near zero to ~3 GB/s. GC time jumps in lockstep, the young collection pauses go from occasional to constant:
Now let's click the profile button on the allocation rate chart to see what is allocating all this memory:
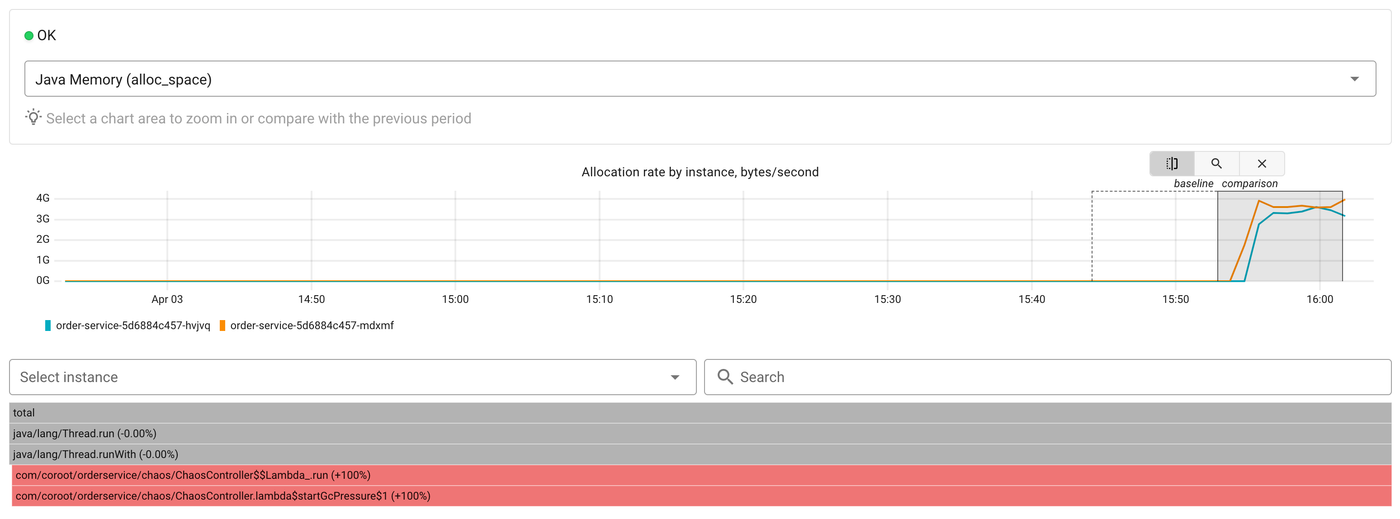
The flamegraph shows the Java Memory (alloc_space) profile in comparison mode. At the bottom we can see ChaosController$$Lambda.run and startGcPressure marked as +100%, they didn't exist in the baseline period. The top-level Thread.run frames confirm this is a background thread, not request processing.
Without profiling, all we'd see is GC time going up. With the allocation profile, we know exactly which code is responsible.
Try it
Java profiling in Coroot now covers CPU, memory allocations, and lock contention. It requires no code changes, no JVM flags, and works with any HotSpot JVM. Enable it with a single environment variable and you get flamegraphs, time-series metrics, and a direct link between "something changed" and "here's the code."
All of this is open source. Give us a star on GitHub if you find it useful, check out the documentation, and join us on Slack if you have questions or ideas.